
(T2108 measures the percentage of stocks trading above their respective 40-day moving averages [DMAs]. It helps to identify extremes in market sentiment that are likely to reverse. To learn more about it, see my T2108 Resource Page. You can follow real-time T2108 commentary on twitter using the #T2108 hashtag. T2108-related trades and other trades are sometimes posted on twitter using the #120trade hashtag. T2107 measures the percentage of stocks trading above their respective 200DMAs)
T2108 Status: 63.0%
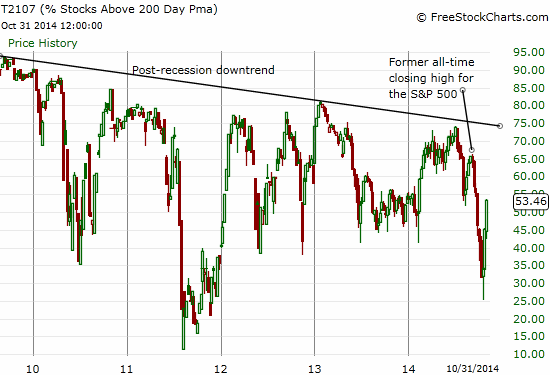
T2107 Status: 53.4%
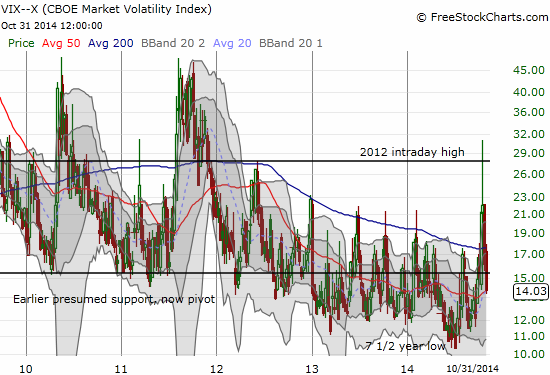
VIX Status: 14.0
General (Short-term) Trading Call: Aggressive bears should have already stopped out of shorts and should be stopped out of more of them now; bulls should take a few more profits to fund future buys on dips, otherwise hold. 50DMA breakout and new all-time highs put bulls right back in control.
Active T2108 periods: Day #10 over 20%, Day #8 over 30%, Day #5 over 40%, Day #3 over 50%, Day #1 over 60% (ending 37 days under 60%), Day #80 under 70%
Reference Charts (click for view of last 6 months from Stockcharts.com):
S&P 500 or SPY
SDS (ProShares UltraShort S&P500)
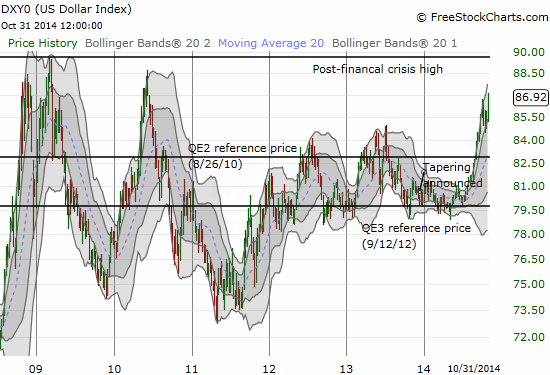
U.S. Dollar Index (volatility index)
EEM (iShares MSCI Emerging Markets)
VIX (volatility index)
VXX (iPath S&P 500 VIX Short-Term Futures ETN)
EWG (iShares MSCI Germany Index Fund)
CAT (Caterpillar).
Commentary
Nevertheless, I have halved my shorts because my short position, for now, is dead wrong. $SPY
— Douglas Kass (@DougKass) October 31, 2014
Regular readers of my T2108 Update could probably see this (partial) capitulation coming from the bears, especially the permabears. I have been absolutely amazed, anecdotally of course, at how the bounce from oversold conditions seemed only to firm up bearish positions and biases rather than shake assumptions and cause some introspection. The bear trap was particularly potent because October is a month that, on average, delivers the biggest drawdowns in a given year…only to end with a rally going into the seasonally stronger months of November through April.
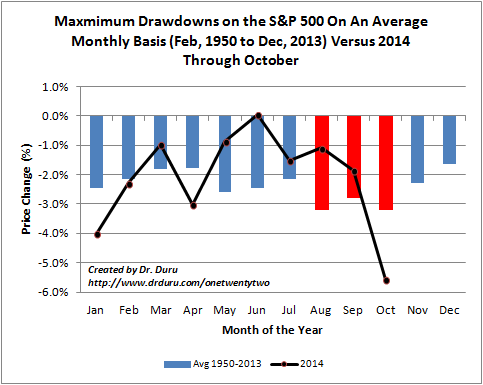
This year’s October drawdown was well above average and reflected in the persistence and stubbornness of the quasi-oversold and true oversold conditions I chronicled as a part of the September and then October sell-offs. The depths of the selling and market sentiment solidified my own contrarian viewpoint (that is ironically quite in-line with the longer-term uptrend in the S&P 500) enough to compel me to write the technical case for a bottom in the stock market in mid-October. This opinion has motivated me to buy the dips aggressively since the apparent bottom, especially on call options for ProShares Ultra S&P500 (SSO). I sold the latest round of SSO call options into what I will now call the Bank of Japan exclamation point.
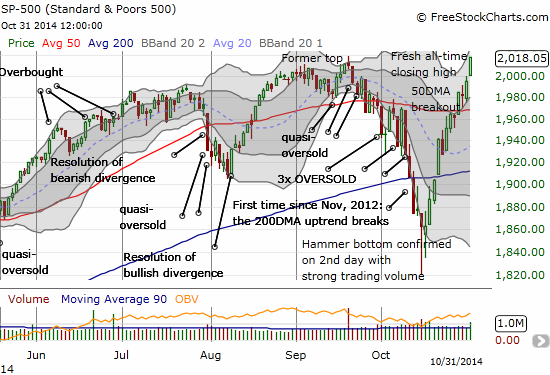
By inciting a worldwide buying fest with more quantitative easing, the Bank of Japan (BoJ) definitively wiped away the notion of the much ballyhooed “Ali Blah Blah” top. This is a reference to September 19th, when Ali Baba (BABA) went public right as the S&P 500 hit a top, printed with an evening star whose topping implications were confirmed with the selling that quickly followed. As of Friday, I changed the label from a confirmed top to a former top. I think bears, especially of the perma variety, are still looking back on that day with a heavy sense of nostalgia.
I still say the Ali Blah Blah Top is intact for balance of year. $SPY
— Douglas Kass (@DougKass) October 30, 2014
It turns out that risk happens fast, even to the upside. I happened to be caught net long the Japanese yen (FXY) at the time the BoJ dropped its surprise, and I had to move quickly to rebalance short (still in process!). In retrospect, it made no sense to leave myself vulnerable to the BoJ meeting like that given the rumblings about the BoJ *eventually* getting forced to ease more at some point. The irony deepens given I am a long-standing yen BEAR; I just try to be opportunistic from time-to-time with long yen trades or use them as hedges. Another lesson learned indeed! Fortunately, I was prepared with stocks and that more than made up for the currency-born mistake.
While bulls have every reason to be excited here, I should duly note that the rally is finally reaching toward overbought levels. At the current rate, T2108 will hit overbought just in time for Friday’s U.S. jobs report. T2108 closed at 63.0% on Friday. T2107, the percentage of stocks trading above their 200DMAs, is 53.5%. The chart below suggests there is plenty of upside left for this cycle even if T2108 does not quite reach overbought before the S&P 500 hits the next corrective phase.
Volatility has been smashed once again and even the uptrend I thought would hold has given way. However, the potential reward for fading volatility has shrunk considerably.
And of course, my favorite currency indicator, the Australian dollar (FXA) versus the Japanese yen (FXY), is definitively supporting the bullish bias in the market.
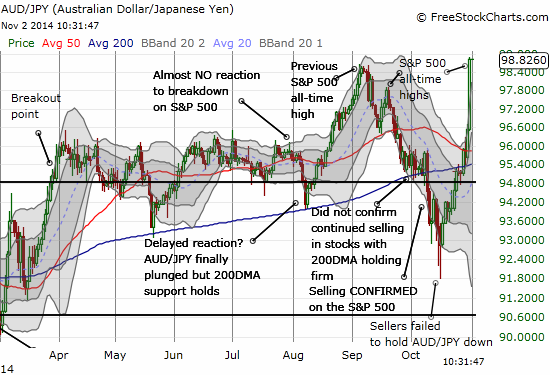
In summary, the bias, the baton, and the controls still rest firmly with the bulls. Another corrective phase will surely come, but I will not try to get ahead of it. The last corrective phase likely shook out a LOT of weak hands from the market. Central Bank action is definitively supporting the market and will force many institutional investors to (re)chase the market higher. Sell-offs tend to be milder from November to April. The economic data for the U.S. continues to look fine. In other words, it is NOT a time to be stubbornly bearish.
Fortunately, simple technicals combined with T2108 give us all the tools we need to lower the risk of making the next bearish trade(s) whenever that moment comes. For example, I do not even want to think about getting bearish until T2108 hits overbought territory OR the S&P 500 closes below the 50DMA. And even THEN, I will wait for confirmations. Until then, I am still buying each dip with a laser focus on SSO call options in order to lower surprise downside risks. I also fully endorse a few hedges just in case…risk can happen fast after all.
Oh, and if you have any doubt the bears are VERY motivated to continue working the nervous consciousness of those who are still left to panic, here is tonight’s warning about a collapse…
Euro crashing http://t.co/5OpUfLR8ZG
— Douglas Kass (@DougKass) November 3, 2014
And here is the euro versus the U.S. dollar tonight at the time of writing with a 5-minute chart (I used fxcm.com because freestockcharts.com is not working correctly:
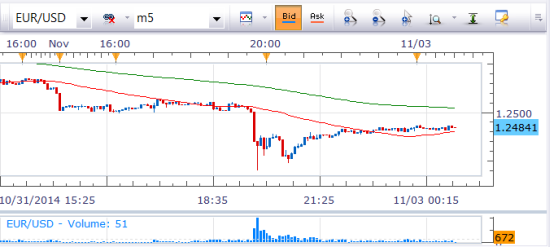
EUR/USD dropped as low as 1.244 before sharply rebounding. I think most traders who were not panicking were BUYING the sudden plunge. Especially with no news around to explain it, this is a classic “fade the gap” type of opportunity. Mind you – I remain VERY bearish the euro, so I had no interest in attempting that trade. However, you will never see me blasting defcon 4 alarms about the on-going decline in the euro…or if you do, please pinch me and wake me up.
Source: FXCM.com
Daily T2108 vs the S&P 500
")
Black line: T2108 (measured on the right); Green line: S&P 500 (for comparative purposes)
Red line: T2108 Overbought (70%); Blue line: T2108 Oversold (20%)
Weekly T2108

*All charts created using freestockcharts.com unless otherwise stated
The T2108 Resource Page
Expanded daily chart of T2108 versus the S&P 500
Expanded weekly chart of T2108
Be careful out there!
Full disclosure: net long the Australian dollar, still net short the Japanese yen (adjustment almost complete), long SSO shares, net short the euro