
(T2108 measures the percentage of stocks trading above their respective 40-day moving averages [DMAs]. It helps to identify extremes in market sentiment that are likely to reverse. To learn more about it, see my T2108 Resource Page. You can follow real-time T2108 commentary on twitter using the #T2108 hashtag. T2108-related trades and other trades are posted on twitter using the #120trade hashtag)
T2108 Status: 55.8%
VIX Status: 14.5
General (Short-term) Trading Call: Short (bearish bias) still with caveats (see below)
Active T2108 periods: Day #152 over 20%, Day #1 over 50% (overperiod), Day #13 under 60% (underperiod), Day #14 under 70%
Reference Charts (click for view of last 6 months from Stockcharts.com):
S&P 500 or SPY
SDS (ProShares UltraShort S&P500)
U.S. Dollar Index (volatility index)
EEM (iShares MSCI Emerging Markets)
VIX (volatility index)
VXX (iPath S&P 500 VIX Short-Term Futures ETN)
EWG (iShares MSCI Germany Index Fund)
CAT (Caterpillar).
Commentary
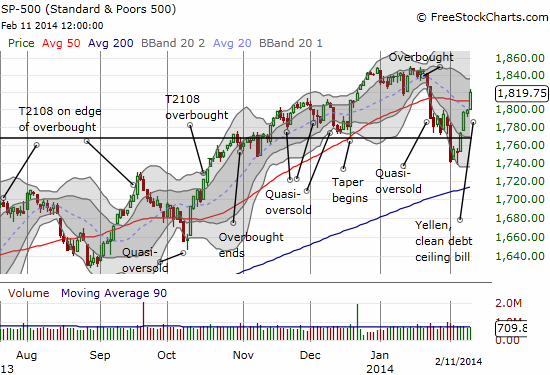
The bears are again in full retreat. The S&P 500 (SPY) has wiped away the bearish angst from last Monday with a 4.5% surge in six days. The breakdown on post-taper support has been reversed, the resistance from the consolidation before that breakdown lasted all of one day, and today the S&P 500 sheered right through 50-day moving average (DMA) resistance. As I stated in previous posts, the 50DMA was where I would get interested in buying ProShares Ultra S&P500 (SSO) puts. I did not wait for confirmation and am now sitting on two tranches in the red.
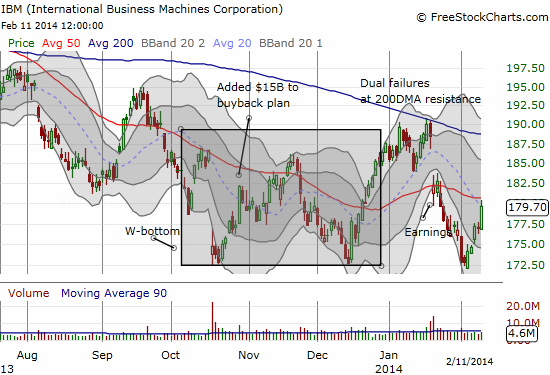
Along with the SSO puts, I got rid of the last of my short-term trades on the long side. In particular, International Business Machines (IBM) delivered a picture-perfect bounce from a retest of its W-bottom, no doubt benefiting from the tailwind of the general market surge. Approaching presumed 50DMA resistance was a perfect point to sell y fistful of call options.
T2108 closed at 55.8%. It has surged along with the S&P 500 and recovered from what I was hoping was a trip toward oversold conditions. Instead, T2108 bottomed on an intraday basis at 35%, not even bothering to crack 30% where I would have been comfortable getting more bullish and getting more aggressive with bullish bets. I spent most of my aggressive energies on fading volatility.
I was a bit early in building my put positions in iPath S&P 500 VIX ST Futures ETN (VXX) and ProShares Ultra VIX Short-Term Fut ETF (UVXY). I also sold these put options a bit early (Friday, Feb 7), but the fundamental thesis turned out to be correct in an even more spectacular way than I could have expected. The market’s fickle storytelling has changed once again. The narrative of taper as confirmation of economic strength turned to taper as destroyer of emerging markets and generator of volatility. NOW, the narrative says that tapering is actually harmless because Janet Yellen, the new Fed Chair, has confirmed an era of extra low interest rates for as far as the eye can see. This news of course is not even new or surprising.
I think an understanding of sentiment is sufficient for making sense of the madness (with a little bit of hindsight mixed in). In the context of a high-flying bull market, excuses to sell come suddenly and sharply, but they are ultimately low on fuel. No news has come along to produce a frenzy of fear that can feed on itself. As a result, the VIX has tumbled from a close of 21.4 on February 3rd to 14.5 today, with a brief 2-day visit at the classic 15.35 pivot. The 32% plunge helped to crush volatility products like UVXY.
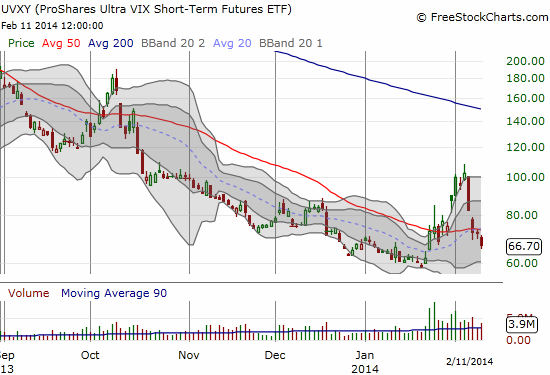
I still think fading volatility (the VIX) will continue to be very profitable for some time to come.
It seems likely that the S&P 500 will continue to rally from here given its strong close above the 50DMA. My eager purchase of puts will likely NOT get rewarded, but I am holding out a sliver of hope that the market at least produces its typical post-Fed reversal. Ironically perhaps, I am maintaining the bearish bias. I previously called this a “soft bearishness” because I was fading volatility as my main trade and looking to fade the S&P 500 only at the 50DMA. Now, I have a more solid bearish trading bias with the SSO puts in place. I am also now more focused on trying out shorts/puts on the setups of individual stocks. Once/if T2108 hits true overbought levels, I will revisit this strategy: it could be a momentum to switch bullish and ride an extended overbought rally, or instead it could be a time to reload on SSO puts. Stay tuned on that one.
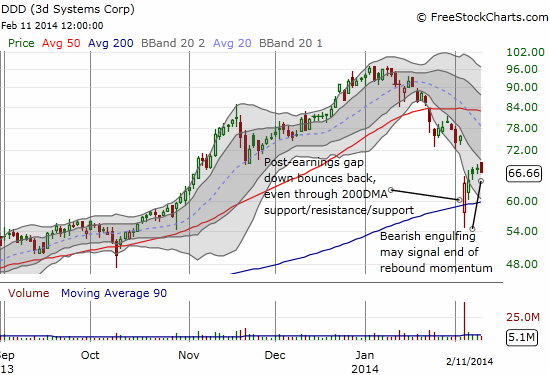
A VERY interesting example of a bearish setup on an individual stock came in the form of 3d Systems (DDD). Last week, it was another great example of fading a move beyond the Bollinger Bands (BB). Now, it looks like momentum has finally waned with a bearish engulfing pattern on a strong up day in the general market. A retest of 200DMA support could happen very quickly from here as the sharp downtrend between the lower-BBs looks set to continue.
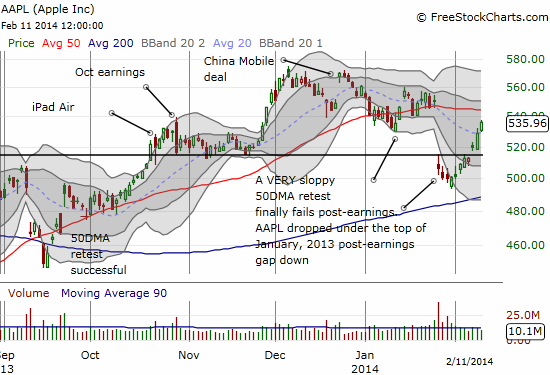
Finally, Apple (AAPL) is one stock that cannot be denied now. On Friday, it popped right over the support turned resistance from the top of the January, 2013 earnings gap down. Rather performing inversely to the market, Apple is following the market and outperforming. While trading volume does not appear abnormally high, it still seems the magic of an Apple buyback remains in play. The Apple Trading Model (ATM) is now back in synch with a simple prediction when using just 2014 data: buy Monday through Wednesday, sell the last two days of the week (I am of course tempering this simple model with comparisons to predictions using at least 2013 data – click here for latest regression trees). At the current pace, AAPL will very soon make us all wonder what in the world was all that fuss on January 28th when sellers could not dump stock fast enough in the wake of earnings…
(In a final trading note, I successfully closed out my trade on the Turkish lira which was going short USD/TRY. Yet one more example of how fading volatility worked well this last cycle).
Daily T2108 vs the S&P 500
")
Black line: T2108 (measured on the right); Green line: S&P 500 (for comparative purposes)
Red line: T2108 Overbought (70%); Blue line: T2108 Oversold (20%)
Weekly T2108

*All charts created using freestockcharts.com unless otherwise stated
Related links:
The T2108 Resource Page
Expanded daily chart of T2108 versus the S&P 500
Expanded weekly chart of T2108
Be careful out there!
Full disclosure: long SPHB and SPLV and SSO puts; long VXX shares; long AAPL shares and put spread; long DDD puts