
(T2108 measures the percentage of stocks trading above their respective 40-day moving averages [DMAs]. It helps to identify extremes in market sentiment that are likely to reverse. To learn more about it, see my T2108 Resource Page. You can follow real-time T2108 commentary on twitter using the #T2108 hashtag. T2108-related trades and other trades are posted on twitter using the #120trade hashtag)
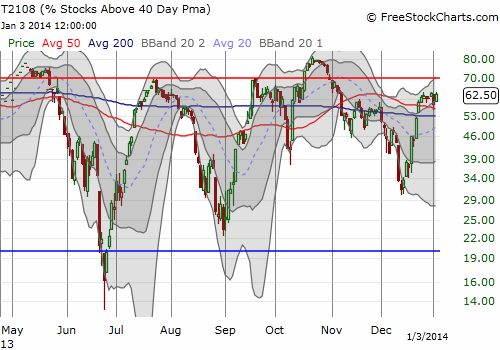
T2108 Status: 62.5%
VIX Status: 13.8
General (Short-term) Trading Call: Hold (bullish bias)
Active T2108 periods: Day #126 over 20%, Day #1 over 60% (overperiod), Day #41 under 70%
Reference Charts (click for view of last 6 months from Stockcharts.com):
S&P 500 or SPY
SDS (ProShares UltraShort S&P500)
U.S. Dollar Index (volatility index)
EEM (iShares MSCI Emerging Markets)
VIX (volatility index)
VXX (iPath S&P 500 VIX Short-Term Futures ETN)
EWG (iShares MSCI Germany Index Fund)
CAT (Caterpillar)
Commentary
Today FELT like a down day but the S&P 500 was essentially flat, and the VIX dropped from 14.2 to 13.8.
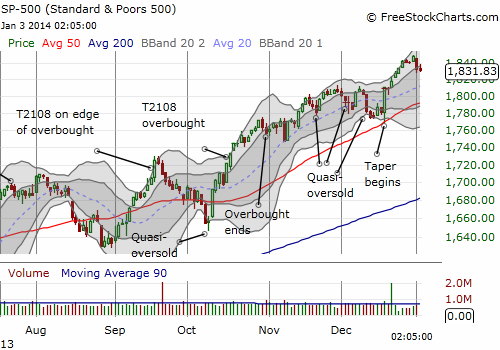
Moreover, T2108 actually went UP on the day. This sets up a bullish divergence. At 62.5%, T2108 is back to its high for the cycle. This level has served as a ceiling since Christmas Eve. A breakout above this apparent resistance sets up a fresh rally for the S&P 500. With the S&P 500 still over 1800, my bias remains bullish all things considered.
Perhaps today felt like a down day because I was staring too much at Apple’s (AAPL) latest plunge. The stock dropped 2.2% and closed right on top of its 50-day moving average (DMA). In my last AAPL chart review just on December 30th, I noted that filling in the gap up from the China Mobile (CHL) deal set up a retest of the 50DMA. I just did not think it would happen THIS quickly. Ouch!
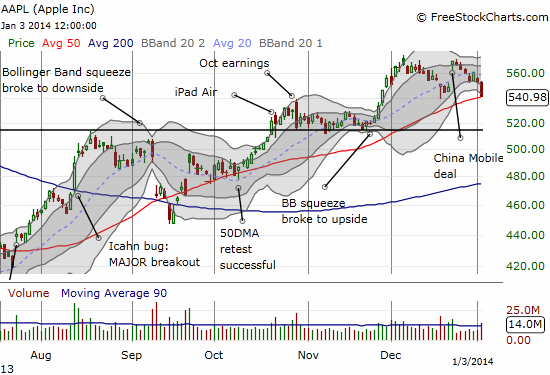
This was an ugly retest in several ways…
- AAPL far under-performed the general market, including the NASDAQ
- Volume picked up on the selling
- AAPL showed little “interest” in bouncing off the 50DMA (it practically careened into support)
- The selling comes on the heels of what should have been spectacularly good news, even if it was expected.
The Apple Trading Model (ATM) projects follow-through selling for Monday with 84% odds (yikes). However, the branch of the model making this prediction is not stable; in this case, a small change in the way the S&P 500 closed would have created high odds of upside. Regardless, this retest will likely be important and critical for Apple to sustain the momentum it has obtained since September’s breakdown and November’s consolidation. Apple has not tested this support since early October. The September test was VERY sloppy. If the 50DMA gives way, then the stock is set up for a relatively rapid retest of even more critical support from the January, 2013 post-earnings gap down (see the thick, black, horizontal line in the chart above).
Be careful out there!
Daily T2108 vs the S&P 500
")
Black line: T2108 (measured on the right); Green line: S&P 500 (for comparative purposes)
Red line: T2108 Overbought (70%); Blue line: T2108 Oversold (20%)
Weekly T2108

*All charts created using freestockcharts.com unless otherwise stated
Related links:
The T2108 Resource Page
Expanded daily chart of T2108 versus the S&P 500
Expanded weekly chart of T2108
Be careful out there!
Full disclosure: long SPHB and SPLV and SSO puts (pairs trade); long AAPL shares and calls