
(T2108 measures the percentage of stocks trading above their respective 40-day moving averages [DMAs]. It helps to identify extremes in market sentiment that are likely to reverse. To learn more about it, see my T2108 Resource Page. You can follow real-time T2108 commentary on twitter using the #T2108 hashtag. T2108-related trades and other trades are posted on twitter using the #120trade hashtag)
T2108 Status: 80.5% (Day #4 overbought)
VIX Status: 13.3 (still close to multi-year lows)
General (Short-term) Trading Call: Short. Bail if S&P 500 fails to reverse after 2 or 3 days
Active T2108 periods: Day #81 over 20% (overperiod), Day #4 over 70%, Day #1 over 80% (overperiod)
Reference Charts (click for view of last 6 months from Stockcharts.com):
S&P 500 or SPY
SDS (ProShares UltraShort S&P500)
U.S. Dollar Index (volatility index)
EEM (iShares MSCI Emerging Markets)
VIX (volatility index)
VXX (iPath S&P 500 VIX Short-Term Futures ETN)
EWG (iShares MSCI Germany Index Fund)
CAT (Caterpillar)
Commentary
T2108 is only on its fourth day in overbought territory, yet it is already above 80%. This could be a moment where my overhauled approach to T2108 overbought conditions pays off. At a minimum, the new patience I have implemented saved me from watching ProShares Ultra S&P500 (SSO) puts melt away over the past 3 or 4 days.
The following two graphs relate duration above the 80 and 85% T2108 thresholds to the performance of the S&P 500 during that time. Moreso than most such charts, there is a relatively clear correlation between duration and performance. For the 80% overperiod, there exists a period of 4 or 5 days where significant downside opportunity exists on the S&P 500 (SPY). After that threshold, the S&P 500 re-enters very bullish territory. The most bullish outcome is for T2108 to churn away between 80% and 85%, allowing the stock market’s strong majority to continue plowing higher.
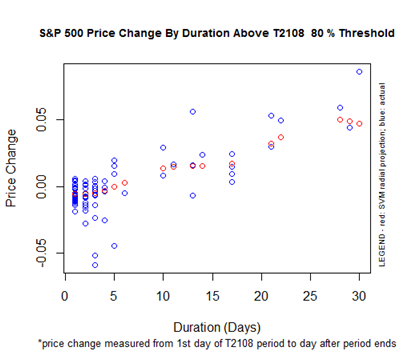
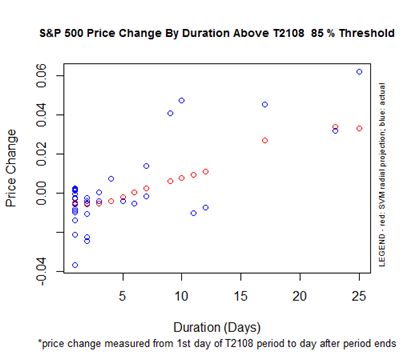
Given these views, it makes sense to try a short here, but the opportunity is only for the next few days. After that, it makes sense to actually hop onto the upward trend for as long as it appears to last. I will be buying a small handful of SSO puts on Wednesday and will get slightly more aggressive if I can buy them on a gap up in the S&P 500. If the S&P 500 refuses to cooperate from there, I will keep the puts and phase into SSO calls (never hurts to have some kind of hedge on when trading long in overbought conditions). This will be an important test for the overhauled T2108 Trading Model. Stay tuned.
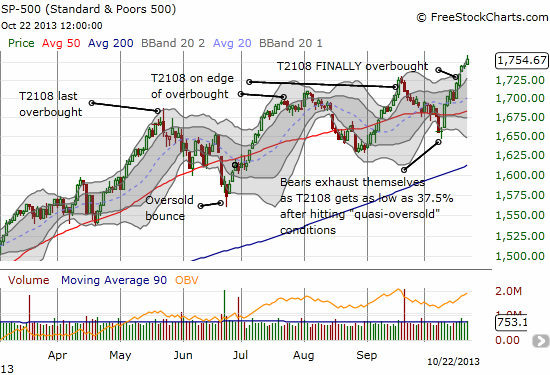
Daily T2108 vs the S&P 500
")
Black line: T2108 (measured on the right); Green line: S&P 500 (for comparative purposes)
Red line: T2108 Overbought (70%); Blue line: T2108 Oversold (20%)
Weekly T2108

*All charts created using freestockcharts.com unless otherwise stated
Related links:
The T2108 Resource Page
Expanded daily chart of T2108 versus the S&P 500
Expanded weekly chart of T2108
Be careful out there!
Full disclosure: no positions (yet!)