
(T2108 measures the percentage of stocks trading above their respective 40-day moving averages [DMAs]. It helps to identify extremes in market sentiment that are highly gap down to reverse. To learn more about it, see my T2108 Resource Page. You can follow real-time T2108 commentary on twitter using the #T2108 hashtag. T2108-related trades and other trades are posted on twitter using the #120trade hashtag)
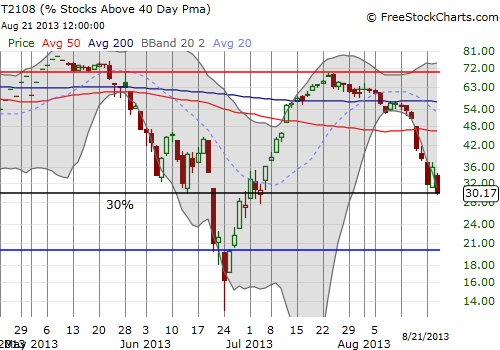
T2108 Status: 30.2%
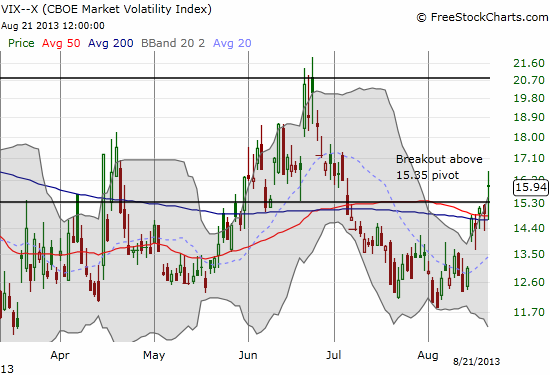
VIX Status: 15.9 (breakout)
General (Short-term) Trading Call: Hold.
Active T2108 periods: Day #40 over 20% (overperiod), Day #4 under 40% (underperiod), Day #64 under 70%
Reference Charts (click for view of last 6 months from Stockcharts.com):
S&P 500 or SPY
SDS (ProShares UltraShort S&P500)
U.S. Dollar Index (volatility index)
VIX (volatility index)
VXX (iPath S&P 500 VIX Short-Term Futures ETN)
EWG (iShares MSCI Germany Index Fund)
CAT (Caterpillar)
Commentary
The S&P 500 (SPY) delivered on Tuesday with a bounce from quasi-oversold conditions. The T2108 Trading Model (TTM) had predicted bounces after each of the three straight oversold conditions, but the last prediction was the strongest and the one in which I had the most confidence (it included conditionality on the VIX). This exercise taught me even more about the nuances of the model and confirmed that this approach is far from automated!
The bad news is that bounce was extremely weak. The closing gain was only 0.38%, and the day included a fade from 50DMA resistance. After today’s close, the S&P 500 faded from 50DMA for the third day in a row. This has once again become a market on edge and further downside risks are mounting.
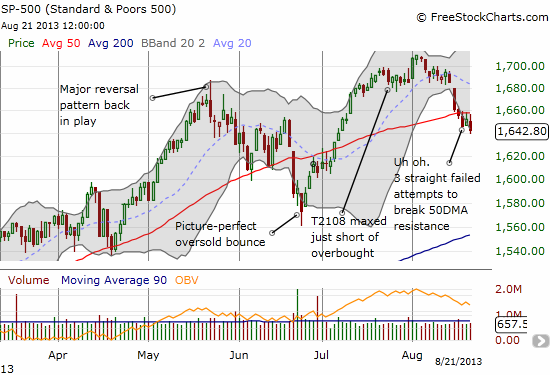
Perhaps just like at the June lows, you, the reader, may be asking why not just short the market with the downside risks mounting? My answer remains the same – I prefer to play the odds and stick to the rules of the trade. At the June lows, I whipped out a whole host of concerns and technical red flags, yet, with the market oversold (T2108 <= 20%) and quasi-oversold before that, I stuck with the odds of a bounce. The subsequent rally was proof positive of the approach although there was almost no way I could have predicted such a strong rally. The risk/reward proposition for playing oversold bounces (with well-structured positions) is high enough to justify sticking with the odds. The quasi-oversold play is one I added to the arsenal this year. What makes it particularly attractive when T2108 is approaching 30%, like now, is that from 2010 to 2011, T2108 bottomed nicely several times at 30%. At those times, I had no trading rule or mechanism for crafting trades except to consider lowering the oversold threshold. The chart of T2108 below shows how T2108 tried desperately to cling to 30% as support before succumbing to true oversold conditions in late June. Note how each dip created quasi-oversold conditions (two days in a row where T2108 declines produce an overall "steep" decline of, say, at least 15-20%.)
The risks for more downside went up particularly because the VIX, the volatility index, finally broke above the 15.35 pivot point. The odds are pretty good the VIX is going to continue higher, implying that the S&P 500 will go lower. This will confirm the 50DMA as stiff resistance.
At this point, I am hoping for a quick plunge into oversold conditions although it would ruin the SSO calls I still hold to play quasi-oversold. I did not sell into Tuesday’s rally although it would have allowed me to exit the overall position flat. I did this because a breakout above the 50DMA would have delivered very large profits – again, worth the risk of holding. Now, it is looking like a bounce from true oversold conditions will be the next moneymaker.
I close with a 5-minute intraday look at the S&P 500 to show the sheer madness that ensued after the minutes of the last Federal Reserve meeting were released. It is impossible to see this from the daily chart.
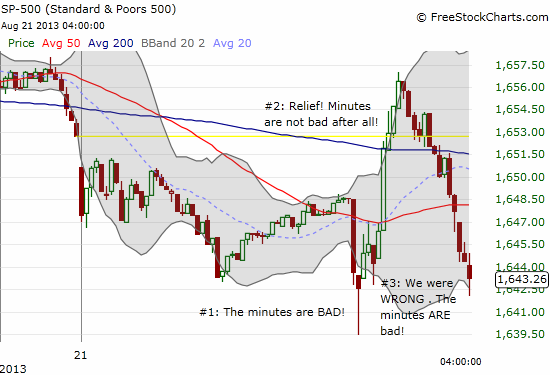
These wild swings were matched in currency markets.
It was if people reading at different speeds and with different lenses were trading at different times. Indeed, the headlines that came pouring out were contradictory. Some saw the minutes indicating broad support for Bernanke’s “plan” to begin tapering in September. Others decided to zero in on points of disagreement. It is enough to make me read the minutes for myself…
In the meantime, brace yourself. Jackson Hole is coming up next weekend.
Daily T2108 vs the S&P 500
")
Black line: T2108 (measured on the right); Green line: S&P 500 (for comparative purposes)
Red line: T2108 Overbought (70%); Blue line: T2108 Oversold (20%)
Weekly T2108

*All charts created using freestockcharts.com unless otherwise stated
Related links:
The T2108 Resource Page
Expanded daily chart of T2108 versus the S&P 500
Expanded weekly chart of T2108
Be careful out there!
Full disclosure: long SSO calls