
(T2108 measures the percentage of stocks trading above their respective 40-day moving averages [DMAs]. It helps to identify extremes in market sentiment that are highly likely to reverse. To learn more about it, see my T2108 Resource Page. You can follow real-time T2108 commentary on twitter using the #T2108 hashtag. T2108-related trades and other trades are posted on twitter using the #120trade hashtag)
T2108 Status: 45.6% (quasi-oversold marginally)
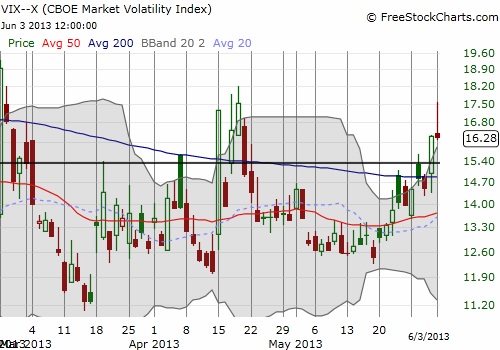
VIX Status: 16.3 (flat after STRONG fade)
General (Short-term) Trading Call: Close shorts for now. Next short-term opportunity: breakdown below bear/bull dividing line and/or on retest of short-term downtrend line
Active T2108 periods: Day #31 of over 40% (overperiod), Day #2 under 50% (underperiod), Day #8 under 70% (underperiod)
Reference Charts (click for view of last 6 months from Stockcharts.com):
S&P 500 or SPY
SDS (ProShares UltraShort S&P500)
U.S. Dollar Index (volatility index)
VIX (volatility index)
VXX (iPath S&P 500 VIX Short-Term Futures ETN)
EWG (iShares MSCI Germany Index Fund)
CAT (Caterpillar)
Commentary
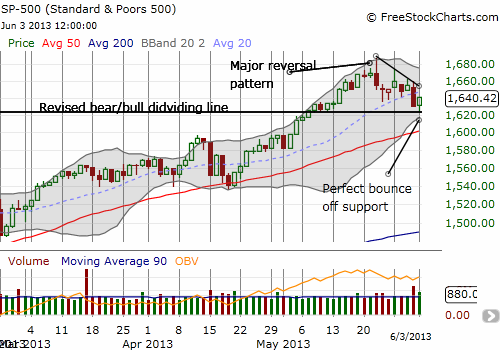
The strong tendency for a rally to begin a new month won out today after a tough technical battle. (See Friday’s update for details on the various clashing technical signals going into today’s trading). The S&P 500 (SPY) dropped exactly to the bear/bull dividing line before turning around to finish UP for the day.
Only the intraday view of T2108 and the VIX gave hints to the dramatic turn-around from bearish gloom to hopeful buying.
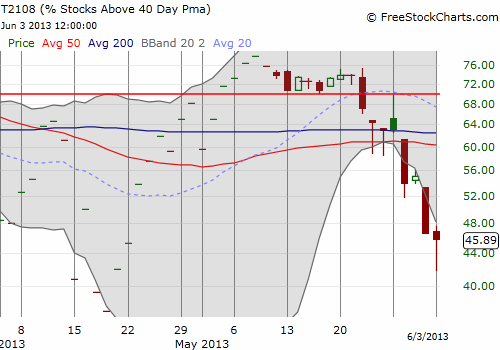
T2108 dropped as low as 41.7% before recovering sharply. With the S&P 500 testing key support and T2108 hitting a deeply quasi-oversold condition (2 straight down days for T2108), I ran the T2108 Trading Model (TTM) to get a projection for tomorrow’s (Tuesday, June 4) one-day performance. As I suspected, TTM projected very high odds of a bounce (81%). I tweeted the results and announced the closing of ALL my SSO puts. This extremely successful trade was yet another example of the power of the overhauled T2108 Model combined with the availability of intraday data for T2108. Almost on cue, the S&P 500 rose from support, T2108 started its recovery, and suddenly, what should have been tomorrow’s bounce seems to have occurred today!
With the S&P 500 bounce in place, T2108 still remains quasi-oversold but only marginally. The TTM NOW projects a 63% chance of a DECLINE tomorrow. Recall that the TTM is much more reliable with up than down predictions. Nevertheless, it is consistent with an apparent bearish divergence between the S&P 500 and T2108. This projection is also consistent with the likely cap provided by the short-term downtrend drawn from the all-time highs for the S&P 500.
There are now NO bullish trade triggers until some kind of oversold condition occurs (hopefully around the 50DMA). Until then, a retest of the short-term downtrend line and/or a break of the bear/bull dividing line trigger bearish trades. I will be much more aggressive with SSO puts on fades than chasing downward momentum.
Daily T2108 vs the S&P 500
")
Black line: T2108 (measured on the right); Green line: S&P 500 (for comparative purposes)
Red line: T2108 Overbought (70%); Blue line: T2108 Oversold (20%)
Weekly T2108

*All charts created using freestockcharts.com unless otherwise stated
Related links:
The T2108 Resource Page
Expanded daily chart of T2108 versus the S&P 500
Expanded weekly chart of T2108
Be careful out there!
Full disclosure: no positions