(T2108 measures the percentage of stocks trading above their respective 40-day moving averages [DMAs]. To learn more about it, see my T2108 Resource Page. You can follow real-time T2108 commentary on twitter using the #T2108 hashtag. T2108-related trades and other trades are posted on twitter using the #120trade hashtag)
T2108 Status: 39.6%
VIX Status: 18.1
General (Short-term) Trading Call: Hold with bearish hedges
Reference Charts (click for view of last 6 months from Stockcharts.com):
S&P 500 or SPY
SDS (ProShares UltraShort S&P500)
U.S. Dollar Index (volatility index)
VIX (volatility index)
VXX (iPath S&P 500 VIX Short-Term Futures ETN)
EWG (iShares MSCI Germany Index Fund)
CAT (Caterpillar)
Commentary
When the volatility index becomes itself very volatile, you know it is time to take a pause, step back, and view the market from a larger angle. Friday’s 9.% plunge in the VIX erased almost 2/3 of the previous day’s gains. Suddenly, the volatility index looks a LOT less dangerous than it did when I wrote the last T2108 Update.
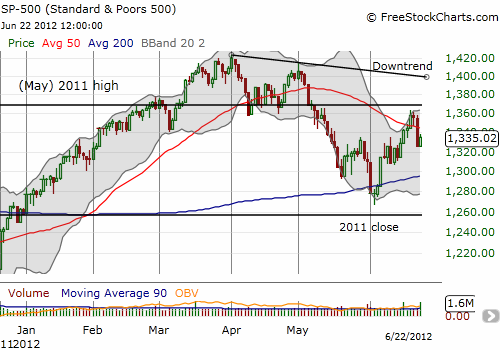
I would describe the current churn as “stop and go traffic.” Just when I think the market is heading somewhere, I have to apply the brakes and reassess. There are two fundamental truths in the S&P 500 chart: (1) the downtrend from the 52-week highs remains in place, and (2) the uptrend from the June lows, as supported by the 200DMA, also remains intact. This is a formula for range-bound trading. Only a decisive break in either direction will generate cleaner and clearer trading opportunities.

T2108 is currently trading at a higher range, bouncing between 30-50% over the last six trading days. This is essentially limbo: T2108 cannot communicate any new information bouncing around in here.
Reviewing the market from a larger angle, it seems clear that I need to simplify the trading strategy…starting with reducing it. Next, I will focus almost exclusively on major indices. Individual stocks will only make sense AFTER some major news announcement. I am particularly mindful that earnings season is again around the corner and the possibilities loom for major earnings warnings.
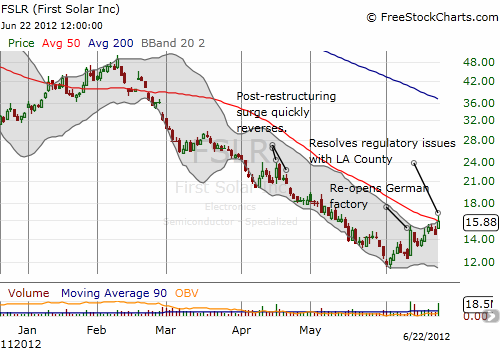
One stock that continues to benefit from good news flow is First Solar (FSLR). It continues to trend upward and for a brief moment finally punched through its 50DMA. The fade to close the day placed the stock directly under this resistance (no, you cannot make this stuff up!). I sold call options into today’s 9.2% jump. FSLR is now 34.9% off its all-time lows (of course, it is still a complete disaster overall).

Today’s fresh plunge pushed VXX toward its all-time lows; perhaps a triple bottom is not in the cards after all! VXX gave up its entire 11.1% gain from Thursday. The recent trading in VXX has indicated to me that there could be good profit in trading puts against shares. I have already completed two rounds of successful trades in weekly puts. The idea here is to hold a small amount of shares in the case of a large pop – I am now assuming the market is at higher risk of selling off sharply at any time – but in general, aggressively press bets that VXX is returning to its long-term, secular decline. This is an experiment, and I will need to end it if I have to trade excessively or too aggressively to maintain profitability.
Daily T2108 vs the S&P 500

Black line: T2108 (measured on the right); Green line: S&P 500 (for comparative purposes)
Weekly T2108

*All charts created using freestockcharts.com unless otherwise stated
Related links:
The T2108 Resource Page
Expanded daily chart of T2108 versus the S&P 500
Expanded weekly chart of T2108
Be careful out there!
Full disclosure: long SDS, SSO; long VXX calls, puts, and shares; long FSLR
