(T2108 measures the percentage of stocks trading above their respective 40-day moving averages [DMAs]. To learn more about it, see my T2108 Resource Page. You can follow real-time T2108 commentary on twitter using the #T2108 hashtag. T2108-related trades and other trades are posted on twitter using the #120trade hashtag)
T2108 Status: 83% (overbought day #32)
VIX Status: 19.2
General (Short-term) Trading Call: Close more bullish positions. Begin but do NOT expand an existing bearish position.
Reference Charts (click for view of last 6 months from Stockcharts.com):
S&P 500 or SPY
SDS (ProShares UltraShort S&P500)
U.S. Dollar Index (volatility index)
VIX (volatility index)
VXX (iPath S&P 500 VIX Short-Term Futures ETN)
EWG (iShares MSCI Germany Index Fund)
Commentary
The formation of a top is typically a process not an event, but this process is finally starting to drive me nuts. One day, the stats are telling me to brace for higher prices. The next day, the technicals are growling like angry bears. In the last T2108 update, I had to focus strictly on the technicals just to avoid confusion with the amazingly bullish overbought statistics. I think the proper approach going forward is to paint a balanced picture. There is an incredible amount of money to be made both long and short while the market is going wild, and I do not want to distract you from the primary mission. So, with that, let’s take a look at today’s mixed signals.
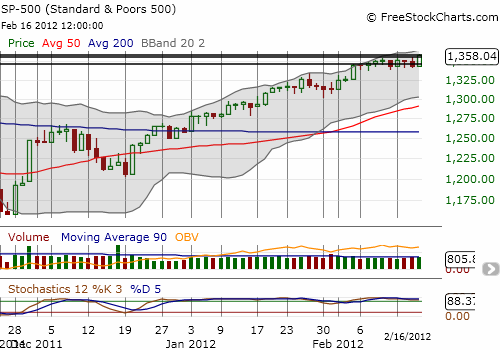
The primary story today is what looked bearish yesterday almost all completely flipped: the dollar was smashed against all but the Japanese yen (the yen continues to weaken as I have long anticipated) as the index failed a test at the 50DMA, the S&P 500 punched through resistance for new 4-year highs, and volatility was slammed back downward.

The chart above is a close-up of the S&P 500 that more closely shows the index cleaving through resistance from last year’s triple peaks. The bulls get credit for dogged stubbornness. The bears get a fail for a complete lack of conviction. It is starting to look like yesterday’s high volume selling could have actually been exhaustion and NOT the beginning of the end of the rally. Follow-through, either to the upside or the downside, will provide the major confirmation. I dare not conclude whether the market has topped or not without more evidence either way.
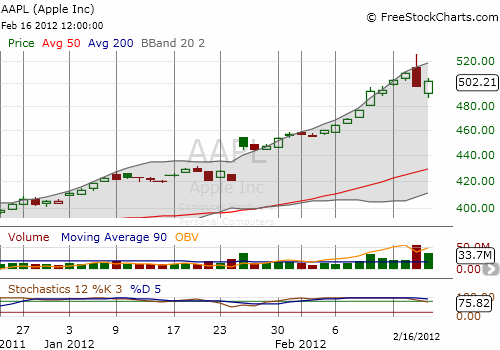
Through all the action today, T2108 only managed to get back to 83%, not even a high for this historic 32-day overbought period. This means that a few stocks are getting left behind as the market reaches for blue skies. One key stock that did not make new highs today was Apple (note well it is certainly well above its 40DMA).

I covered the technical case for a top in Apple yesterday, guessing it might be the most important chart review I have done. Apple’s gap down confirmed the top, BUT the high-volume buying off the lows is testament to the determination of the bulls. While it is not technically bullish, I still consider it a convincing effort by the bulls to put bears on notice. Technicians may reference piercing lines or counterattack lines, but these bullish reversals only apply in a downtrend.
Anyway, before I fully absorbed the technical outlook, I decided to bend down and try to pick up some dollars in front of a steamroller in the form of an April 590 call. Throughout much of Apple’s post-earnings straight-line rally, I had watched call options log tremendous gains. I was sitting in a call spread, often wishing I owned calls outright. After I closed out that position, I continued to watch the amazing ranges on these calls. Today, it occurred to me that options volume is helping to reinforce the uptrend in Apple as market makers move to hedge their short call positions. It is very likely that retail investors and traders are choosing options over stock given the much lower capital required to take on a meaningful position. Next, it occurred to me that I should buy a hedge that would allow me to hold the call through whatever volatility and downdrafts are sure to come. That hedge is in a March 470/475 put spread. I only own it to pay for the call, and I am definitely fine with Apple racing upward from here. And thus a new conflict with extremely overbought conditions is born.
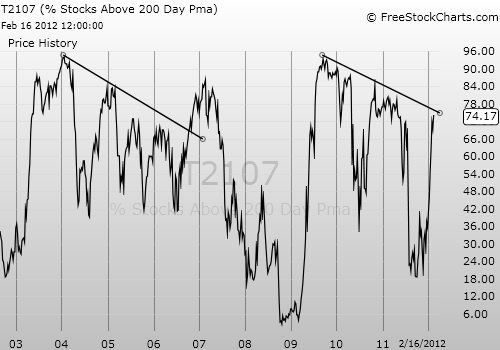
Finally, I think we are long overdue for a look at T2107, the percentage of stocks trading above their respective 200DMAs. On June 8th of last year, I wrote “T2107 Flashes A Major Bearish Warning.” I wrote the following:
“If history repeats itself, we will get a major snapback rally starting at some point this summer (according to my T2108 analysis, the bottom preceding such a rally could be imminent). Once T2107 crosses its downtrend line, we should get confirmation that a sustained rally is underway. After that, we will watch to see whether and when the stock market starts to diverge from T2107. That is, if T2107 restarts a sustained decline even as the stock market continues to rally, we should guess that the overall bull market is very likely coming to an end (or at least some major correction is imminent).”
This conclusion formed part of my strong convictions during the extended oversold periods in the summer, although prices had gone much lower than I ever anticipated. By October’s “one-day bear market,” I came to assume that this massive rally was off in some distant future. Now, here we are. Finally, a massive rally is at hand with multi-year highs.
T2107 remains in a downtrend, flashing its same old warning sign. But if history repeats itself, it will continue slowly churning upward, supporting the rally. It will break the current downtrend but stop short of making new highs before succumbing to the next corrective phase. I know now of course that timing this cycle is perilous, but I continue to watch for it. The big implication for the current rally is that T2107 tells us that there remains plenty of room for more upside. This is also what my historical analysis of overbought periods says. This overbought period is now the 10th longest since 1986. From here, the maximum return should be AT LEAST 7% before this overbought period ends. The current return is 6.3%.

Charts below are the latest snapshots of T2108 (and the S&P 500)
Refresh browser if the charts are the same as the last T2108 update.
Black line: T2108 (measured on the right); Green line: S&P 500 (for comparative purposes)
Weekly T2108

*All charts created using freestockcharts.com unless otherwise stated
Related links:
The T2108 Resource Page
Expanded daily chart of T2108 versus the S&P 500
Expanded weekly chart of T2108
Be careful out there!
Full disclosure: long SDS and VXX; long VXX puts and SDS calls, long AAPL calls and put spread

