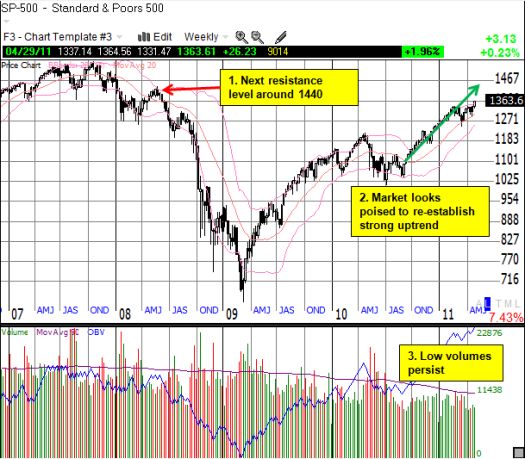
With the S&P 500 hitting fresh 3-year highs this week, the index is poised to recapture the previous uptrend that was interrupted by March’s double calamities of the Japan earthquake and hostilities in Libya.

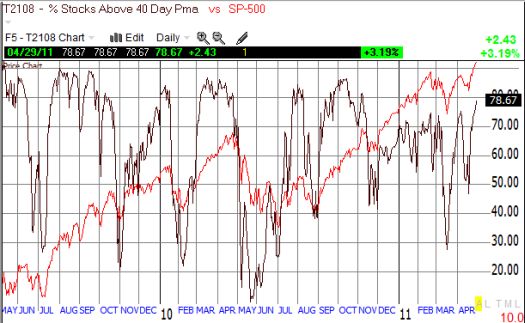
The stock market is overbought with T2108, the percentage of stocks trading above their respective 40-day moving averages (DMAs), at a five-month high at 79%. Given current momentum, I expect the stock market to cling stubbornly to overbought levels. Such behavior has been common since the bounce from March, 2009 lows. I even expect T2108 to make a rare appearance at 90% before this latest push experiences a significant setback.

When the stock market was at a 3-month overbought high in February, I marveled at the market’s pace of gains:
“…2011 has had 34 trading days. Of those 34 days, only 11 have been down days. More importantly, only TWO of those 11 down days closed near the lows of the day. Those days were the two largest down days of the year: Jan 19 closed down 1.0% and Jan 28 closed down 1.8%. One up day, Jan 21, closed near the lows of the day. So, for 31 of 34 trading days this year, buyers have stepped in when the market has either gapped down or traded down from the open.”
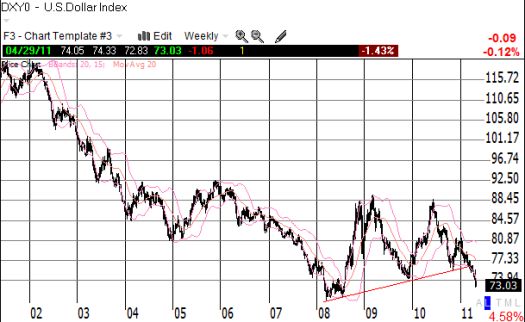
This is the kind of momentum the market may re-establish on its way to the next presumed resistance level at 1440 given Federal Reserve Chairman Ben Bernanke waved the green flag again at this week’s first ever press conference on monetary policy. While Bernanke jawboned about the Fed’s willingness and ability to act swiftly against unwanted increases in inflation expectations, easy money remains the main course for the economy. Bernanke continued to insist that U.S. monetary policy has nothing to do with the dollar’s decline and high commodity prices (for example, is it just a coincidence that oil broke out from a year-long slumber when Bernanke telegraphed QE2?). Growing inflation pressures are transitory, presumably because employment remains poor and housing continues to stagnate.
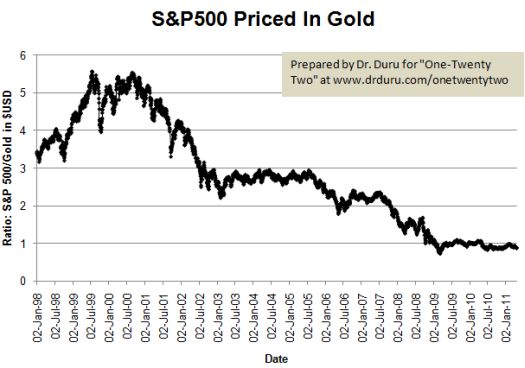
Under these circumstances, I like to keep in mind the “real” impact of the money-printing on the stock market by reviewing the S&P 500 priced in gold; the index continues to struggle in these terms. Bernanke chooses to confirm the success of printing money by applauding the stock market’s rise but does not (cannot) acknowledge that soaring gold (and silver) prices have nullified most of the real gains. Gold remains Bernanke’s conundrum.

Source for charts: gold prices from the World Gold Council, S&P 500 prices (adjusted for dividends) from Yahoo! Finance. (Prices through April 21, 2011)
At .89, the S&P 500’s price relative to gold is back to 2010 lows. While the index has doubled off the March lows in dollar terms, the S&P 500 has only increased 22% when priced in gold. I fully expect the S&P 500 to retest its gold-priced lows once gold finally takes on the near-parabolic momentum that silver has achieved. To me, these numbers point the way to our next calamity but, until then, we follow the scent of freshly printed paper currencies…

*Index charts created using TeleChart:

Be careful out there!
Full disclosure: long SSO puts, long GLD, PAAS
