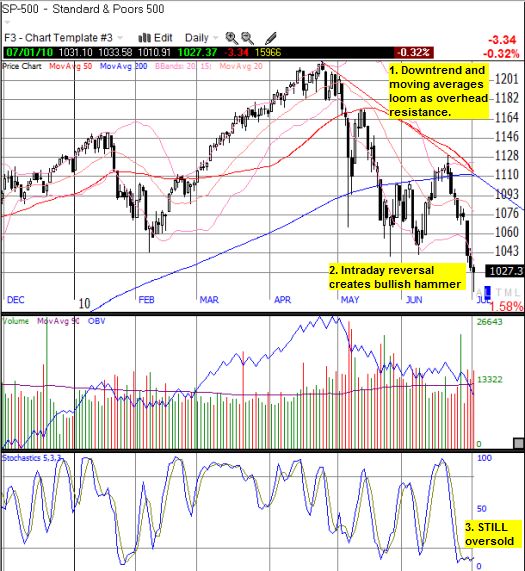
If the summer ends up trading in a range, it will have a wider berth than I had expected. This week the S&P 500 broke both closing and intra-day lows for 2010 and confirmed an unfolding downtrend. The index is down 8 of the last 9 days.

The good news is that the S&P 500 did not break the psychologically important 1000 level. The index even formed a bullish hammer pattern. Combined with oversold conditions, the index is primed for a strong and sharp relief rally (stochastics are oversold, but the percentage of stocks trading above their 40-day moving average (DMA), T2108, is 25%, still above the 20% oversold threshold).
The jobs report could ignite this rally no matter the results: a negative surprise could trigger a “final” wash-out of sellers, and a positive surprise could force shorts to cover and motivate bargain hunters. Thursday’s lows must hold for the bullish signal to remain intact.
Sneaking a peak beyond the next oversold bounce, technical conditions continue to point toward lower prices. In early June, I warned that the high density of oversold periods suggested the market was slowly but surely weakening. We are now also contending with an increasingly ominous T2107, the percentage of stocks trading above their respective 200DMAs. T2107 is trending downward persistently as the S&P 500. Such clear, directional behavior seemed to signal the eventual end of the last bull market. Although the signal unfolded over a much longer timeframe while the stock market managed to push higher, the market has experienced enough technical to convince me that T2107 is acting as a confirming signal.

Moreover, “the China indicator” looks more and more tenuous with every fresh 52-week low in the Shanghai index. As long as this slide continues, continued talk about China saving the world’s economy seems as misplaced as it was in 2008. (CEOs like Jeffrey Immelt from GE are becoming more public about describing the stark realities of trying to do business in China as a foreign company – as a result, the persistent assumption that China will save the global economy may soon undergo significant upheaval and/or revision).
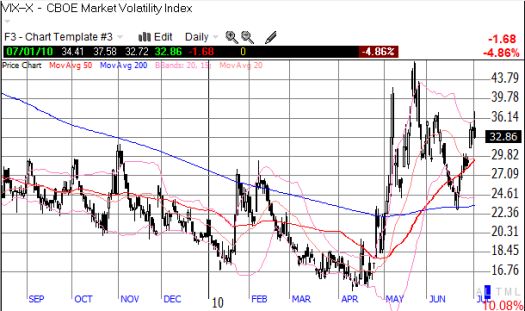
Finally, volatility remains elevated. As expected, the volatility index, the VIX, is supported by its upward sloping moving averages. The bounce off the 200DMA was picture-perfect.

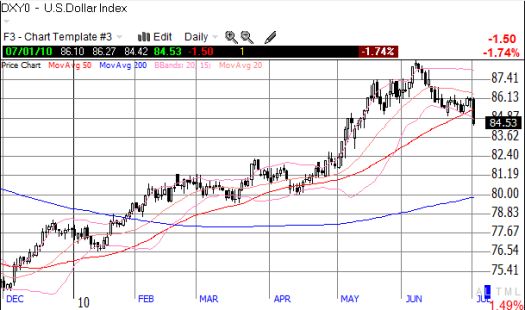
Perhaps the biggest mystery is the U.S. dollar. A constant stream of bad economic news has weakened interest in this supposed safe haven. I had expected the dollar to bounce further from its 50DMA support. Instead, Thursday’s tremendous surge in the euro led the way in sending the U.S. dollar into a “toppy” looking pattern directly underneath 4-year highs. The interpretation of further bad news will depend on its significance relative to all the other bad news building about the global recovery. Currency traders seem to be saying that the relative advantage of the U.S. is slipping. Of course, this could change very quickly.

*All charts created using TeleChart:

For now, I am positioning for a bounce in the S&P 500. I would have preferred to do so with T2108 below 20%, but the hammer and oversold stochastics increase the chance of a bounce. Moreover, there is enough negative sentiment and valuations are cheap enough to encourage contrarians and buyers back into the mix on any signs of hope. Regardless, I expect any bounce to be about as sharp as the previous two…but also just as short-lived.
Be careful out there!
Full disclosure: long SSO, short EUR/USD, long GE, long UUP
