By now, I think we should recognize that low-volume rallies simply do not last – the odds tend to favor a return of most, if not all, those kinds of gains, sooner than later. Last week, I was particularly puzzled by a low-volume 2.4% rally on the S&P 500 that came on the heels of poor retail sales numbers which in turn followed poor employment numbers the week before that:
“With technicals essentially over-bought, the stock market is vulnerable to a one-day reversal just as large as today’s gains. I fully expect such a sell-off within a week, especially given this week is an options expiration week (“quadruple witching” too). Those of us still patient enough to play a bounce from previous oversold conditions were compelled to lighten up on longs into today’s bounce.”
I was starting to think I would have to write a piece trying to explain how the market stayed aloft despite the odds. China’s announced removal of the peg between the yuan and the U.S. dollar initially seemed to seal the coffin on my prediction. Instead, it turned into a classic blow-off surge of buying directly underneath important resistance at the rapidly declining 50-day moving average. With the plunge back below the 200DMA, the S&P 500 has essentially reversed last week’s “strange” rally. Since volume on the selling was low, I am not expecting a retest of the Feb/June lows from this move. It seems we are setting up for a directionless summer market where the index just bounces between tight technical resistance and support, searching for a catalyst to do otherwise. This would add roughly another 3 months to the S&P 500’s now 9-months of nowhere and counting.

While I expect directionless action for the summer, I remain very wary of the increasingly negative signs in the technicals. Only distinctly oversold periods (as defined by the percentage of stocks trading above their respective 40-day moving averages or “T2108“) have motivated my interest in fresh longs. The bounce off the last oversold period generated many interesting charts. I have posted a few that particularly caught my eye with some additional commentary below each chart.

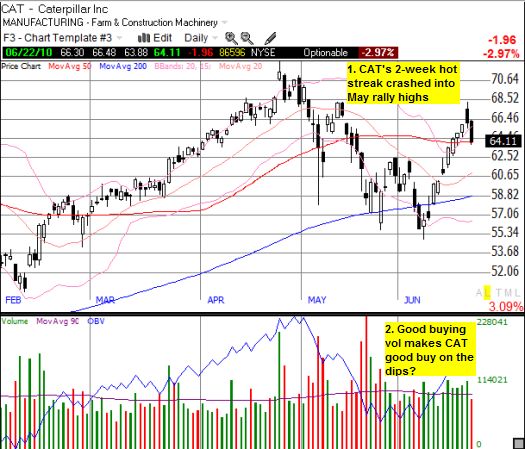
Caterpillar, Inc. (CAT) was looking very strong going into Monday morning. The test of resistance from the May rally highs made a great low-risk entry for a short off over-bought conditions (stochastics not show in the above chart). It touched the 50DMA support on Tuesday’s close. Given the preceding rally, I am guessing buyers will put up a good fight at this support level. A break of this level and CAT could fall relatively quickly to retest the 200DMA support as new buyers scramble to protect profits. CAT should benefit from a China with a stronger currency, since the country can afford more imports. However, today’s poor existing housing sales numbers loom as a large negative.

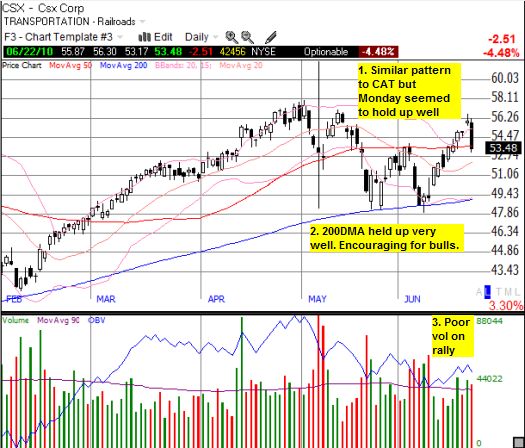
A stronger yuan gives China more buying power for coal it craves. CSX has done well hauling coal across the country for eventual shipment to China. The chart suggests investors and traders expect the ride to continue. While volume was poor on the last rally, the 200DMA held up very well during the bottom of the last oversold periods. CSX should make a great buy during the next oversold period.

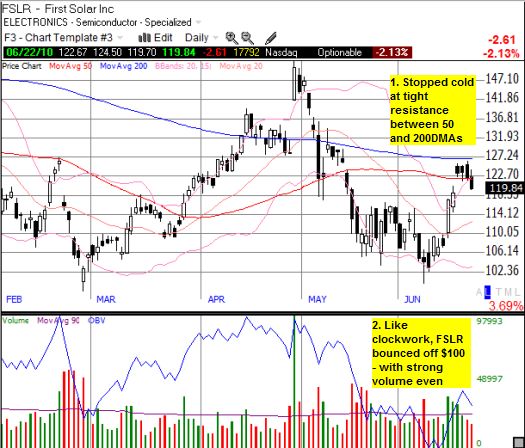
Two weeks ago I wrote about how First Solar’s $100 support line is coming under increasing pressure, but argued for staying the course on playing the latest bounce from support. Staying net bullish paid off, but I was compelled to unload the longs into last week’s surge into over-bought levels right at resistance. I am now short via puts, but I am looking to buy the coming dip. I do not think there are any positive catalysts over the immediate horizon to push the stock over resistance. However, unless the euro plunges toward parity soon, I also do not see much of a negative catalyst to puncture the $100 support line. This sets up a sustained trading range between $100-130. Bulls and bears can have fun with that one.
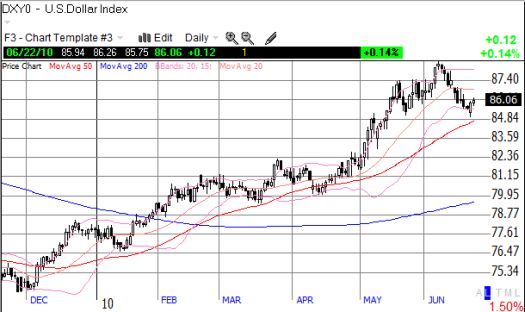
Finally, the dollar has spent much of June selling off in drips and bits mainly thanks to the euro’s best two weeks in a very, very long time. The dollar index (DXY0) is now bouncing off oversold conditions and the 50DMA support. Wednesday’s Federal Reserve announcement looms as a big question mark, but I am expecting the dollar to retest the June highs in short order. Such a move will provide a negative counter-balancing the positive implications for increased buying of commodities by the Chinese on the back of an appreciating yuan. (Note that I am maintaining my reversal of my longstanding bearishness on the British pound.)

*All charts created using TeleChart:

Be careful out there!
Full disclosure: long SSO puts, long FSLR puts, short EUR/USD, long GBP/USD (and other currency pairs), short GBP/AUD, long UUP
