
Stock Market Analysis Summary
|
Stock Market Commentary
I often ignore the potential implications of a changing calendar on the stock market. This year feels different. With my favorite sector, artificial intelligence (AI), looking tired, I feel compelled to get ready for the 2026 stock market. Permabull Tom Lee from Fundstrat launched me into preparation mode with an uncharacteristically sober outlook for the start of 2026.
Tom Lee projected in a CNBC interview that trading in 2026 will get rough during the first half of the year. Lee expects the market to drop 10 to 15% during the first six months of the year, a bearish turn which would represent a conventional, even normal, correction. The apparent implication is that the Federal Reserve will stand by as the economy weakens and sticky inflation ties its contentious hands. Once a new accommodative chair arrives in May, someone who answers to the President, a “Fed put” will come to the rescue. A full recovery will ensue as the Fed responds with accommodative policy further bolstered by accommodative fiscal and regulatory policies from the Federal government.
Interestingly, Lee expects gridlock in Washington after the 2026 midterm elections undermine one-party control in the House. He claimed that “half the equity investors” he talks to “will breathe a sigh of relief if there’s gridlock”. An old Wall Street adage states that Wall Street prefers a government that does nothing. This year proved that adage wrong as an extremely active government has accompanied a 15.6% year-to-date gain for the S&P 500.
After the April tariff drama, trauma, and noise, the stock market quickly reverted to buying any and all dips, caring about little else.
I took note of this interview because Lee’s narrative is about as bearish as he can get. Lee remains overall bullish, of course, but he rarely conjures up negative outlooks. Still, his narrative is pretty intricate as it requires a flip-flop between an unhelpful to a helpful Federal Reserve and a change from a highly interventionist Federal government steeped in statist capitalism to a constrained Federal government. As far as forecasts go, Lee’s is as good as any, and at least it sounds compelling…and aligns well with the theme of a tired AI trade weighing on market breadth.
The Stock Market Indices
S&P 500 (SPY)
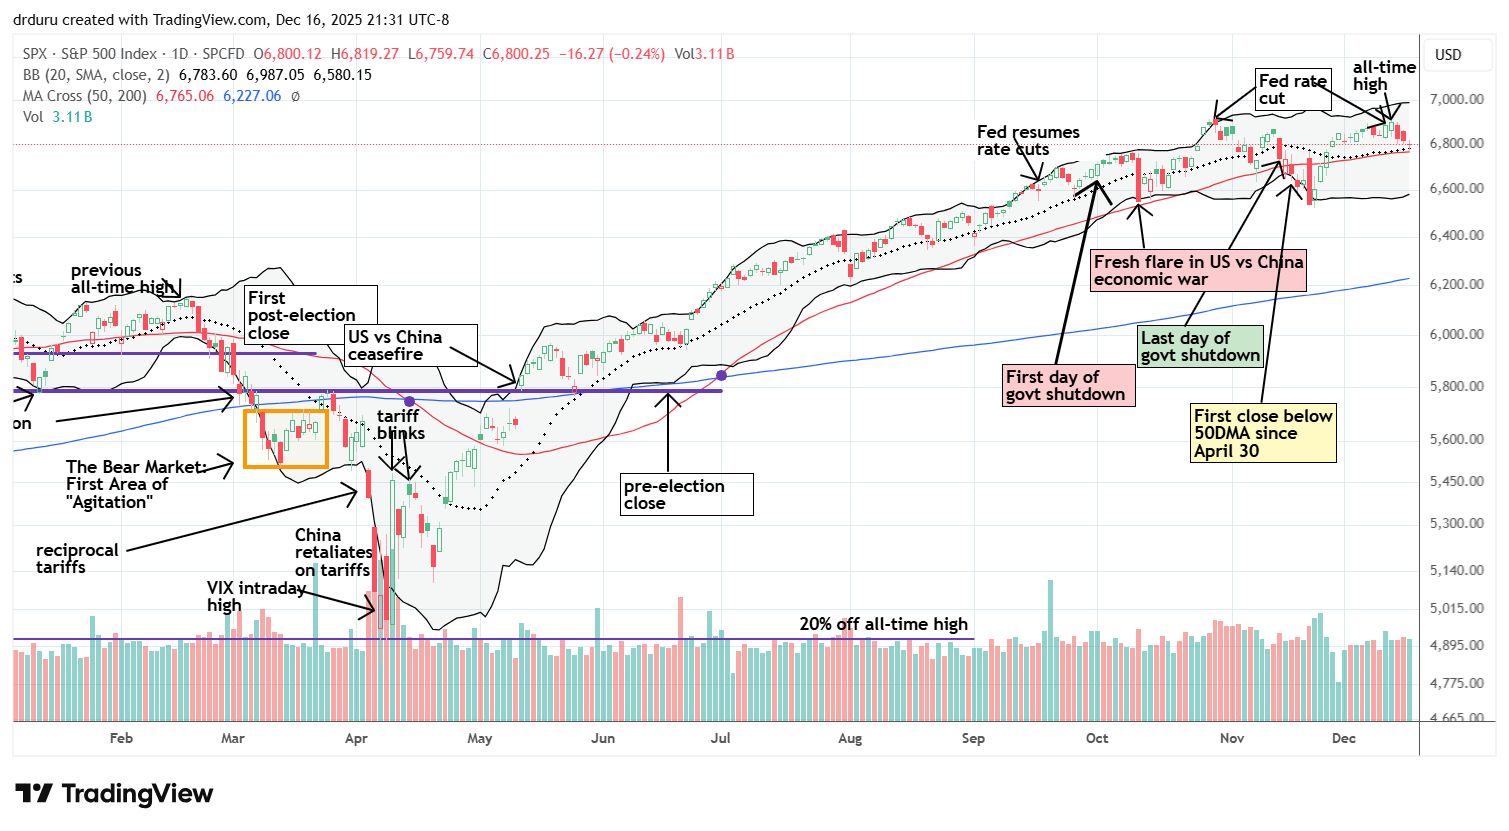
The S&P 500 (SPY) is on a 3-day losing streak with the last 2 days delivering minimal losses. In picture-perfect fashion the index tested, really kissed, its important support at a now converged 20-day moving average (DMA) (the dotted line) and the 50-day moving average (DMA) (the red line). This support needs to hold to sustain hopes for a year-end rally that breaks the double-top formed between the Federal Reserve’s last two rate cuts (see the chart below). The S&P 500 is down 0.7% after barely surviving November with a minimal gain.
NASDAQ (COMPQX)
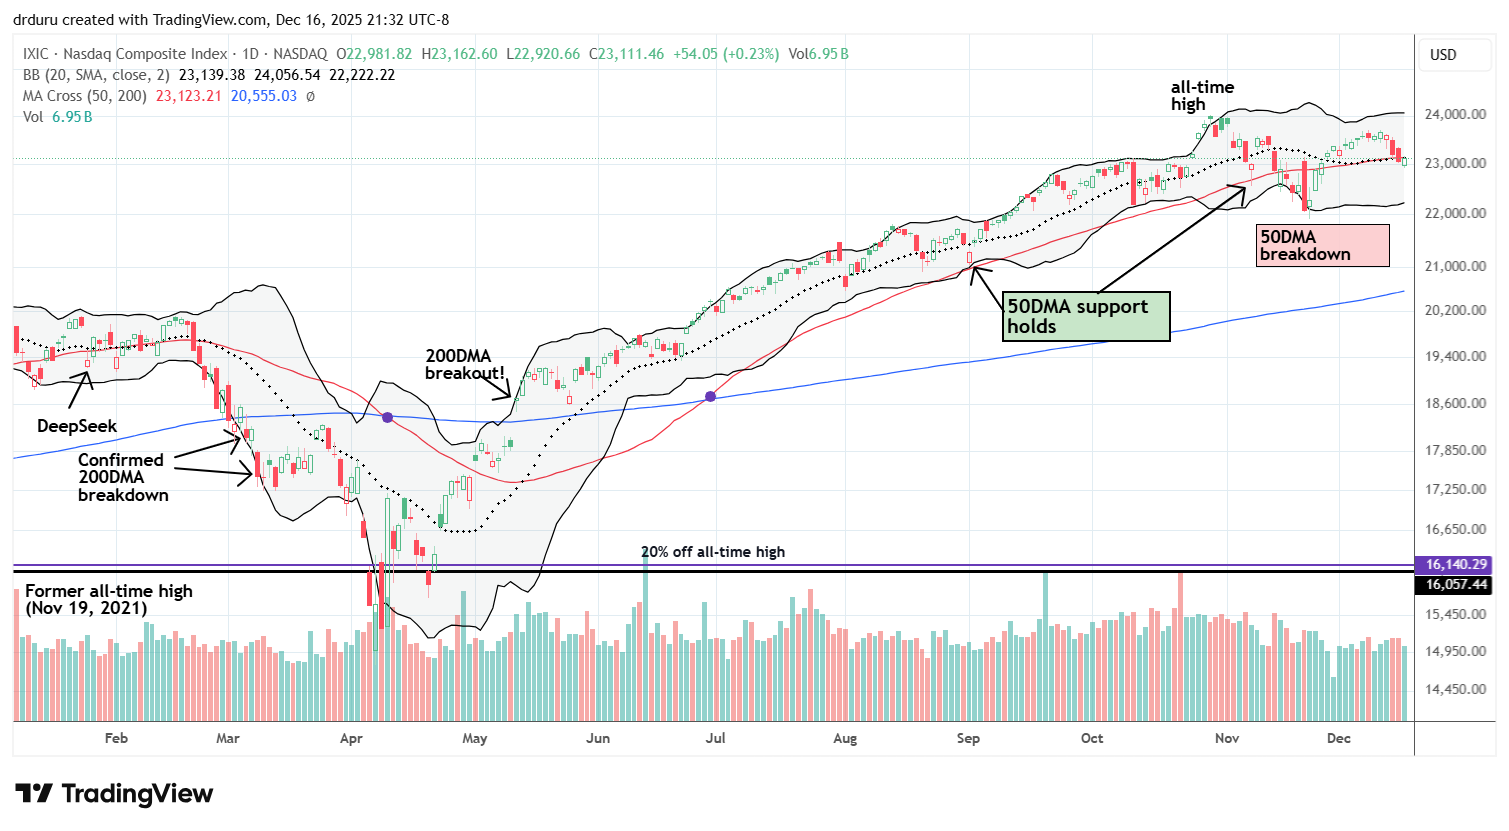
The NASDAQ did not survive its test. The tech-laden index started the week with a marginal breakdown below its converged 20DMA and 50DMA support. The NASDAQ marginally woke up today with a 0.2% gain and a close right at support turned resistance.
iShares Russell 2000 ETF (IWM)
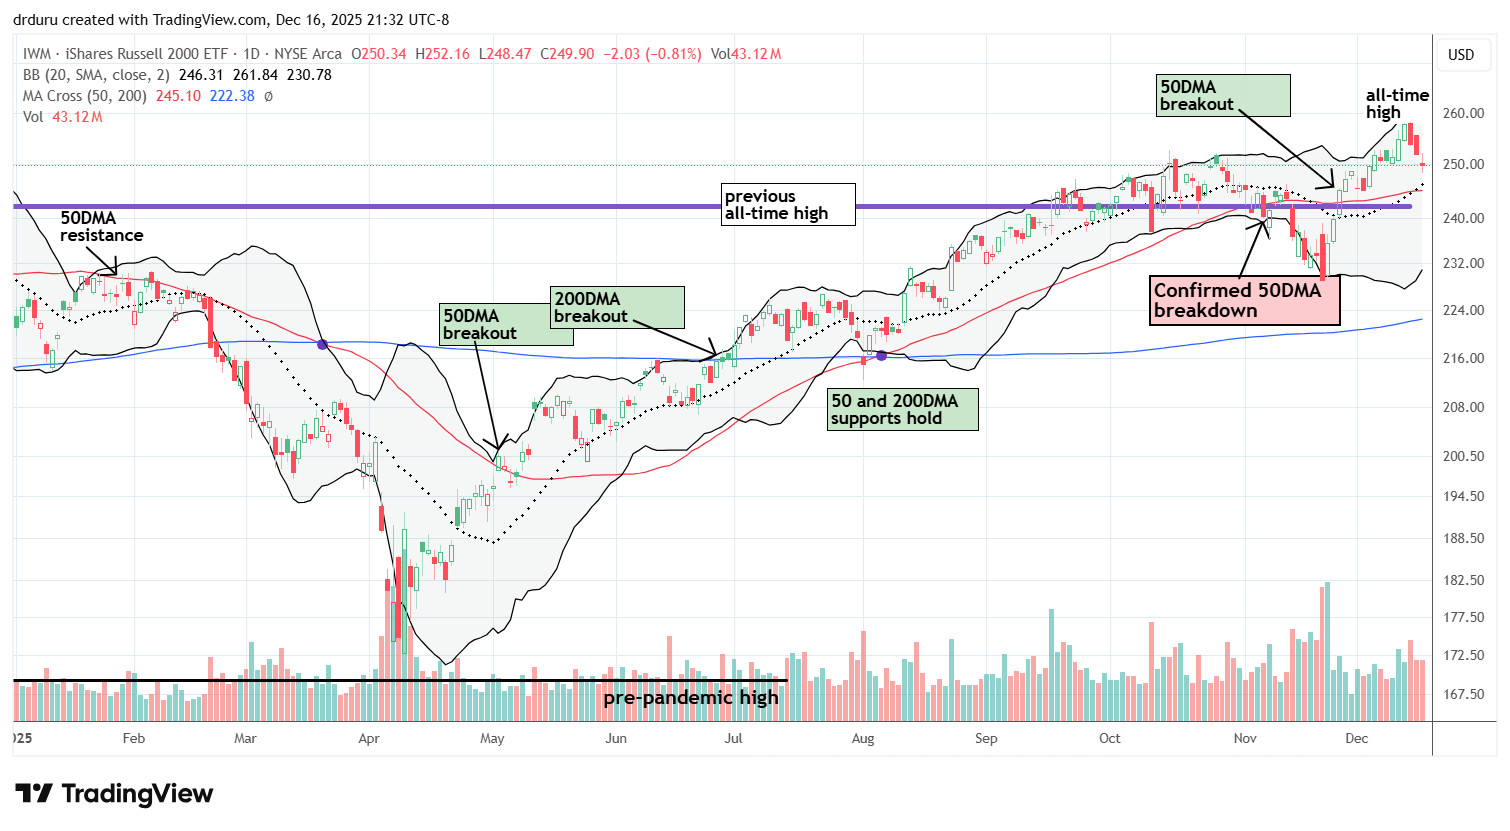
The iShares Russell 2000 ETF (IWM) remains well above support. However, IWM’s relative outperformance may just mean there is more selling to go before a late year-end rally really commences. I am on alert to start my Christmas stock shopping with IWM calls on a test of, you guessed it, converged 20DMA and 50DMA support.
The Short-Term Trading Call While Getting Ready for the 2026
- AT50 (MMFI) = 55.6% of stocks are trading above their respective 50-day moving averages
- AT200 (MMTH) = 60.0% of stocks are trading above their respective 200-day moving averages
- Short-term Trading Call: neutral
AT50 (MMFI), a market breadth indicator that represents the percentage of stocks trading above their respective 50DMAs, closed at 55.6%. The chart at the bottom of the post shows my favorite technical indicator quickly lost last week’s promising end to a primary downtrend. The last three days of selling plunged AT50 right back into its primary downtrend.
AT200 (MMTH), a longer-term market breadth indicator that represents the percentage of stocks trading above their respective 200DMAs, continues to look much better than AT50. AT200 closed the day on top of its former downtrend, so a bounce here could signal the beginning of some kind of rally. A breakdown back into the downtrend could all but end my expectations for a year-end rally.
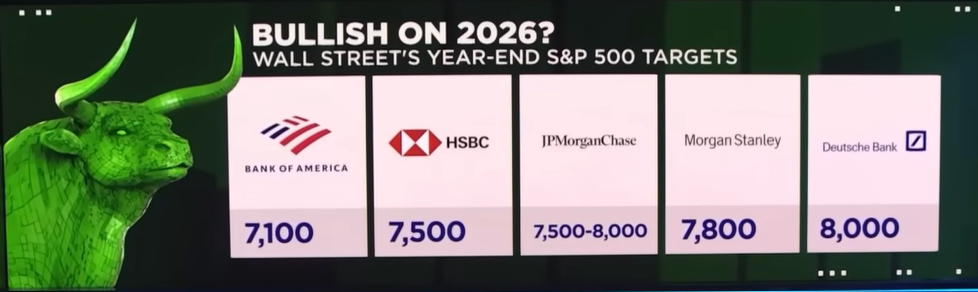
Ultimately, if Tom Lee’s projections play out, then AT50 should drop to oversold levels and present the next great buying opportunity in the stock market. Such a sell-off would make even Bank of America’s muted expectations for 2026 look attractive.
The Equities: Ready for the 2026
The ROBO Global Artificial Intelligence ETF (THNQ)
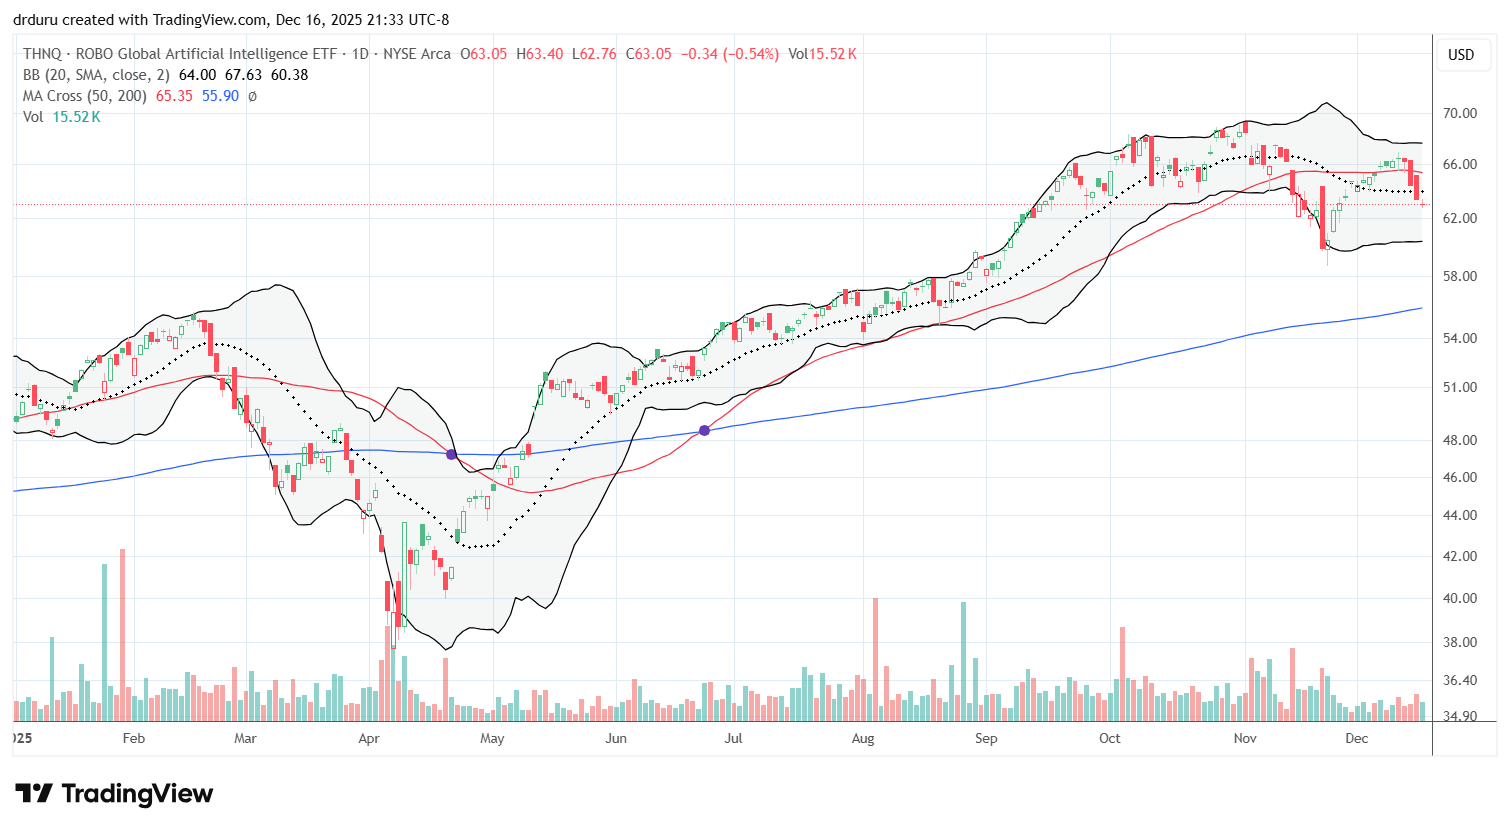
Description: The ROBO Global Artificial Intelligence ETF (THNQ) is an exchange-traded fund that provides diversified exposure to global companies developing and applying artificial intelligence, machine learning, and related enabling technologies across multiple industries.
Technical status: The ROBO Global Artificial Intelligence ETF (THNQ) fell short of challenging its all-time high and looks too exhausted to escape churning around its 20DMA and 50DMA.
Trade commentary: THNQ is one of my big winners of the year mainly thanks to my willingness to load up on shares during the spring sell-off. My trades were emboldened by my fundamental interest in making stocks related to artificial intelligence a core part of my portfolio. However, with the fatigue in the AI trade I am bracing for a more extended pullback or at least a trading range.
Increasing complaints and outright resistance around the country to data center build-outs (see the video below) threatens to slow down the AI-industry from breakneck speeds to near stall speed.
Costco Wholesale Corporation (COST)
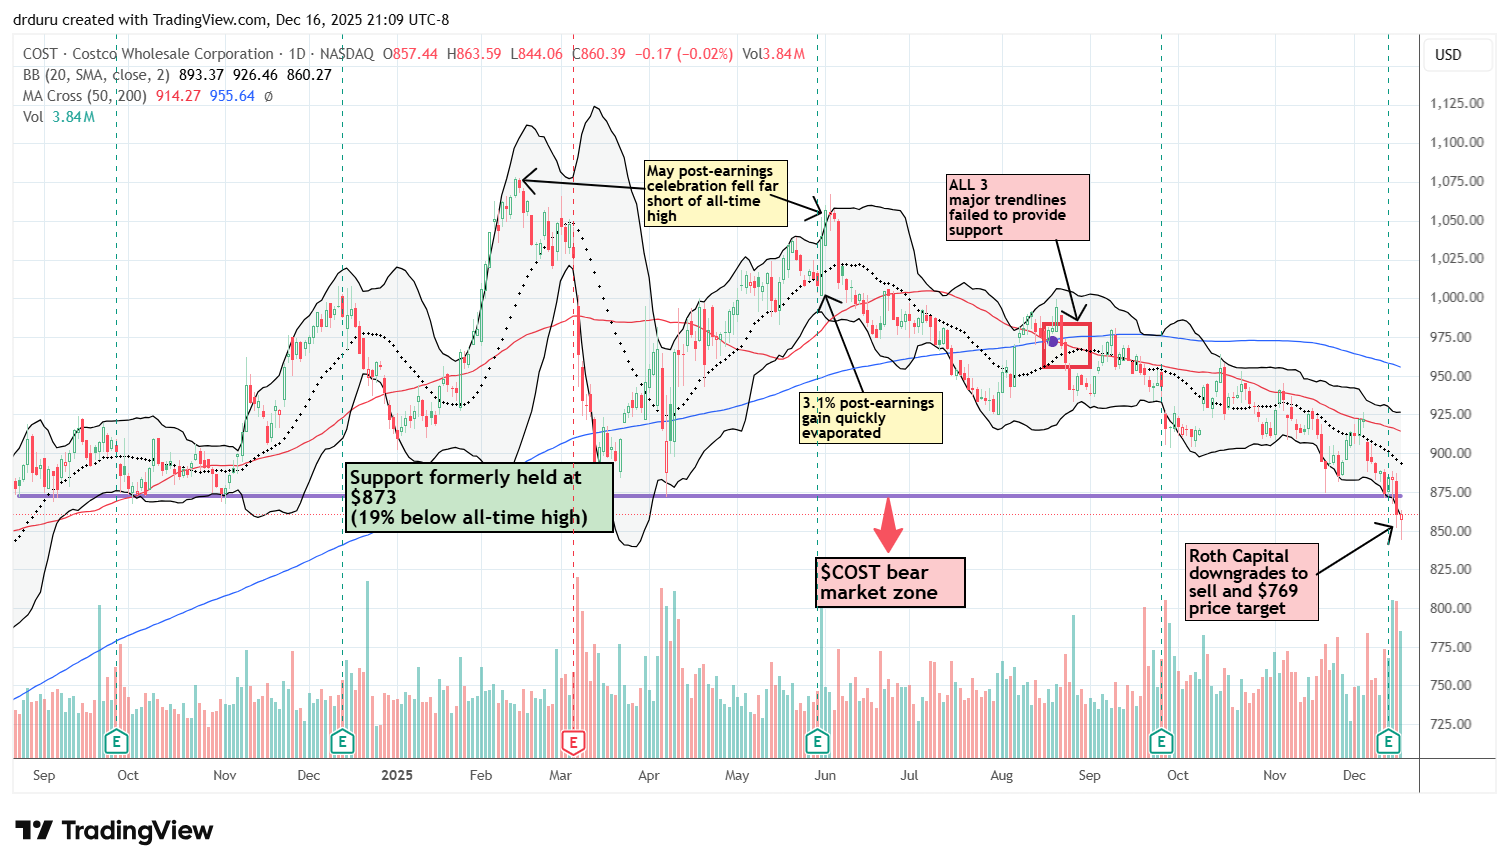
Description: Costco Wholesale Corporation is a membership-based warehouse retailer that leverages scale, limited SKUs, and razor-thin margins to deliver consistent value to consumers while generating steady cash flow and strong customer loyalty.
Technical status: Costco Wholesale Corporation (COST) fell into a bear market and is now trying to hold a 16-month low as support.
Trade commentary: COST has long been a staple stock for investors in consumer-facing stocks. However, COST started the week with a major breakdown into bear market territory. The stock is now struggling around 16-month lows with a sharp bounce today from intraday lows. I fully expect a rebound from here to run into resistance at the $783 level and then a resumption in the overall downtrend.
Renaissance IPO ETF (IPO)
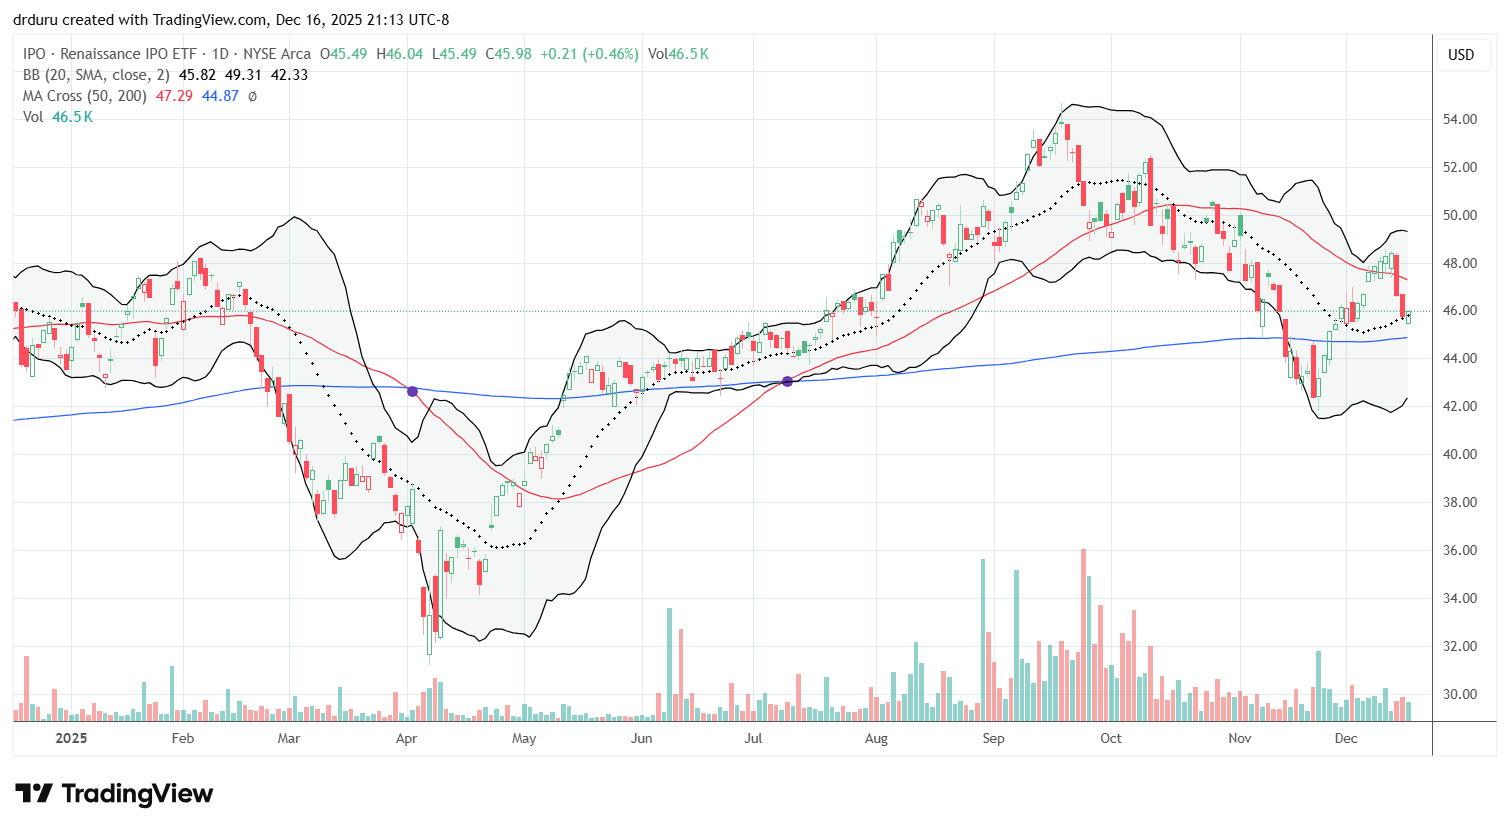
Description: The Renaissance IPO ETF (IPO) is an exchange-traded fund designed to track the performance of newly public U.S. companies by holding a diversified portfolio of recent initial public offerings and newly listed stocks.
Technical status: Renaissance IPO ETF (IPO) peaked in September at a near 3 1/2 year high and looks tired after two major failures at 50DMA resistance and a trip below 200DMA support.
Trade commentary: IPO is my favorite ETF for speculating on innovation. Yet, here too, I see market fatigue. IPO last peaked in September has not been the same since. The subsequent selling did not end until after a bearish 200DMA breakdown. The recovery from that breakdown is still in place but is under a fresh threat from new selling. IPO is definitely flashing caution signs for early 2026.
Tesla, Inc (TSLA)
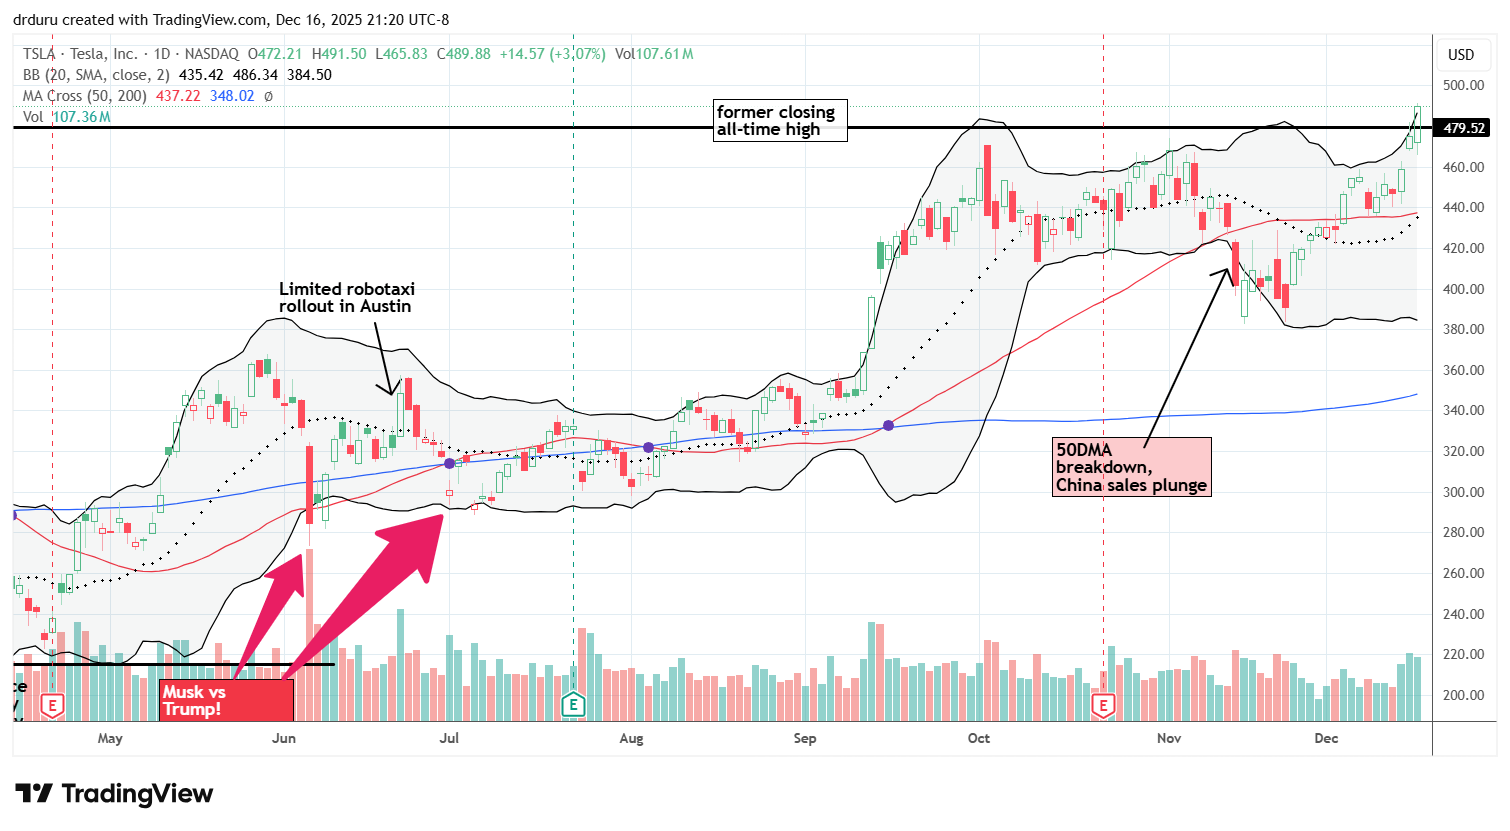
Description: Tesla, Inc. is an electric vehicle and energy technology company that integrates automotive manufacturing, battery systems, and software to scale clean transportation and energy solutions globally.
Technical status: Tesla, Inc (TSLA) jumped 3.1% and broke out to a new all-time high.
Trade commentary: TSLA is a stark counterpoint to market fatigue. The stock’s breakout is diverging from the NASDAQ’s weakness and the tired AI trade. TSLA looks ready for the 2026 stock market with confetti and celebratory music to wake up a reluctant stock market. The stock even becomes a buy on another all-time high; such a move would confirm the breakout. Of course, a close below the all-time high would put TSLA at risk to join the stock market in its fatigue.
")
")
Be careful out there!
Footnotes
Subscribe for free to get email notifications of future posts!
“Above the 50” (AT50) uses the percentage of stocks trading above their respective 50-day moving averages (DMAs) to measure breadth in the stock market. Breadth defines the distribution of participation in a rally or sell-off. As a result, AT50 identifies extremes in market sentiment that are likely to reverse. Above the 50 is my alternative name for “MMFI” which is a symbol TradingView.com and other chart vendors use for this breadth indicator. Learn more about AT50 on my Market Breadth Resource Page. AT200, or MMTH, measures the percentage of stocks trading above their respective 200DMAs.
Active AT50 (MMFI) periods: Day #128 over 20%, Day #17 over 30%, Day #15 over 40%, Day #10 over 50% (overperiod), Day #3 under 60% (underperiod), Day #101 under 70%
Source for charts unless otherwise noted: TradingView.com
Full disclosure: long IWM shares, long QQQ call and call spread, long SPY put spreads, long THNQ, long IPO
FOLLOW Dr. Duru’s commentary on financial markets via StockTwits, BlueSky, and even Instagram!
*Charting notes: Stock prices are not adjusted for dividends. Candlestick charts use hollow bodies: open candles indicate a close higher than the open, filled candles indicate an open higher than the close.
* Blog notes: this blog was written based on the heavily edited transcript of the following video that includes a live review of the stock charts featured in this post. I used ChatGPT to process the transcript.