

Housing Market Intro and Summary
This edition of “What Happened in the Housing Market” is truncated again because the shutdown of the Federal government. Yet, the shutdown did not prevent the stocks of home builders from outperforming the rest of the stock market for the month. Optimism over lower interest rates, improved affordability metrics, and a strong October of new home sales led the way for housing market news. The initial momentum leading to a better a spring selling season in 2026 seems underway.
Here is a summary for November’s market data:
- The stocks of home builders suffered a bear market encore but emerged outperforming the S&P 500 for the month of November.
- A measure of builders’ future sales expectations pulled back but did not prevent overall builder sentiment from improving.
- Existing home sales continued to recover from the summer’s trough.
- California’s market for existing homes experienced gains and contrasted with the West’s regional declines..
- Record delistings slowed the market with lower levels of inventory.
- Mortgage rates stopped falling after five months of improving affordability.
Housing Stocks
Going into November, the iShares US Home Construction ETF (ITB) had just lost its battle to avoid returning to a bear market. ITB spent the rest of the month mired in a bear market encore, dropping as low as levels last seen in June. However, once optimism returned for a Federal Reserve rate cut in December, ITB responded with a 5.0% rally and buyers have not looked back. ITB even exited, just barely, its bear market. The 3.5% gain for the month means that ITB has also managed to start the seasonally strong period of trading in the stocks of home builders in good shape. The S&P 500 barely avoided a loss for the month and instead gained 0.1%.
")
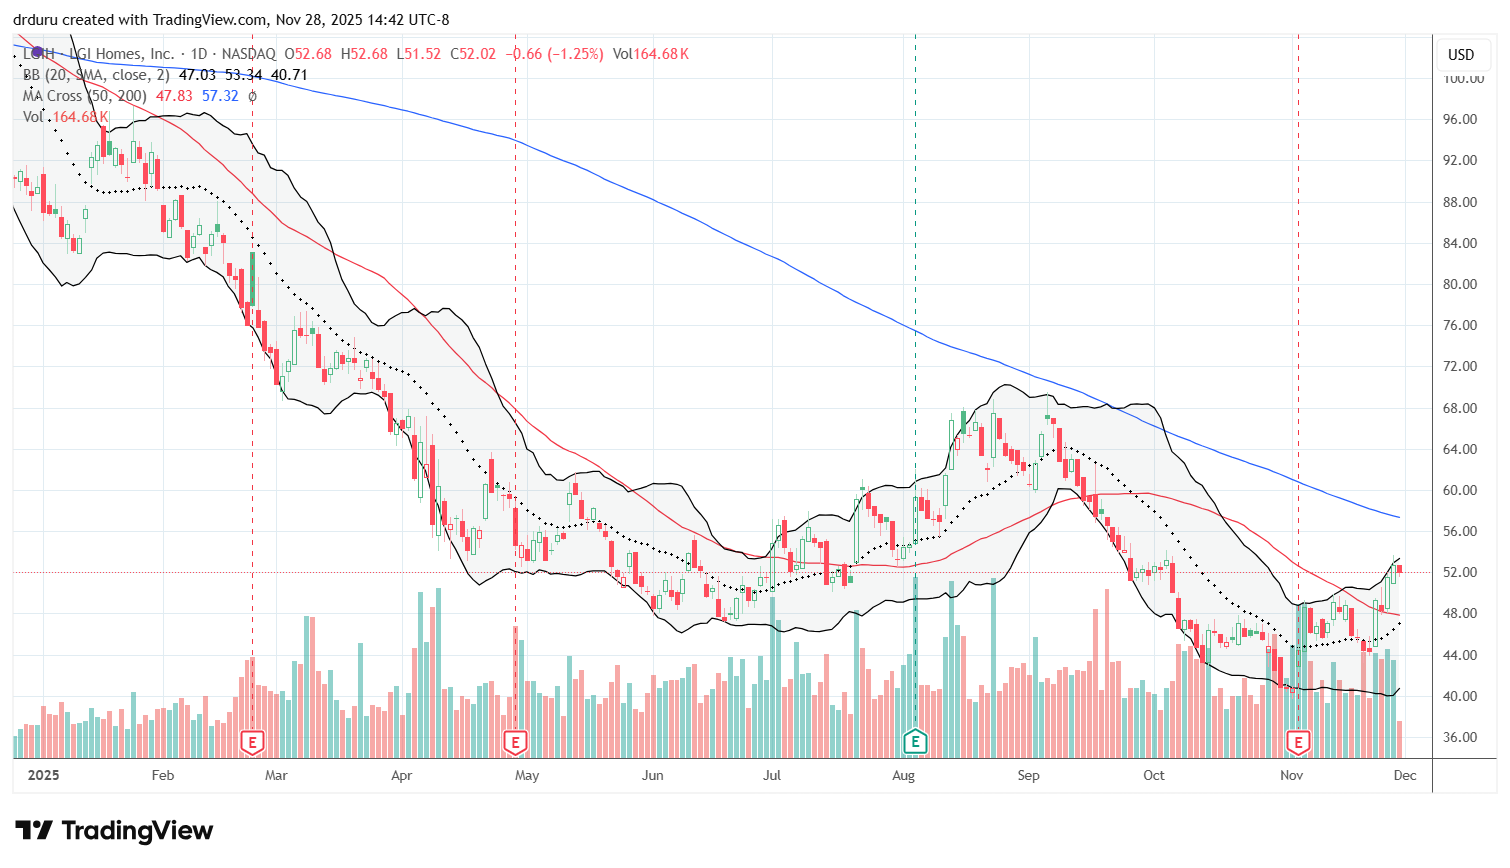
LGI Homes (LGIH) was one of the hottest home builder stocks years ago. Now, LGIH is one of the worst performers. After reviewing the company’s latest earnings report, I decided to officially exclude LGI Homes from my shopping list for the seasonal trade on home builders. Still, LGIH’s 27.5% gain for November signals the stock may finally bottom and join the rest of the stocks of home builders in outperforming the general stock market in the coming months.
Housing Data
Home Builder Confidence: The Housing Market Index – November, 2025
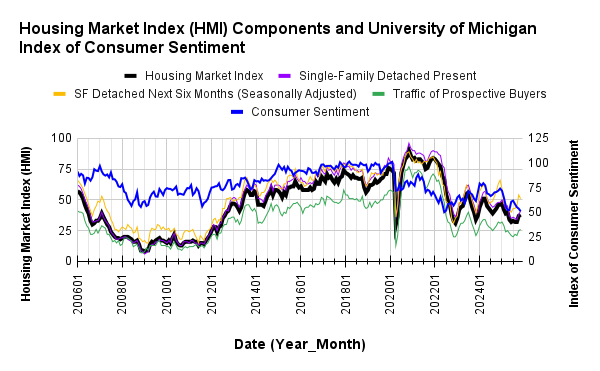
The National Association of Home Builders (NAHB)/Wells Fargo Housing Market Index (HMI) increased 1 point to 38 in November. While the NAHB chose to focus on sentiment remaining in negative territory (below 50), I am impressed that, despite the government shutdown and on-going weakness in the labor market, the HMI increased at all. Perhaps the component for “Single-Family: Next Six Months” was the blemish that concerned the NAHB with a decline from 54 to 51, but at least this indicator for future sales remains in positive territory.
/Wells Fargo Housing Market Index (HMI) and the University of Michigan Index of Consumer Sentiment")
Source for data: NAHB and the University of Michigan
While builder confidence stabilizes and trickles higher, consumer confidence declined to a 3 1/2 year high. This divergence is unsustainable over time, and I am still hoping builders see something consumers do not yet see. Related to declining consumer confidence, the NAHB worries about “demand-side weakness” from “a softening labor market and stretched consumer finances contributing to a difficult sales environment”.
In an ongoing theme, what the NAHB describes as “a further sign of ongoing challenges for the housing market”, overall pricing power declined slightly yet again for builders. The share of builders cutting prices hit a post-COVID record of 41%. A 37% to 39% range had been in place since June. The average price discount stayed flat with October at 6%. The share of builders providing incentives stayed flat with September and October at 65%.
The two smallest regions, the Northwest and the Midwest, declined while the South and West each increased by two percentage points. The Northwest rejoined the other regions in negative territory by plunging from 55 to 45. The Midwest dropped from 42 to 40, staying in its tight range this year between 38 and 44. The South continued its new momentum by increasing closer to its April level with a 37. The West also moved closer to its April level with a 33.
New Residential Construction (Single-Family Housing Starts) – October, 2025
{October data not available due to the previous shutdown of the U.S. Federal government}
![US. Bureau of the Census, Privately Owned Housing Starts: 1-Unit Structures [HOUST1F], first retrieved from FRED, Federal Reserve Bank of St. Louis, September 18, 2025](https://drduru.com/onetwentytwo/wp-content/uploads/2025/09/20250918_Housing-starts-August-2025.png "Housing starts")
New Residential Sales (Single-Family) – October, 2025
{October data not available due to the previous shutdown of the U.S. Federal government. The data below are a close proxy from the Mortgage Banker’s Association.}
“MBA estimates new single-family home sales, which has consistently been a leading indicator of the U.S. Census Bureau’s New Residential Sales report, is that new single-family home sales were running at a seasonally adjusted annual rate of 771,000 units in October 2025. The new home sales estimate is derived using mortgage application information from the BAS, as well as assumptions regarding market coverage and other factors. The seasonally adjusted estimate for October is an increase of 13.4 percent from the September pace of 680,000 units”.
![US. Bureau of the Census, New One Family Houses Sold: United States [HSN1F], first retrieved from FRED, Federal Reserve Bank of St. Louis, August 28, 2025](https://drduru.com/onetwentytwo/wp-content/uploads/2025/09/20250925_New-home-sales-August-2025.png "new home sales")
Existing Home Sales – October, 2025
October’s existing home sales increased 1.2% month-over-month and increased 1.7% year-over-year. Sales continue to increase per the expectations of the National Association of Realtors (NAR) with higher inventories and lower mortgage rates. Still, sales are well of the highs for the year.
Sales in October were strong enough to cause a net inventory drawdown. If sellers do not respond by putting more inventory on the market (and at lower prices), I still expect overall sluggishness until at least the next spring selling season. (See the story below about record delistings).

(For historical data from 1999 to 2014, click here. For historical data from 2014 to 2018, click here) Source for chart: National Association of Realtors, Existing Home Sales© [EXHOSLUSM495S], retrieved from FRED, Federal Reserve Bank of St. Louis, November 27, 2025

Absolute inventory decreased sequentially 0.7% to 1.52M unsold homes and printed a 10.9% year-over-year gain. According to the NAR, there is a “4.4-month supply of unsold inventory, down from 4.5 months in September and up from 4.1 months in October 2024”. Absolute inventory increased on a year-over-year basis for a 9th straight month.
The median sales price of an existing home set a record in June at $432,700 and has trended downward since then. October’s median price of $415,200 was the first sequential gain (0.7%) since June’s peak. The median price also extended its streak of year-over-year price increases to 28 months with a 2.1% gain.
The average time on the market for an existing home increased from 33 days in September to 34 in October. The year-over-year increase from 29 days represents some of the sluggishness of the market for existing homes.
The share of sales going to first-time home buyers increased from 30% in September to 32% in October and up from 27% a year ago. I am surprised by the large jump in share given the parallel increase in the median home price. The NAR’s 2017 Profile of Home Buyers and Sellers reported an average of 34% for 2017, 33% for 2018, 33% for 2019, 31% for 2020, 34% for 2021, 26% for 2022, 32% for 2023, and a plunge to an all-time low of 24% in 2024.
For the second month in a row, the West was the only region without a year-over-year sales increase. This time the West declined. The regional year-over-year changes were: Northeast +4.3%, Midwest +2.1%, South +2.8%, West -2.6%. The continued gains in the South are a particularly encouraging sign for the housing market.
Single-family existing home sales increased 0.8% to 3.71M in October and increased by 1.9% year-over-year. The median price of a single-family home was $420,600, up 2.2% year-over-year and up 0.7% month-over-month.
California Existing Single-Family Home Sales – October, 2025

California’s existing single-family home sales bucked the recent weakness in the West region. Sales reached an 8-month high with a gain of 1.9% from September and a 4.1% year-over-year gain to 282,590 in October. The median price increased 0.4% month-over-month and decreased 0.2% year-over-year to $886,960. The median price per square foot increased from $427 in September to $431 in October. The sales-price-to-list-price ratio paused its downtrend by staying flat at 98.3%. A year ago the ratio stood at 99.9%.
In August, the California Association of Realtors (C.A.R.) optimistically looked forward to “stronger buyer activity and renewed demand in the months ahead”. The organization tempered expectations a bit in September and again in October as “mortgage rates, which briefly approached their 12-month low in October, have resumed an upward trajectory as the Federal Reserve took a more cautious approach during the government shutdown…with the market easing into its seasonal slowdown, housing demand will stay soft, and California is likely to close out 2025 with only a modest uptick in home sales over last year”.
August’s unsold inventory index (UII), which measures the number of months needed to sell the supply of homes on the market at the current sales rate, decreased from 3.6 in September to 3.2 in October, slightly higher than the 3.1 from a year ago, as sales increased and active listings fell. While total active listings continued a sequential slide, they increased year-over-year for the 21st month in a row by 10.3%.
The median time on market stayed flat at 32 days for single-family existing homes, up by 7 year-over-year. For condos and townhomes, median time on market increased from 37 to 38 month-over-month and 10 days year-over-year.
Home closing thoughts
Supply Shrinking Again
California is not the only region with persistent sequential declines in total active listings. According to Redfin, a historic number of delistings is helping to prop up home prices. The 5.5% of total listings that left the market is the highest rate of delcine for a September in 8 years. Florida is ground zero for this inventory shrinkage. The delisting rate reached a peak near the end of 2022 and troughed in 2023. The inability to sell at an agreeable price was a prime driver of delistings.
These delistings combined with the parallel increase in the inventory of new homes helps to paint a picture of a sluggish housing market.
Spotlight on Mortgage Rates…And Affordability
The Mortgage Bankers Association (MBA) reported 2 weeks with a decrease in mortgage applications and two weekly increases for the month of November. For all of October, new home purchase mortgage applications dropped 2.3% year-over-year and 1% sequentially. Surprisingly, at the same time, the MBA estimated an increase in the sale of new homes (see above).
A jump in sales would be consistent with improved affordability. The MBA reported an ongoing improvement in affordability: “Affordability conditions have now improved for the fifth consecutive month because of lower mortgage rates, higher household earnings, and flattening home-price growth”. The MBA’s Purchase Applications Payment Index (PAPI) is now at a 3 1/2 year low.
Softer prices will need to carry the load for affordability after mortgage rates stopped falling in November just as I anticipated in the last housing market review. This stall increases the tension in the market for the upcoming announcement on monetary policy (interest rates) from the Federal Reserve on December 10th.
![Freddie Mac, 30-Year Fixed Rate Mortgage Average in the United States [MORTGAGE30US], retrieved from FRED, Federal Reserve Bank of St. Louis; November 28, 2025](https://drduru.com/onetwentytwo/wp-content/uploads/2025/11/20251128_30-Year-Fixed-Rate-Mortgage-Average-in-the-United-States.png)
Be careful out there!
Full disclosure: long ITB shares and calls