

Housing Market Intro and Summary
What happened in the housing market for September, 2025? A rate cut fail unfolded as a resumption of rate cuts by the Federal Reserve failed to revive the stocks of homebuilders. This market reaction suggests that housing market data will remain soft for some time to come.
Here is a summary for September’s market data:
- The stocks of home builders are precariously teetering on a return to bear market territory.
- While home builder sentiment remains just above historic lows, a measure future sales expectations showed some fresh signs of life.
- Single-family housing starts continued to decline well below the 1M level, setting up a stark contrast with the small improvement in future sales expectations.
- Sales of new single-family homes surged but will likely incur downward revisions.
- Existing home sales continues to bounce along the lows of the last year or so.
- California’s market for existing homes may have reached a (unstable?) balance between supply and demand.
- Besties are increasingly partnering to buy homes as a way of coping with affordability challenges.
- Mortgage rates fell to a near one-year low.
Housing Stocks
In August, the iShares US Home Construction ETF (ITB) completed the bearish to bullish reversal that I anticipated several months prior. In September, that bullish reversal teetered as ITB fell under its 50-day moving average (DMA) (the red line below) with the bear market line not much lower from there. Note well how the Federal Reserve’s rate cut did nothing for ITB; a rate cut fail. In fact, the ETF sold off going into and coming out of the rate cut; ITB is down 4.2% since the rate cut. ITB’s year-to-date performance advantage over the S&P 500 evaporated, 3.5% vs 13.0% respectively. On the positive side, I see the potential for this setback to set up attractive entry points for trading the seasonally strong period for the stocks of homebuilders.
")
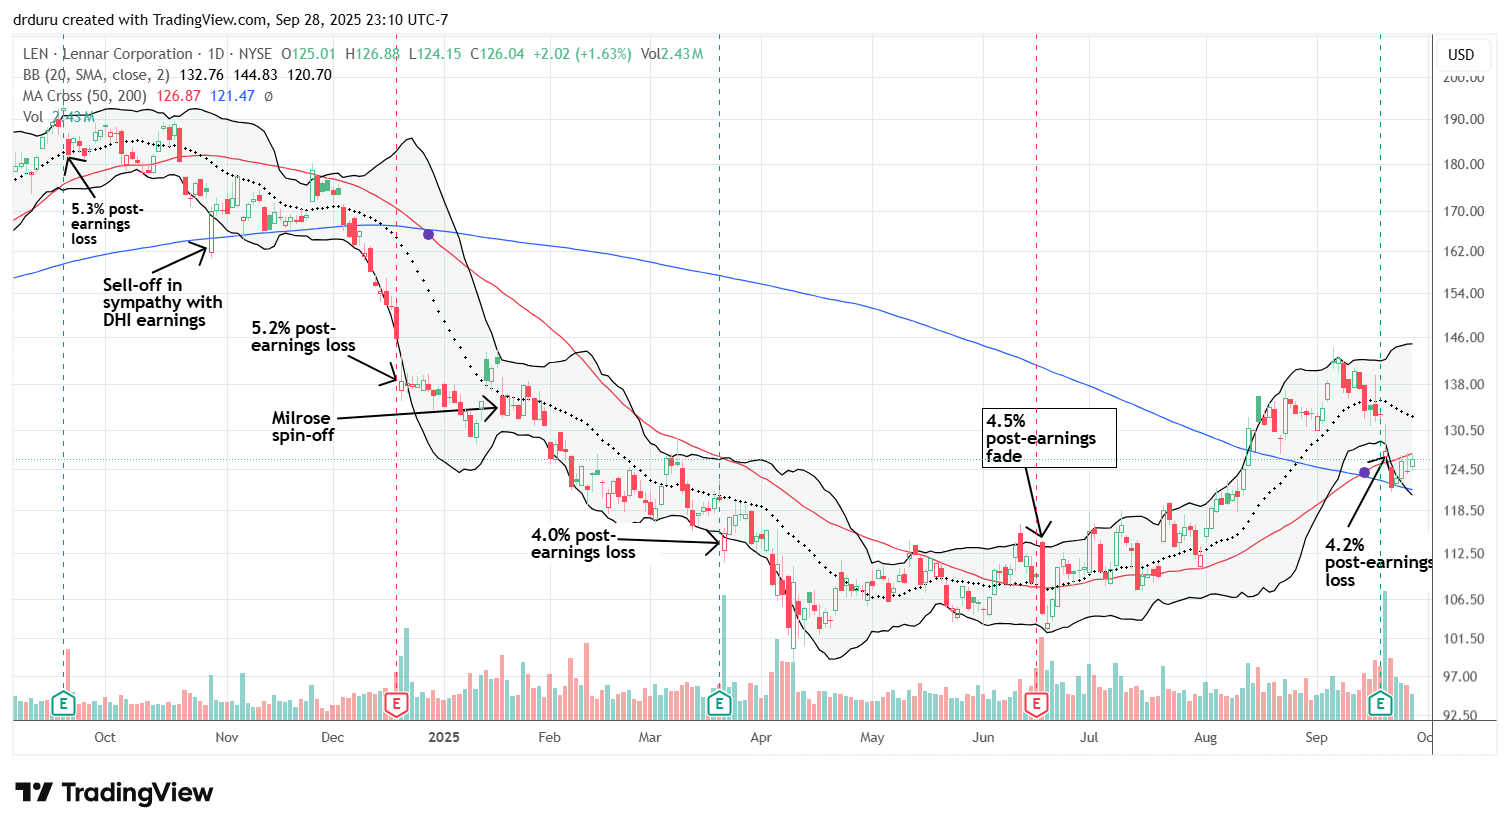
A poor reaction to earnings from Lennar Corporation (LEN) also weighed on ITB. LEN gapped down and lost 4.2% after reporting earnings the day after the Fed’s announcement on monetary policy. The market seems to be getting increasingly nervous about the dependence on mortgage rate buydowns and incentives to keep sales propped up. During the conference call for its earnings report, Lennar acknowledged that “sales volume was difficult to maintain and required additional incentives in order to achieve our expected pace and to avoid building excess inventory.” Incredibly, LEN has suffered losses the day after reporting earnings ever since March, 2024.
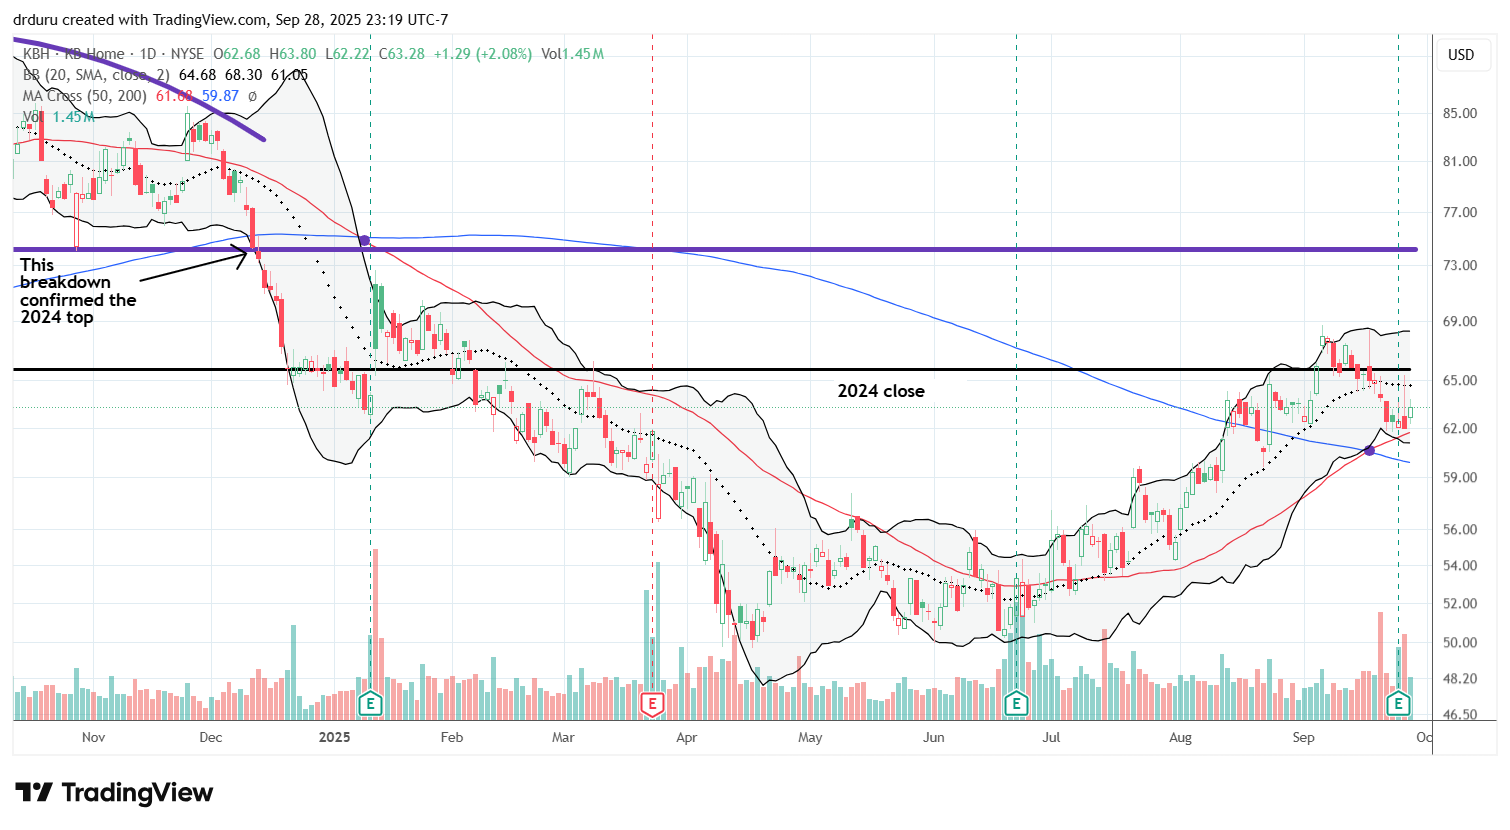
KB Home (KBH) surprisingly fared better than Lennar, perhaps because a sufficient number of sellers exited KBH after LEN’s earnings results. KBH held roughly flat and now trades in positive post-earnings territory after slightly lowering its housing revenue forecast. I bought a KBH call spread ahead of earnings anticipating a return of some momentum from the bearish to bullish reversal. Now I am just looking for KBH to rise along with its uptrending 50DMA support.
Housing Data
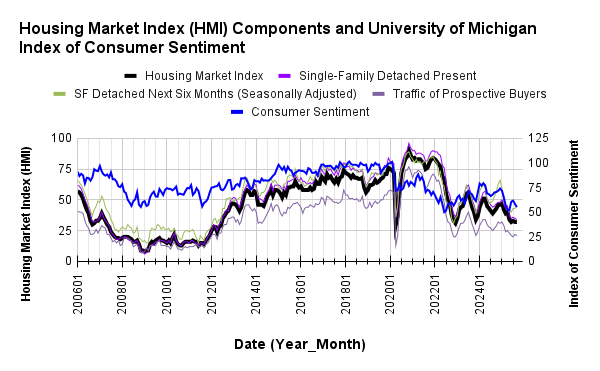
Home Builder Confidence: The Housing Market Index – September, 2025
The National Association of Home Builders (NAHB)/Wells Fargo Housing Market Index (HMI) stayed flat with August’s 32 reading. While the HMI still sits just above pandemic lows, the NAHB celebrated a 2-point increase in the “SF Detached Next Six Months” component, a measure of future sales expectations, to a 6-month high. Surprisingly, these increased sales expectations accompanied a 1-point decline in the “Traffic of Prospective Buyers” component. The “Single-Family: Present” component stayed flat. Builders appear to be marginally more optimistic given, at that time, expectations for Fed rate cuts to help lower the cost of construction loans and, presumably, help lower mortgage rates further.
/Wells Fargo Housing Market Index (HMI) and the University of Michigan Index of Consumer Sentiment")
Source for data: NAHB and the University of Michigan
Sagging consumer sentiment is once again converging with poor builder sentiment.
Overall pricing power declined yet again for builders. The 39% share of builders cutting prices is one percentage point above the previous post-COVID record set in July and two percentage points above August’s level. The share of builders providing incentives nudged lower from a downwardly adjusted 66% in August to 65% in September. The average price discount remained flat at 5% where it has stayed since November, 2024.
The Northeast drove the entire decline for the HMI in August, and in September it was the only region to experience an increase. The 4-point surge makes me suspect that much of the rise in the future sales component of the HMI also came from the Northeast. The Northeast is also still 4 points below its level from July. The 1 point declines from the Midwest and the West bolster my estimate that the Northeast drove almost all if not all the gains in future sales expectations. The South remained flat at a 29 HMI.
New Residential Construction (Single-Family Housing Starts) – August, 2025
In a sign that builders are trying to slow the growth of ballooning housing inventories, single-family housing starts tumbled to levels last seen in July, 2024. August starts decreased 7.0% from July and plunged 11.7% year-over-year.
![US. Bureau of the Census, Privately Owned Housing Starts: 1-Unit Structures [HOUST1F], first retrieved from FRED, Federal Reserve Bank of St. Louis, September 18, 2025](https://drduru.com/onetwentytwo/wp-content/uploads/2025/09/20250918_Housing-starts-August-2025.png "Housing starts")
I previously hoped that the first sequential increase in building permits since February marked a bottoming in builder sentiment. Instead, August’s permit numbers showed a resumption in what is now a decline that began after January’s peak. Permits decreased 2.2% from July and declined 11.5% year-over-year. Permits have declined year-over-year since June, 2024.
Every region lost starts year-over-year. The Northeast, Midwest, South, and West each changed -12.9%, -4.3%, -11.7%, and -15.8% respectively year-over-year.
New Residential Sales (Single-Family) – August, 2025
New home sales surged in August. However, the stark contrast from declining starts makes me think August’s new home sales will get a significant downward revision. Moreover, the NAHB made it clear that future revisions will likely bring this sales number down. Sales jumped 20.5% from an upwardly revised July sales figure of 664K to 800K in August. Year-over-year sales increased 15.4%. In the context of the bearish to bullish reversal for the stocks of home builders, a large increase in sales makes sense for August. So I expect that even after revisions, August will remain a (marginal?) breakout month. The margin of error on the sequential change is a particularly large ±21.8% and greater than July’s ±15.5%.
![US. Bureau of the Census, New One Family Houses Sold: United States [HSN1F], first retrieved from FRED, Federal Reserve Bank of St. Louis, August 28, 2025](https://drduru.com/onetwentytwo/wp-content/uploads/2025/09/20250925_New-home-sales-August-2025.png "new home sales")
For August, the median price for new homes jumped 4.7% sequentially and increased 1.9% year-over-year to $413,500. I continue to hold my assumption that a price range between $400,000 and $440,000 will remain in place given mortgage rates continue to decline.
As with many of the prior swings, July’s price swung with notable changes in sales mix. However, August’s shifts are likely to change significantly assuming sales get revised notably downward. In particular, sales of homes priced over $1M jumped sequentially from 3% to 7% of sales. If this share declines, then the median price will also come down. Thus, I am withholding commentary on the mix until September’s numbers.
July’s inventory was revised downward from 9.2 months of sales to 9.0. August’s inventory plunged to 7.4 months of sales compared to 8.2 months a year ago. Given the likely downward revision in sales, the absolute inventory is more informative. Absolute inventory declined sequentially for the third month in a row. What looked like a steady increase now looks like a plateau since February. As the NAHB noted, inventory is coming down as builders slow down housing starts.
All regions logged significant gains in sales sequentially and year-over-year except the West which managed a year-over-year decline. The Northeast, Midwest, South, and the West changed +40.9, +20.3%, +21.0%, -5.7% respectively year-over-year. Presumably, each region will experience downward revisions.
Existing Home Sales – August, 2025
Existing home sales data have become predictably boring. August’s existing home sales decreased 0.2% month-over-month and increased 1.8% year-over-year. The National Association of Realtors (NAR) expects sales to pick up in coming months because of increasing inventory and declining mortgage rates. I am expecting continued sluggishness until the next spring selling season approaches. Increased inventory has rarely catalyzed increased sales these past few years and affordability has proven more critical than rates per se. If mortgage rates come down enough to stoke incremental demand, I fully expect sellers to start “absorbing” much of the economic benefit in the form of higher prices.
The NAR went on to project that “record-high housing wealth and a record-high stock market will help current homeowners trade up and benefit the upper end of the market.” Limited inventory is constraining the affordable segment of the market. However, NAR oddly attributed the Midwest’s out-performance to affordability: “The Midwest was the best-performing region last month, primarily due to relatively affordable market conditions”. The Midwest has been the most affordable part of the housing market for quite some time, so I doubt the region’s affordability in August is a prime catalyst of sales gains. The chart below shows a consistent and persistent separation over the past year (earlier data unavailable).
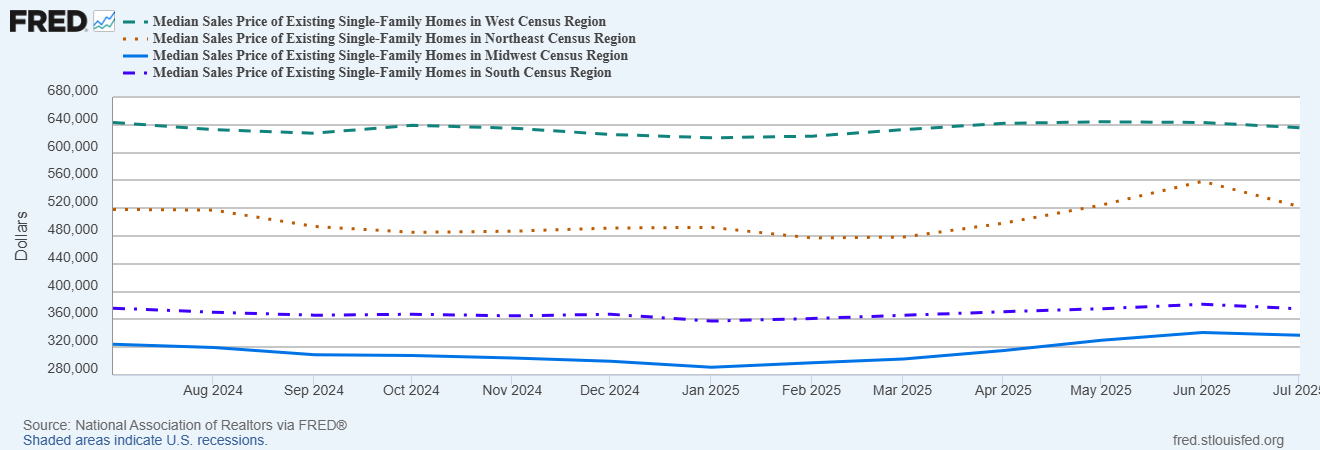
Source: National Association of Realtors, Median Sales Price of Existing Single-Family Homes in West Census Region [HSFMEDUSWTM052N], retrieved from FRED, Northeast Census Region [HSFMEDUSNEM052N], retrieved from FRED, Midwest Census Region [HSFMEDUSMWM052N], retrieved from FRED, South Census Region [HSFMEDUSSOM052N], retrieved from FRED, Federal Reserve Bank of St. Louis.
{Updated sales chart not available at the time of writing}

(For historical data from 1999 to 2014, click here. For historical data from 2014 to 2018, click here) Source for chart: National Association of Realtors, Existing Home Sales© [EXHOSLUSM495S], retrieved from FRED, Federal Reserve Bank of St. Louis, August 21, 2025

Absolute inventory declined sequentially 1.3% to 1.53M unsold homes, but printed an 11.7% year-over-year gain. According to the NAR, there is a “4.6-month supply of unsold inventory, no change from July and up from 4.2 months in August 2024”. The decline in months of supply ends an uptrend streak at six months. Absolute inventory increased on a year-over-year basis for a 7th straight month.
The median sales price of an existing home set a record in June at $432,700, fell 2.4% in July to $422,400 in July, and essentially stayed flat in August at $422,600. The median price extended its streak of year-over-year price increases to 26 months with a 2.0% gain.
The average time on the market for an existing home increased from 28 days in July to 31 in August. The year-over-year increase from 26 days continues to highlight the sluggishness of the market.
The share of sales going to first-time home buyers dropped from 30% in May and June to 28% in July and stayed flat in August but up from 26% a year ago. The NAR’s 2017 Profile of Home Buyers and Sellers reported an average of 34% for 2017, 33% for 2018, 33% for 2019, 31% for 2020, 34% for 2021, 26% for 2022, 32% for 2023, and a plunge to an all-time low of 24% in 2024.
Regional sales were mixed. The regional year-over-year changes were: Northeast -2.0%, Midwest +3.2%, South +3.4%, West +0.6%.
Single-family existing home sales decreased 0.3% to 3.63M in August and increased by 2.5% year-over-year. The median price of a single-family home was $427,800, up 1.9% year-over-year and down 0.2% month-over-month.
California Existing Single-Family Home Sales – August, 2025

California’s market for existing single-family homes seems to be settling into a tightening range. August sales increased 0.9% from July following a 1.0% decrease from June to July. August sales decreased just 0.2% year-over-year. The median price increased 1.2% month-over-month following a 1.7% sequential decline and increased 1.2% year-over-year to $888,740. The median price per square foot fell year-over-year for the fourth straight month, this time falling from $427 to $426. After finally falling in June after an extended stretch at 100%, the sales-price-to-list-price ratio fell again in July and now in August. This time the ratio fell from 98.5% to 98.3%.
The California Association of Realtors (C.A.R) called June’s market “stagnant”. The organization described a “modest slowdown” for July’s market. For August, C.A.R. thinks “the market appears to have found a short-term balance between supply and demand”. Pending sales increased year-over-year for the first time in 9 months (after revisions). C.A.R.’s president remained hopeful for a rebound in the second half of the year. Lower mortgage rates and a resulting increase in purchase applications hold out the prospect of “stronger buyer activity and renewed demand in the months ahead”.
August’s unsold inventory index (UII), which measures the number of months needed to sell the supply of homes on the market at the current sales rate, increased from 3.7 in July to 3.9 in August. The UII was 3.2 a year ago. Total active listings increased 23.5% year-over-year (in May it was 50%, in June it was 40%, in July it was 37.7%) but fell from July’s 69-month high. The year-over-year increase was the 19th straight..
The median time on market increased from 24 days in June to 28 in July and soared to 31 days in August, up from 22 a year ago.
Home closing thoughts
Besties As Long-Term Roomies
Housing is so expensive that apparently an increasing number of besties are becoming long-term roomies by partnering on purchasing a home. According to reports quoted by NPR in “Why friends are teaming up to buy homes“:
“Millennial homeowners were more likely to have purchased a home with one or more friends (14%) than Gen X homeowners (4%) or baby boomer homeowners (1%), according to a 2024 survey from the consumer finance company Bankrate. And a 2024 report from the insurance agency JW Surety Bonds found that 70% of Generation Z is willing to co-buy with a friend, the highest of any generation it surveyed.”
The law may need to catch up to this trend as protections in homeownership are focused on couples. Thus, besties agreeing to a co-purchase need to carefully set expectations, preferably in writing, on how to handle a whole host of contingencies.
Spotlight on Mortgage Rates
The Mortgage Bankers Association (MBA) reported 3 weeks with an increase in mortgage applications and one weekly decrease for the month of September. New home purchase mortgage applications for August increased 1.0% year-over-year and decreased 6.0% from July (not seasonally adjusted).
Mortgage rates fell to a near 1-year low. The on-going drop is impressive considering long-term bond yields increased after the Federal Reserve cut rates a week and a half ago. Still, I am holding my caution about the impact of a more dovish Federal Reserve. So far, the bond market is repeating last year’s response to Fed rate cuts into a relatively strong economy.
![Freddie Mac, 30-Year Fixed Rate Mortgage Average in the United States [MORTGAGE30US], retrieved from FRED, Federal Reserve Bank of St. Louis; September 28, 2025](https://drduru.com/onetwentytwo/wp-content/uploads/2025/09/20250928_30-Year-Fixed-Rate-Mortgage-Average-in-the-United-States.png)
Be careful out there!
Full disclosure: long ITB shares and calls, long KBH call spread