

Housing Market Intro and Summary
What happened in the housing market for June, 2025? The spring housing market slipped further, reinforcing a trend of deepening weakness. Inventories continued to surge while both prices and mortgage rates remained elevated. Builders are pulling back, permits are declining, and buyer demand is soft. The housing market’s deteriorating momentum stands as a sobering counterpoint to the stock market’s test of all-time highs.
- Weak earnings reports from builders Lennar Corporation and KB Home confirmed a spring selling season that failed to spring.
- The South and the West regions drove home builder sentiment to its 3rd lowest level since 2012.
- Single-family housing starts flattened while building permits continued to plunge to fresh 2-year lows.
- Sales of new single-family homes dropped back to the lower bound of a multi-year range. Given other housing data, the lower part of the range looks likely to give way before the top of the range gives way.
- Surging total housing inventories are finally lowering expectations for the housing market.
- A tepid increase in existing home sales led to the lowest sales pace for a May since May 2009 as pricing pressures continue to increase.
- Sales in California’s existing home market dropped to a 4-month low amid a continued surge in listings.
- Famed financial analyst and strategist Meredith Whitney made the case for a housing market that will worsen throughout the year.
- The Joint Center of for Housing Studies of Harvard University released its annual report on housing and described a wide array of challenges facing the market, including buyers and renters.
- Mortgage rates trended slightly lower in June.
Housing Stocks
The iShares US Home Construction ETF (ITB) extended its bear market for yet one more month. The only relief in sight is the faint hope that rate cuts are imminent (and hopefully without accompanying economic weakness). At the time of writing, the ETF of housing related stocks is on track for its first positive month of gains since January. The 3.1% month-to-date gain is just short of the 3.8% gain for the S&P 500 (SPY). Of course, the S&P 500 is testing its all-time high while ITB is struggling to avoid revisiting prices last seen in December, 2023. Moreover the S&P 500 continues to enjoy an uptrend from the lows of the tariff drama, trauma, and noise, while ITB has just bounced around in a range since April.
I remain wary about the downstream economic implications of on-going weakness for housing. However, at least ITB has stopped going down, so the ETF is one catalyst away from completing a bearish to bullish reversal.
")
Lennar Corporation (LEN) reported earnings in mid-June. The results contained the expected impact of what management described as a softening market, including increased incentives, lower earnings, and lower margins. Yet, the stock delivered a confused reaction. LEN first gapped higher for a 4.1% gain before sellers took over for the rest of the day. LEN closed down 4.5% and looked set to head for a new 2+ year low. Instead, the stock just barely missed testing the low of the year from April and rebounded right back to where it closed before earnings. The indecision makes sense given the swirl of catalysts that could resolve well or poorly in the coming months. If not for the hopes for rate cuts, I imagine LEN would be trading at new lows for the year.
")
KB Home (KBH) reported earnings at the beginning of the week. Traders and investors skipped most of the dramatic reaction to LEN’s earnings and instead chose to barely react at all. The biggest excitement came from a 3.0% on the day going into earnings. That gain did not hold. The company reported “subdued” demand as it lowered guidance on revenue and margins. Most telling is KBH’s plans to scale back land-related investments; KBH is expecting a softer market to persist for some time…even with hopes for rate cuts later this year. Buying $200M shares in the last quarter likely helped keep the stock off the April lows.
")
I expect similarly weak earnings reports from builders in the coming earnings season. The spring selling season was weak as expected and builders will need to choose between lower margins or lower revenues as they increase incentives to motivate buyers to act in an expensive and increasingly unaffordable market.
Housing Data
Home Builder Confidence: The Housing Market Index – June, 2025
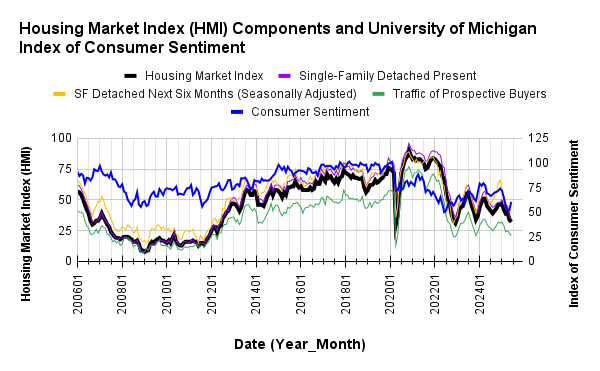
The National Association of Home Builders (NAHB)/Wells Fargo Housing Market Index (HMI) continued its decline into historic lows. In May, the HMI plunged 6 points to a level last seen in November, 2023. June’s 2-point decline took the HMI to its 3rd lowest level since 2012. The pandemic-driven low of 30 seems within reach by the fall. The NAHB warned that “buyers have increasingly moved to the sidelines due to elevated mortgage rates and tariff and economic uncertainty.” May’s quasi-optimism over the U.S. and China trade war ceasefire resoundingly evaporated with June’s data.
The HMI components fell in unison, each by two points. For the second month in a row, the “Single Family: Present” component demonstrated the worst relative performance. It was the one component that fell all the way to 12-year lows. The other two components fell just short of the pandemic and 2022 bear market lows. Accordingly, I expect the next round of earnings reports from builders to continue the narrative of weakening markets told by Lennar ad KB Home.
/Wells Fargo Housing Market Index (HMI) and the University of Michigan Index of Consumer Sentiment")
Source for data: NAHB and the University of Michigan
Consumer sentiment sharply diverged from housing sentiment in June, setting up the potential for a brief rebound in housing sentiment off the lows in the coming months.
Pricing power declined for builders again. The 37% share of builders cutting prices is the highest level on record over the short time the NAHB has collected data (since 2022). The share of builders providing incentives stayed flat with May and April at 61% while the average price discount was also flat at 5%.
The Northeast avoided a decline in sentiment while the two largest regions suffered significant declines. The South extended its losing streak to 6 straight months and dropped to a 13-year low, leading the HMI downward. The West fared even worse by declining to a level last seen in January, 2012. The Northeast gained 2 points. The Midwest declined just one point. May’s revision shows that losses in the South and West were one point worse than the initial estimate. Yet, June’s declines were still substantial with the South dropping 2 points and the West another 5 points. Builders with significant business in the West and South, just about all publicly traded builders, are sure to show significant deterioration in business in the next round of earnings.
As proof positive, Lennar’s weakest markets last quarter were all in the West and South (from the Seeking Alpha transcript): “The markets that experienced more challenging conditions during the quarter were the Pacific Northwest markets of Seattle and Portland, the Northern California markets of the Bay area in Sacramento, the Southwestern market of Phoenix, Las Vegas and Colorado and some Eastern markets such as Raleigh, Atlanta and Jacksonville. These markets experienced sensitivity to higher home prices and/or the macro impact on the technology workforce.”
New Residential Construction (Single-Family Housing Starts) – May, 2025
Single-family housing starts essentially held flat despite the fresh drop in builder sentiment. After plunging 13.8% from February to March, starts fell an additional 2.1% sequentially in April. May’s 0.4% sequential gain was overshadowed by a 7.4% year-over-year drop.
![US. Bureau of the Census, Privately Owned Housing Starts: 1-Unit Structures [HOUST1F], first retrieved from FRED, Federal Reserve Bank of St. Louis, June 18, 2025](https://drduru.com/onetwentytwo/wp-content/uploads/2025/06/20250618_Housing-starts-May-2025.png "Housing starts")
In further confirmation of sinking home builder sentiment and weakening future prospects, building permits continue to trend downward. March delivered the first significant decline since the trough last June. Permits plunged to a 2-year low in April, and May’s 2.7% sequential decline took permits to a level last seen in April, 2023 coming out of a trough. Accordingly, I continue to expect the next round of earnings reports from builders to further disappoint the market.
The Midwest was a notable regional exception to the year-over-year declines in starts. The Northeast, Midwest, South, and West each changed -8.6%, +32.1%, -10.4%, -17.1% respectively year-over-year.
New Residential Sales (Single-Family) – May, 2025
April’s new home sales stuck out like an anomaly amid all the dour news of the spring buying season. At the time, both the NAHB and I expected downward revisions. However, relatively strong data on mortgage applications backed me away from anticipating a major downward revision. Sure enough, the U.S. Census Bureau revised April downward, from 743K to 722K, placing sales comfortably within the range in place since November, 2022 of 595K to 741K. However, sales for May still suffered a substantial decline. The 13.7% sequential decline and the 6.3% year-over-year decline to 623K brought sales right back down to the lower bound of the range. All signs are pointing now to the lower part of the range breaking before the top of the range gives way given the sharp slowdown in housing starts.
![US. Bureau of the Census, New One Family Houses Sold: United States [HSN1F], first retrieved from FRED, Federal Reserve Bank of St. Louis, June 25, 2025](https://drduru.com/onetwentytwo/wp-content/uploads/2025/06/20250625_New-home-sales-May-2025.png "new home sales")
For May, the median price for new homes actually increased by 3.7% sequentially and gained 3.0% year-over-year to $426,600. A range seems to be unfolding between $400,000 and $440,000. Excluding the all-time high in October, 2022, this range has been in place since August, 2021. As with many of the prior swings, May’s price swung with notable changes in sales mix.
New single-family homes shifted sharply into the $500,000 to $799,999 range with all the share coming from the below $500,000 segment. Thus the spring selling season is ending with a major retreat from the market by lower-income buyers. Year-over-year, the shift is more mixed with the under $300,000 price range actually gaining 4 points of share from 16% to 20%.
May’s inventory surged from April’s 7.4 (revised significantly downward from 8.1 given the sales revision) to 8.9 months of sales. For comparison, a year ago inventory sat at 7.6 months of sales. Absolute inventory resumed its steady march higher to a near 18-year high. For April, the NAHB finally got more wary about these ballooning inventory numbers. From its report on new home sales:
“As estimated by NAHB, total months’ supply, defined as a combination of current new and resale single-family inventory, now stands at 5.2. This is the highest sales-adjusted inventory level since 2015 and will place downward pressure on housing construction starts in the months ahead.”
Recall that the NAHB also cautioned last month that “the market will face notable inventory impacts on production as this measure approaches 5.5.”
The Northeast was the only region to lose sales year-over-year in April. For May, it joined the West in gaining sales year-over-year. Northeast sales rebounded away from the bottom of a range in place since 2016. The Northeast, Midwest, South, and the West changed +48.0%, -3.7%, -15.5%, +8.9% respectively year-over-year. The South is again the region with the most notable weakness with sales also declining 21.1% from April.
Existing Home Sales – May, 2025
The hopes for the spring season faded quickly off the highs of February existing home sales. March sales brought the picture right back down to reality with a 5.9% drop to levels last seen in October, 2024. April existing home sales slid further. May sales made a tepid attempt at a rebound with a 0.8% increase from April and 0.7% year-over-year decline, according to the NAHB the lowest sales pace for May since 2009. The sharp jump in pending home sales in March failed to translate into significant gains for existing home sales. April’s pending home sales reversed almost all of March’s gains and dropped the indicator close to the all-time low set recently.

(For historical data from 1999 to 2014, click here. For historical data from 2014 to 2018, click here) Source for chart: National Association of Realtors, Existing Home Sales© [EXHOSLUSM495S], retrieved from FRED, Federal Reserve Bank of St. Louis, June 25, 2025

While buyers fade, sellers continue to respond to the spring housing market with a surge in inventory. Inventory jumped in May by 6.2% from April and a whopping 20.4% year-over-year, a third consecutive month with such a surge. As a reminder, in the report on February sales, the NAR celebrated February’s increase in sales and inventory by stating “…more inventory and choices are releasing pent-up housing demand.” That was a rare moment in recent years when that relationship seemed to hold true. Now, the NAR looks forward with hopes resting on lower interest rates to unlock demand: “If mortgage rates decrease in the second half of this year, expect home sales across the country to increase due to strong income growth, healthy inventory, and a record-high number of jobs.”
May inventory hit 1.5M. According to the NAR, there is a “4.6-month supply of unsold inventory, up from 4.4 months in April and 3.8 months in May 2024.” The months of supply and absolute inventory have now increased for five consecutive months.
The surge in inventories did not cool off pricing pressures, an on-gong pattern. Year-over-year pricing increased again despite the surge in year-over-year inventories. The median sales price of an existing home increased 2.1% from April March to $422,800 and increased 1.3% year-over-year. This 23nd straight year-over-year increase represents the relentless march that soon will take the median price above last June’s record high of $426,900.
The average time on the market for an existing home decreased from 29 days in April to 27 days in May. While the spring buying season featured a sequential decline in time on the market, the year-over-year increase from 24 days characterizes the sluggish seasonal market.
The share of sales going to first-time home buyers ended its spring season upward momentum. These sales increased from a 28% share in January to 31% in February to 32% in March to 34% in April and now 30% in May, down from 31% a year ago. The NAR’s 2017 Profile of Home Buyers and Sellers reported an average of 34% for 2017, 33% for 2018, 33% for 2019, 31% for 2020, 34% for 2021, 26% for 2022, 32% for 2023, and a plunge to an all-time low of 24% in 2024.
In March, the West flipped from being a large contributor to sequential sales gains in February to the largest contributor to the sequential sales decline. For April, the Northeast was the only region not to decline in sales year-over-year. May’s sales changes were mixed. The regional year-over-year changes were: Northeast +4.2%, Midwest +1.0%, South -0.5%, West -6.7%.
Single-family existing home sales increased 1.1% from April to 3.67M in May and increased by 0.3% year-over-year. The median price of a single-family home was $427,800, up 1.3% year-over-year and up 2.3% month-over-month.
California Existing Single-Family Home Sales – May, 2025

California’s housing market in May was down across the board for sales and price. The 5.1% month-over-month and 4.0% year-over-year decline (the largest since December, 2023) to 254,190 took the sales of existing single-family homes in California to a 4-month low. The San Francisco Bay Area drove much of the decline from last year. The median price fell 1.1% from April’s all-time high and 0.9% year-over-year to $908,000. The median price per square foot fell just 0.7% from $443 to $446 year-over-year. The C.A.R. named a (surprisingly) wide variety of drivers of this minor price decline: “…including elevated interest rates, insurance availability/affordability, economic uncertainty and home sellers’ willingness to reduce prices.” That reported willingness to reduce prices is not yet showing up in the sales-price-to-list-price ratio which stayed flat yet again at 100%.
The C.A.R. described home prices as “leveling off”. Given prices are just one month off an all-time high, I think this description reflects expectations. According to the C.A.R., “home prices will likely come down further from April’s record high as the market enters the second half of the year. Seasonality will play a role in the price moderation, and an increase in housing supply will also relieve upward price pressure.”
The supply of housing as expressed in listings is truly ballooning. May’s unsold inventory index (UII), which measures the number of months needed to sell the supply of homes on the market at the current sales rate, increased from 3.5 in April to 3.8 in May and soared year-over-year from 2.6. Total active listings soared 50% year-over-year for a 67-month high and a 16th straight year-over-year increase. Accordingly, new active listings increased 3.5% month-over-month and 22.8% year-over-year. Contrary to its expressed driver for a leveling in prices, the C.A.R. expects the growth rate in new active listings to slow and lead to “a plateau sometime in the next two months.”
The C.A.R. took some solace in a small improvement in housing sentiment as expressed through buying attitudes. According to the C.A.R., “consumers who believed ‘now is a good time to buy’ climbed to 26 percent in May ― the highest level since February 2022 ― from 23 percent in April.” This minor increase to a 3+ year high tells me that sentiment has essentially flat-lined for quite some time. A continued rise from here could mark a significant turn for California. Indeed, the C.A.R. went on to state that “if this optimism continues to rise for another month while mortgage rates stabilize, the market momentum could pick up again to turn around the buying season.” I think this would be more of a hopeful sign for 2026.
The median time on market stayed flat with April at 21 days, up from 16 a year ago.
Home closing thoughts
Total Inventory Almost Balanced….
….but will total inventory stop at just 6.0 months of sales, the conventional definition of a balanced housing market? The chart below from the NAHB shows sharply rising inventory since the double trough of 2020 and 2022. The trend since the lows of 2023 has been cyclical but consistently higher. Now with inventory at levels last seen in 2015, I have every reason to expect inventory to surpass the 6.0 level. Sales of both new and existing homes are likely to continue slowing in coming months and slowing starts will not likely make up for a steady increase in the inventory of existing homes. The housing market is switching from a market of pent-up demand to a market of pent-up selling pressures.

Meredith Whitney: Housing Market Will Continue to Worsen Through the Year
Earlier this year, the NAR provided a surprisingly upbeat forecast for home sales this year. After the spring selling season ground into disappointment, that forecast of a 6% year-over-year gain in existing sales and 10% gain in new home sales seems in dire need of a significant downgrade. Long-time institutional investor and analyst Meredith Whitney started the interview below with a stark for the year: “the housing market looks like it’s going to be up for its worst year in decades.” Here are her key points (with help from a ChatGPT review of the video transcript):
- Boomers Staying Put: Seniors, owning over 60% of homes, are aging in place and using home equity—contributing to tight housing supply.
- Younger Buyers Locked Out: Millennials and Gen Z face affordability challenges due to high costs and student debt, favoring renting over buying.
- Student Loan Drag: Resumed student loan payments could trigger defaults and reduce consumer spending, hurting the economy and further pressuring the housing market.
- Price-Rate Paradox: High interest rates have not lowered home prices due to tight supply in desirable areas, keeping buyers sidelined. Mainly people with means are moving.
- Policy and Social Shifts: Delayed life milestones and lack of housing incentives are stalling homeownership and reshaping buyer behavior.
The State of the Nation’s Housing 2025
Earlier this month, The Joint Center of for Housing Studies of Harvard University released its annual report on the state of housing in the United States. The extensive and comprehensive report included the following executive summary:
“In 2025, households and housing markets face an ever-more challenging environment. High home prices and elevated interest rates reduced homebuying to its lowest level since the mid-1990s. Increases in both insurance premiums and property taxes have heightened financial stress on homeowners and landlords. And, despite an abundance of new apartments, high rents have left more people than ever cost burdened, and have contributed to a sharp rise in homelessness. Meanwhile, unprecedented destruction from wildfires has further highlighted the growing threat to the housing stock from climate-related disasters. At the same time, federal housing support is lessening, creating uncertainty regarding the availability of crucial assistance programs. The looming possibility of an economic downturn is exacerbating the nation’s already-enormous housing challenges.”
Susan Collins President and CEO of the Federal Reserve of Boston opened the session with “Observations on Housing and the Economy: Remarks at ‘The State of the Nation’s Housing 2025’“. In this speech, Collins talked about the Fed’s “role “engagement” in housing issues. Beyond the familiar laundry list of data, I took note of anecdotes about the difficulties in supplying and obtaining housing in New England:
“I’ve learned firsthand how supply constraints, construction costs, zoning, access to credit, infrastructure, and affordability all play out in distinct ways to affect local housing markets and the people in them. For example, community leaders in Vermont recently noted that more than 20 sources of capital were needed to fund a housing development project that responded to community needs. That large number may sound surprising, but it was the only way to make that particular project feasible. Meanwhile, I recently learned about a community hospital in New Hampshire struggling to retain a new doctor they had hired because he was unable to find housing for his family. Such housing-related anecdotes are pervasive as I ask people about the challenges and opportunities in their local economy.”
I also took note of Collins’s acknowledgement that higher interest rates make it harder to fund new housing projects: “higher interest rates have slowed new residential investment. Less housing activity in turn has contributed to the more moderate overall demand we are currently experiencing. The modestly restrictive stance of monetary policy, while necessary, limits in the near term the expansion of housing supply needed to alleviate some of the pressures in the housing market.”
Spotlight on Mortgage Rates
The Mortgage Bankers Association (MBA) reported an even split of weekly increases and decreases in mortgage applications for the month of June. The 23-month streak of strong year-over-year performances in new home mortgage purchase applications came to an end in January with a 6% decrease, and continued their decline with another 6.9% decline in February. March delivered a fresh rebound with a 5.5% year-over-year increase in mortgage applications. April continued the fresh momentum with a 5.3% year-over-year increase in mortgage applications. May ended the momentum with a 4.5% year-over-year decline in mortgage applications to a three-month low.
In my last housing market report, I noted that “if not for the surrounding poor data, I would dare to anticipate a late pick-up in the spring buying season.” The decline in May mortgage applications validated the narrative of a poor spring housing market. The MBA referenced surging exiting home inventories as part of its explanation of May’s dip: “Economic uncertainty, rising mortgage rates, and increasing competition from growing existing-home sales inventory likely dampened overall demand for new home purchases in May.”
Mortgage rates trended ever so slightly lower during June. On-going economic uncertainties, particularly from the U.S.’s trade war, and a ballooning U.S. budget deficit continue to pressure long-term interest rates higher, but these rates trended lower most of June. Recent dovish commentary from various Fed officials have added hopes for imminent rate cuts and in turn lower mortgage rates (of course similar hopes were dashed when last year’s Fed rate cuts into a strong economy moved bond markets to send long-term yields higher).
![Freddie Mac, 30-Year Fixed Rate Mortgage Average in the United States [MORTGAGE30US], retrieved from FRED, Federal Reserve Bank of St. Louis; June 26, 2025](https://drduru.com/onetwentytwo/wp-content/uploads/2025/06/20250626_30-Year-Fixed-Rate-Mortgage-Average-in-the-United-States.png)
Be careful out there!
Full disclosure: long ITB
1 thought on “What Happened In the Housing Market – Spring Slipped Further”