

Housing Market Intro and Summary
What happened in the housing market in February, 2025? The bear market that scarred the landscape for builders returned. After January’s bear market, relief, the bear market is back and more deeply entrenched. The stocks and the housing data are even on the edge of a deeper malaise. On-going declines in affordability are at the center of the malaise. Radiating from there are rising inventories, stubbornly high prices, and plunging sentiment from consumers and builders. A small decline in mortgage rates providing little relief from the growing malaise in the housing market.
- Home builder stocks are teetering on the edge of fresh breakdowns that could deepen the malaise of bearish conditions.
- Home builder sentiment confirmed a peak with a sharp and ominous plunge, particularly in the component reflecting six-month expectations.
- Single-family housing starts declined and are likely to remain suppressed as absolute housing inventories continue a steady ascent.
- New single-family home sales dropped, extending a prolonged two-year trading range in sales.
- Existing home sales abruptly ended a promising rebound with a sharp decline, exposing further deterioration in market fundamentals. Pending home sales returned to all-time lows.
- California’s existing home market suffered acute setbacks, weighed down by the impact of devastating wildfires in Los Angeles.
- Mortgage rates drifted lower, pulling away from the 7% threshold.
Housing Stocks
In mid-January, the iShares US Home Construction ETF (ITB) jumped out of a bear market. A month later, ITB returned to a bear market and continued sliding slowly but surely. The February closing low, and low for the year, perfectly tested a triple bottom from 2024. Thus, ITB is on the edge of a deeper malaise if this support level fails to hold a fourth time. The housing data and earnings news from builders make me expect that this fourth time will NOT be a charm. This year’s seasonal trade on home builders is on track to be one of the worst since ITB started trading.
")
Home builders are performing so badly that each time I write about one I am downgrading the stock. Most recently, I wrote about the latest earnings report from Century Communities (CCS) in “Century Communities Offers Little Upside For Now (Rating Downgrade)“. CCS hit an all-time high last summer and delivered on a prediction I made a year ago. Now, CCS, is on the edge of testing a 14-month low set just last month. Like so many other builders, CCS is trading weakly given deteriorating results and prospects. I fully expect CCS to eventually to test the lows from October, 2023.
")
Housing Data
Home Builder Confidence: The Housing Market Index – February, 2025
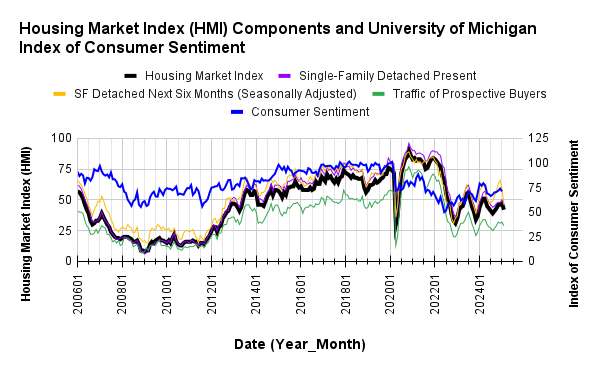
In January, the National Association of Home Builders (NAHB)/Wells Fargo Housing Market Index (HMI) managed to nudge higher by a point to 47 after spending two months at 46. The bottom fell out in February with a plunge of 5 points to 42. The NAHB blamed worries over tariffs as HMI collapsed to 38 when measured before the pause in tariffs against Canada and Mexico and fell just 3 points when measured after the pause. Regardless, February’s drop in HMI confirmed my expectations for a topping in HMI.
The HMI components have been part of the topping signal. Once divergent, they each now point downward. Most telling, the component “Single-Family: Next Six Months” sliced below the critical 50 threshold to 46, a crash of 13 points and a 14-month low (January’s reading was revised one point lower). This drop is a particularly bad sign for the spring selling season given the HMI fell 7 points in January. A 20-point drop in two months marks an abrupt and conclusive flip in sentiment from optimism to pessimism about the future. The HMI index for current sales conditions, “Single-Family: Present”, fell from the 50 threshold to 46. The HMI index “Traffic of Prospective Buyers”, already relatively low, slid from 32 to 29.
/Wells Fargo Housing Market Index (HMI) and the University of Michigan Index of Consumer Sentiment")
Source for data: NAHB and the University of Michigan
[Consumer sentiment data for February not available at the time of writing]
Builders finally implemented significant changes in pricing tactics. The pullback in incentives should be a sign of pricing power. Instead, the NAHB pointed to a reduction in eligible buyers due to high prices as the source of softening incentives. The 26% share of builders cutting prices is down from January’s 30%. The share of builders providing incentives decreased month-over-month from 61% to 59%. The average price discount was flat again at 5%.
Divergences in the regional HMIs also made me expect a topping out in the aggregate HMI. For February, each of the four regions dropped. As expected, the West fell at least partially driven by the devastating fires in Los Angeles. The Northeast fell from a 9-month high of 65 (adjusted downward) to 48, a 6-month low. This region was the last region to hold above the 50 threshold. The Midwest dropped by a point to 43. The South retreated by 5 points to 42. The West dropped 7 points to 35.
New Residential Construction (Single-Family Housing Starts) – January, 2025
Single-family housing starts slid below the 1M mark. The 993,000 starts were 8.4% below December’s 1,084,000 (revised up from 1,050,000) and down 1.8% year-over-year.
![US. Bureau of the Census, Privately Owned Housing Starts: 1-Unit Structures [HOUST1F], first retrieved from FRED, Federal Reserve Bank of St. Louis, February 19, 2025](https://drduru.com/onetwentytwo/wp-content/uploads/2025/02/20250219_Housing-starts-January-2025.png "Housing starts")
After a briefing flattening following the summer trough, building permits are turning upward ever so slightly. Permits are still down 3.4% from January’s high of 2024.
Sequential changes were negative across all regions except the West which surprisingly surged both sequentially and year-over-year. The year-over-year changes were quite divergent. The Northeast, Midwest, South, and West each changed -23.2%, +23.2%, -10.0%, and +12.0% respectively year-over-year. I previously thought the November starts augured poorly for the spring selling season, but December starts brought a sliver of hope. January’s weak starts reaffirmed my expectations for a subdued spring selling season.
New Residential Sales (Single-Family) – January, 2025
A wide range has developed for new residential single-family sales. Since, November 2022, new home sales have bounced between 595K and 741K. January marked a down tick in this cycle with sales dropping from 734K to 657K, a 10.5% sequential decline. Sales also fell 1.1% year-over-year. While spring sales may provide some relief, it seems clear that there are no catalysts on the horizon to break out to the upside. If anything, the risk is that spring disappoints and sales break below the current range.
![US. Bureau of the Census, New One Family Houses Sold: United States [HSN1F], first retrieved from FRED, Federal Reserve Bank of St. Louis, February 26, 2025](https://drduru.com/onetwentytwo/wp-content/uploads/2025/02/20250226_New-home-sales-January-2025.png "new home sales")
I noted last month December’s jump to a 4-month high threatened to end the recent downtrend in prices. Sure enough, for January, the median price for new homes soared by 7.5% above December’s level. January’s $446,300 median home price was the highest since July, 2024. Year-over-year the median price increased 3.7%, the highest such increase in a year. As with many of the prior swings, January’s surge was driven by a sharp change in sales mix.
For December, sales migrated to the $500,000 to $999,999 range. The book-ending tiers each lost share. In January, there was a sharp shift to the middle of the price curve with $400,00 to $599,999 collectively gaining 7 percentage points, and homes over $1M gaining a percentage point. All other price ranges dropped in share with homes in the $300,000 to $399,999 range dropping the most with a 5 percentage point loss. For context, sales of homes under $300,000 have been increasing in share for at least the last 3 years (I did not go back further). The affordability trend pushing a higher share of people, as a share of sales, into the cheapest single-family homes took a definitive pause in January. The year-over-year change in composition was quite mixed.
January’s inventory jumped from December’s 8.0 (revised downward) to 9.0 months of sales. For comparison, a year ago inventory sat at 8.3 months of sales. Absolute inventory continues to rise sharply after remaining flat for most of 2024. Absolute inventory was last this high 17+ years ago. Note that overall inventory, new plus existing homes, remains below historical norms at 4.2, a slight increase from the previous month’s 4.0. Last month, the NAHB pointed to limited existing home sales inventory helping to boost new home sales, but that dynamic did not play out in February. Inventory could be a key story in 2025 as the housing market teeters on its next slowdown in activity.
The regional year-over-year sales gains were mixed. The Northeast, Midwest, South, and the West changed +4.9%, -4.1%, -13.5%, and +57.0% respectively.
Existing Home Sales – January, 2025
In October, existing home sales jumped sharply off 14-year lows for the first year-over-year gain in over 3 years. January’s sharp sequential loss threatens to take existing home sales right back to those lows despite the kick-off of spring selling season. As I noted last month, the jump in December’s sales surprised me, so it is possible January is just a bit of “reversion”. Either way, while January existing home sales decreased 4.9% sequentially to 4.08M, sales increased year-over-year for the 4th straight month (2.0%).

(For historical data from 1999 to 2014, click here. For historical data from 2014 to 2018, click here) Source for chart: National Association of Realtors, Existing Home Sales© [EXHOSLUSM495S], retrieved from FRED, Federal Reserve Bank of St. Louis, February 27, 2025

Inventories increased along with the dip in sales. The NAR reported January inventory at 1.18M, a 3.5% increase month-over-month and up 16.8% year-over-year. According to the NAR, “Unsold inventory sits at a 3.5-month supply at the current sales pace, up from 3.2 months in December and 3.0 months in January 2024.” The months of supply and absolute inventory ended 3-month declines, and I expect the general trend to go up for this spring selling season.
Once again, the changes in inventories and sales did not stand in the way of a now relentless upward price trend. Yet again, it is telling that year-over-year pricing jumped despite the surge in year-over-year inventories. Last month, the NAR explained that a mix shift toward higher-end homes pushed the median price higher. They did not offer an explanation this time around and instead reiterated what is now a market truism: “…housing affordability remains a major challenge”. The median sales price of an existing home hit an all-time high at $426,900 in June. January’s median price declined 1.7% sequentially to $396,900 but increased 4.8% year-over-year. This 19th straight year-over-year increase represents the relentless march grinding away at affordability in the market.
The average time on the market for an existing home increased to 41 days in January, a surge from 35 days in December and 36 days a year ago. This increasing time on market also serves as a reminder of how underlying fundamentals of the existing home market continue to deteriorate.
The encouraging sign in December of a jump in first-time home buyers was wiped away by January’s decline. These sales dropped from a 31% share in December to 28% in January, flat with a year ago. The NAR’s 2017 Profile of Home Buyers and Sellers reported an average of 34% for 2017, 33% for 2018, 33% for 2019, 31% for 2020, 34% for 2021, 26% for 2022, 32% for 2023, and a plunge to an all-time low of 24% in 2024.
No region experienced a decline in year-over-year sales. The regional year-over-year changes were: Northeast +4.2%, Midwest +5.3%, South 0%, West +1.4%. I am surprised to see the West decline 7.4% sequentially given the surge in new home sales in the West for January. A more severe inventory constraint in the West could explain the sharp divergence.
Single-family existing home sales decreased by 5.2% from December to 3.68M in January and increased by 2.2% year-over-year. The median price of a single-family home was $402,000, up 5.0% year-over-year and declined 1.6% month-over-month.
California Existing Home Sales – January, 2025
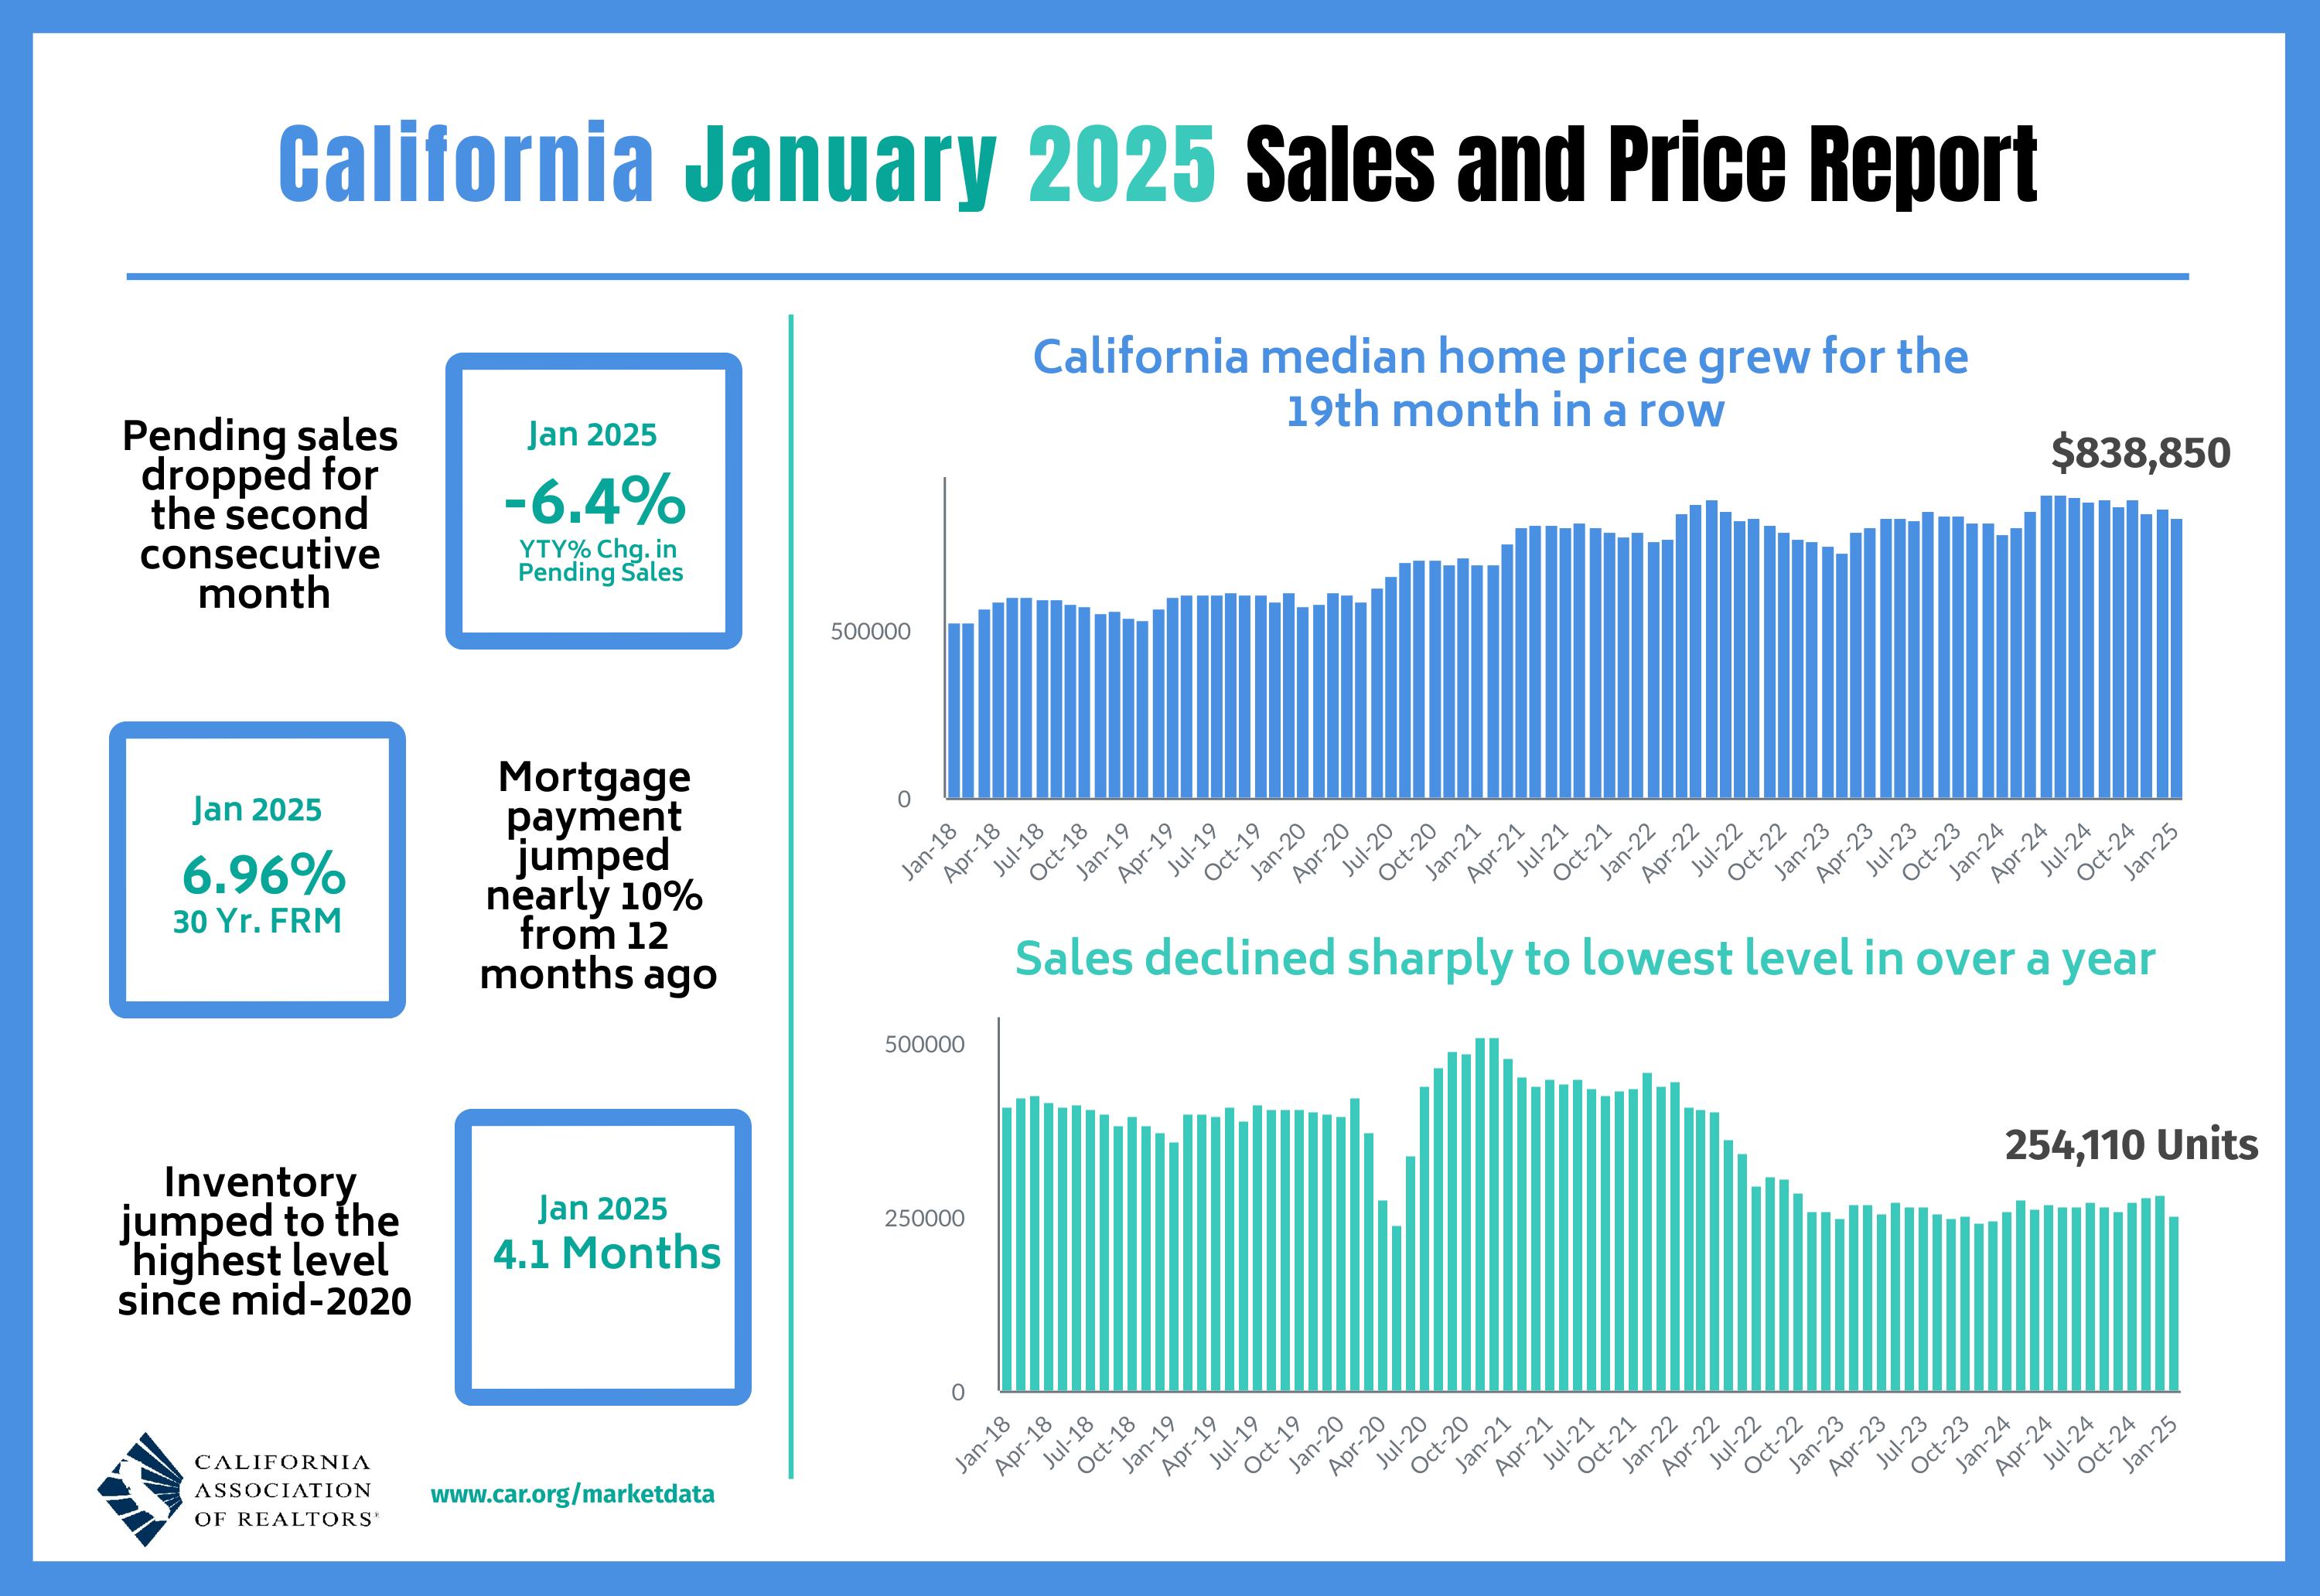
January’s tragic wildfires in Los Angeles weighed on the sales results in California. The California Association of Realtors (C.A.R.) provided the following pictures of the situation (emphasis mine):
“Closed sales in the six primary cities affected by the fires (Altadena, La Canada Flintridge, Malibu, Pasadena, Sierra Madre and Topanga) had dropped considerably from nearly 15 per week in the weeks ending January 4 and January 11, to just five over the last two weeks of the month. That represents a nearly 70 percent cumulative decline in weekly sales volume from the start of January. Winter is typically a slow time for the housing market in general, but this compares with sales that were up 2 percent cumulatively over the second half of January in the rest of the state (i.e., excluding Los Angeles County). With mortgage rates remaining elevated and the negative impact of the fires likely to have an effect in Southern California in the next few months, pending sales could remain soft in the first quarter of 2025.”
While sales levels in the impacted cities are a small fraction of state sales, it seems clear from the above data that the fires had a regional impact on market activity. Thus, California’s data is skewed by what appears to be a regional disruption that could last for months to come. In January, California’s existing home sales plunged 10.0% from December (the largest such decline in 30 months) and also declined 1.9% year-over-year to a 13-month low. While the median price also decreased from December by 2.6%, prices still marched higher year-over-year for the 19th month in a row (6.3%). The median price per square foot also increased 6.2%. The C.A.R. noted that “the acceleration in price growth is an indication that further price gain could still be observed in the coming months.” Thus, California’s housing market is both expensive and stagnant.
At the same time the market is stagnating, supply is rebounding. In December, active listings dipped for the first time in 12 months, but in January they surged to a 5-year high on the heels of the “fastest year-over-year growth in nearly four years”. The Unsold Inventory Index (UII) (the number of months needed to sell the supply of homes on the market at the current sales rate) surged from 2.7 in December to 4.1 in January. This level was also much higher than January, 2024 at 3.2 months. The C.A.R. explained that “…a surge in newly added properties at the start of the year…contributed to the jump in supply” in addition to the sales slowdown.
The median time on market also increased year-over-year from 32 to 35. Sales pressures also showed up in a slight drop in the C.A.R.’s statewide sales-price-to-list-price ratio from 98.9% a year ago to 98.6% this January.
Home closing thoughts
Record Low Pending Existing Home Sales
I rarely look at pending existing home sales. These numbers are supposed to provide a leading indicator of future sales, but I have never found it necessary for anticipating near-term sales. THIS month, I perked up after seeing a headline declaring a record low for pending existing home sales. Given my pessimism about existing home sales, I am not surprised by this drop back to the bottom. However, this momentum suggests that that the sudden drop in existing home sales may likely continue past recent lows.
Opening Federal Lands to Housing Development
Marketplace explored the possibilities of opening up Federal lands to housing development. The biggest issue is that the vast tracts of public lands in the wide open West are not practical for major housing development. So Mike Albertus, professor of political science at the University of Chicago, advocates for buying land in metropolitan areas the way Nevada has done in Clark County (where Las Vegas is located). Land for conservation and preservation is not part of the proposal, but this segment did not specify just how much additional housing could be provided on public lands or what timeframe would represent a reasonable timeline.
Spotlight on Mortgage Rates
The Mortgage Bankers Association (MBA) reported weekly increases in mortgage applications in the first half of February and decreases in the second half of the month. The strong year-over-year performances in new home mortgage purchase applications came to an end in January with a 6% decrease. The streak lasted for 23 months; as I mentioned before this strength surprised me given it did not translate into a strong uptrend for new home sales.
Mortgage rates seem to be topping out around 7%. Rates cooled off the 7% mark all month. However, the slow descent means borrowers should not expect significant relief in coming weeks or months. In fact, any sharp declines from here would likely be accompanied by the kind of economic weakness that is bad for housing markets.
![Freddie Mac, 30-Year Fixed Rate Mortgage Average in the United States [MORTGAGE30US], retrieved from FRED, Federal Reserve Bank of St. Louis; February 28, 2024](https://drduru.com/onetwentytwo/wp-content/uploads/2025/02/20250228_30-Year-Fixed-Rate-Mortgage-Average-in-the-United-States.png)
Be careful out there!
Full disclosure: long ITB shares