

Stock Market Commentary:
Mid-week, fresh drama in crypto looked like the next pivot point for the stock market. Instead, the bout of selling turned into a forgettable speedbump. Buyers returned with force in Bitcoin (BTC/USD), and the major stock indices recovered from major technical breakdowns and tests. In recent weeks, the stock market has bounced from one wall to another, from the floor to the ceiling. The frenetic trading has created churn that undermines commitment to any particular trading sentiment. The S&P 500 and the iShares Russell 2000 ETF are particularly noncommittal in their churn. The NASDAQ still retains a subtle downward bias. This enduring churn even looks ready to contain the coming changes in mood from earnings season and the Federal Reserve’s next statement on monetary policy.
Such a momentous market day on Friday deserves an explanation, but I did not see anything convincing. The week was full of Fedspeak with Christopher Wallace up to bat on Friday. The media highlighted his preference for a well-anticipated 25 basis points rate hike. Maybe the stock market loved the title “A Case for Cautious Optimism“. Wallace reminded the stock market that bad economic news is good for now: “The FOMC’s goal in raising interest rates is to dampen demand and economic activity to support further reductions in inflation. And there is ample evidence that this is exactly what is going on in the business sector.” The 5.7% surge and breakout in Alphabet, Inc (GOOG) after news that the company laid-off 12,000 workers is symbolic of Wall Street’s preferences in this part of the churn cycle.
The Stock Market Indices
The S&P 500 (SPY) gained 1.9% and recovered from a 50DMA (the red line below) breakdown. The index also confirmed support at its 20-day moving average (DMA) (the dotted line below) while at the same time closing right on top of 200DMA resistance. This swirl of technical breakdowns, support, and tests is a microcosm of the overall churn in the S&P 500. The chart below shows how the index has spent much of its time since last May trading between its May, 2021 low and the bear market line. Now, all three moving averages are converging in this range of churn and promise to tighten the trading action further.
")
The NASDAQ (COMPQ) soared 2.7% and recovered quickly from its previous 50DMA breakdown. The tech-laden index is back in position for a run to 200DMA resistance. Such a test is long overdue. The churn for the NASDAQ has submerged the trading action below the September, 2020 high.
Perhaps most importantly, the bottom of the NASDAQ’s churn is weakening ever so slightly. The NASDAQ broke its June low in October and November. It next marginally broke those lows in December. So the current recovery from the 50DMA breakdown forestalled the next sell-off to a new marginal low.
")
The iShares Russell 2000 ETF (IWM) has mainly bounced between its bear market line and the pre-pandemic high since last Spring. Yet, this churn for IWM is subtly turning into a pivot around its 200DMA. The ETF of small cap stocks rebounded perfectly off 200DMA support with a 1.7% gain. This test was also close enough to a successful 50DMA test. Accordingly, IWM is in a bullish position. I bought a calendar call spread to target a small profit from a short-term return to overhead resistance from the peaks since November.
")
Stock Market Volatility
The volatility index (VIX) provides at least two interpretations of churn. The VIX has broken the 20 level twice since December only to bounce back and revive a bearish tint to the stock market. The VIX’s declining 50DMA has kept the churn well-contained and provided plenty of fresh hope for bulls. At some point in the next month or two some kind of major resolution of this bear/bull churn should emerge.
")
The Short-Term Trading Call With Churn
- AT50 (MMFI) = 67.7% of stocks are trading above their respective 50-day moving averages
- AT200 (MMTH) = 52.3% of stocks are trading above their respective 200-day moving averages
- Short-term Trading Call: neutral
AT50 (MMFI), the percentage of stocks trading above their respective 50DMAs, jumped to 67.7% and stretched for overbought trading conditions. I am surprised the week-ending bullish activity did not earn overbought credentials.
The churn in AT50 took me from cautiously bearish to neutral and almost back to cautiously bearish. Technically, Thursday’s follow-through selling to 60.1% triggered a fresh bearish call. However, I barely had time to form new bearish thoughts before my favorite technical indicator bounced back. Moreover, the major indices recovered from breakdowns, and the IWM is even bullish. Thus, the churn keeps me stuck here at neutral. I am more inclined to stay neutral until some major change happens in the technicals to shake the stock market out of its key ranges.
For now, the momentum favors the bulls. SwingTradeBot’s market summary for Friday shows a confluence of bullish signals. In particular, there was a surge of bullish morning star candlesticks which indicate bottoms in price action after an extended phase of selling.
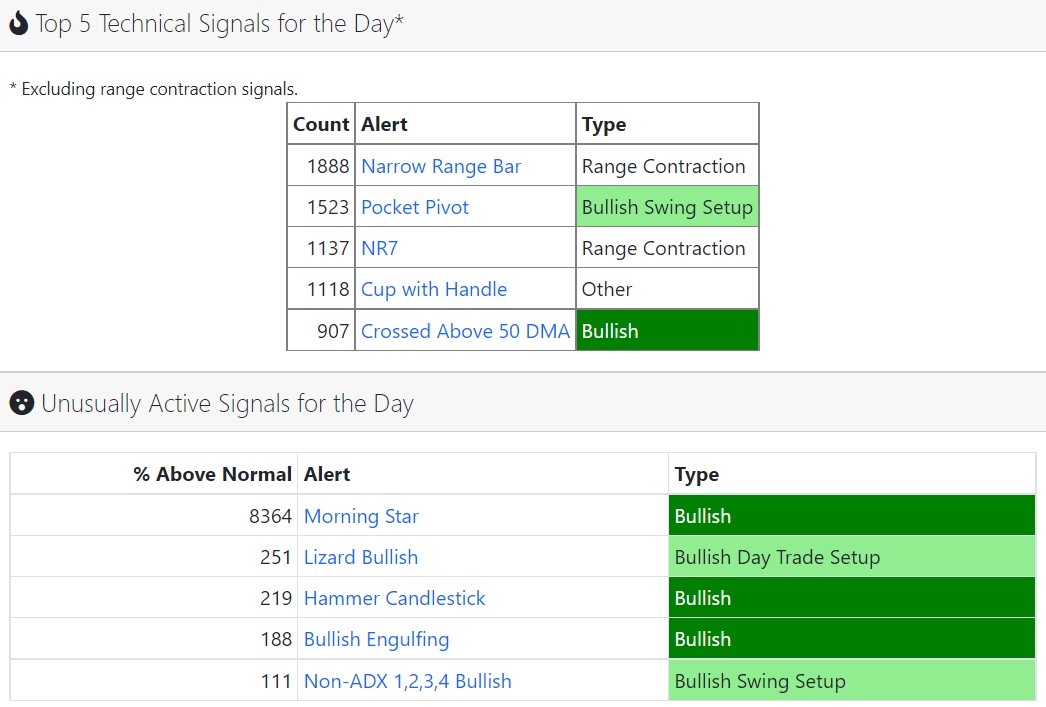
")
")
Footnotes
“Above the 50” (AT50) uses the percentage of stocks trading above their respective 50-day moving averages (DMAs) to measure breadth in the stock market. Breadth defines the distribution of participation in a rally or sell-off. As a result, AT50 identifies extremes in market sentiment that are likely to reverse. Above the 50 is my alternative name for “MMFI” which is a symbol TradingView.com and other chart vendors use for this breadth indicator. Learn more about AT50 on my Market Breadth Resource Page. AT200, or MMTH, measures the percentage of stocks trading above their respective 200DMAs.
Active AT50 (MMFI) periods: Day #67 over 20%, Day #63 over 30%, Day #12 over 40%, Day #10 over 50%, Day #7 over 60% (overperiod), Day #3 under 70% (underperiod)
Source for charts unless otherwise noted: TradingView.com
Full disclosure: long QQQ put spread, long IWM calendar call spread
FOLLOW Dr. Duru’s commentary on financial markets via StockTwits, Twitter, and even Instagram!
*Charting notes: Stock prices are not adjusted for dividends. Candlestick charts use hollow bodies: open candles indicate a close higher than the open, filled candles indicate an open higher than the close.