
Stock Market Commentary:
The latest bear market bounce was an even closer call than the last one. This time around, Apple Inc (AAPL) failed to lead the S&P 500 away from the brink. AAPL closed below its October, 2021 low the previous day and warned technicians that the stock’s leadership was failing. So when AAPL dropped further to prices last seen June, 2021, the S&P 500 pierced through its bear market line. This line defines a 20% loss from the all-time high set just in January. The algorithms, human and robotic, were late, but they answered the call with no time to spare. After the dust settled on the week, buyers purchased a reluctant S&P 500 out of the bear market zone. This latest technical test was not picture-perfect, but it got the job done. However, if sellers press the bear market case again, I fully expect the algorithms to step aside and watch the carnage.
The Stock Market Indices
The S&P 500 (SPY) was down 2.3% at its intraday lows in bear market territory. The latest bear market bounce brought the index back in line with recent lows, including the previous day’s close. I bought back into SPY shares in the selling. Like the last tranche, this position is a bet on the next bounce from or out of oversold conditions. Since the VIX did not spike to new highs, I did not get more aggressive.
The NASDAQ (COMPQX) does not have the benefit of obvious support until the September and October, 2020 lows. The latest bear market bounce saved the tech-laden index from a test of the psychologically important 11,000 level.
The iShares Russell 2000 ETF (IWM) stopped just short of testing its 2022 closing low. The latest bear market bounce pulled the ETF of small cap stocks from a 2.7% loss to a relief 0.3% loss. Overhead resistance from the downtrending 20DMA is rapidly descending upon the trading action.
Stock Market Volatility
The volatility index (VIX) continues to surprise me with its relative reluctance to reflect the weakening price action in the stock market. The latest bear market bounce faded the VIX far short of testing recent highs. Until proven otherwise, I will assume the VIX’s sluggishness is a (cautiously) bullish sign…until proven guilty.
The Short-Term Trading Call With the Latest Bear Market Bounce
- AT50 (MMFI) = 17.4% of stocks are trading above their respective 50-day moving averages (oversold day #3)
- AT200 (MMTH) = 21.5% of stocks are trading above their respective 200-day moving averages
- Short-term Trading Call: cautiously bullish
AT50 (MMFI), the percentage of stocks trading above their respective 50DMAs, dropped to 17.4%. Just three days ago, the important and promising breakout of the S&P 500 drove my favorite technical indicator right to its current downtrend line. At the time, I was hopeful the downtrend would give way. Instead, sellers confirmed resistance even for AT50. This third oversold day is now really part of a larger oversold story of 9 of the last 10 days trading in oversold territory. This overdue visit to extended oversold trading is true bear market action even if the S&P 500 keeps skirting the official bear market label.
Since the VIX never surged past its recent highs, I did little trading. As I mentioned earlier, I did buy SPY shares. As the S&P 500 approached the bear market line, I wanted to have a bet in place on the high likelihood of positive returns on the first day the oversold period ends…almost however long it takes.
 after an oversold period ends.")
Doubting the Latest Bear Market Bounce
Bear market narratives are now easy to find with all the negative momentum hitting us in the face. One of the more concerning analyses I have seen came from Bank of America, courtesy of Seeking Alpha. BoA made a bearish case for S&P 500 3600 which is just above the index’s important September, 2020 high. Yet, more interesting, and alarming, to me is the following chart showing the extreme financialization of the economy:
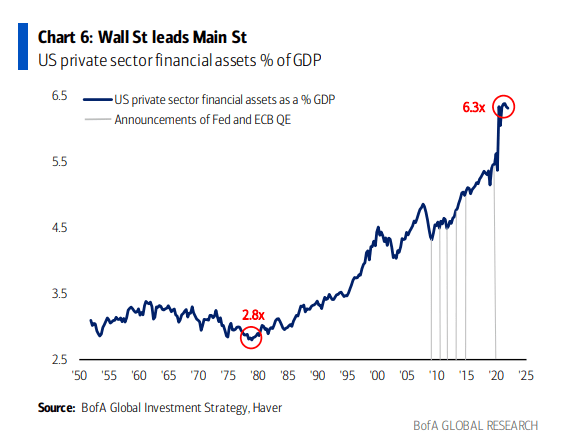
The Federal Reserve’s precarious mission to normalize monetary policy against an inflationary economy looks even more brittle with the above chart as context. If a reversion to the mean occurs, the U.S. private sector financial assets percentage of GDP will effectively reverse all the gains from the pandemic. This process seems to be underway with so much of the speculative, high-risk parts of the market already wiping out most, if not all, their pandemic era gains. Will AAPL be the last holdout?
Be careful out there!
Footnotes
“Above the 50” (AT50) uses the percentage of stocks trading above their respective 50-day moving averages (DMAs) to measure breadth in the stock market. Breadth defines the distribution of participation in a rally or sell-off. As a result, AT50 identifies extremes in market sentiment that are likely to reverse. Above the 50 is my alternative name for “MMFI” which is a symbol TradingView.com and other chart vendors use for this breadth indicator. Learn more about AT50 on my Market Breadth Resource Page. AT200, or MMTH, measures the percentage of stocks trading above their respective 200DMAs.
Active AT50 (MMFI) periods: Day #3 under 20% (third day oversold), Day #12 under 30%, Day #21 under 40%, Day #32 under 50%, Day #37 under 60%, Day #308 under 70%
Source for charts unless otherwise noted: TradingView.com
Full disclosure: long SPY shares and call calendar spread, long QQQ calls
FOLLOW Dr. Duru’s commentary on financial markets via StockTwits, Twitter, and even Instagram!
*Charting notes: Stock prices are not adjusted for dividends. Candlestick charts use hollow bodies: open candles indicate a close higher than the open, filled candles indicate an open higher than the close.