
The Relationship
At its height last March, the U.S. Global Jets ETF (JETS) still could not close all its pandemic-driven losses. JETS was a 5.9% gain from finally returning to where it last traded at its 200-day moving average (DMA) (the blue line in the stock chart below). Similarly, the number of travelers at U.S. airports as measured by security screenings from the U.S. Transportation Security Administration (TSA) stopped short of its pre-pandemic levels from the same late March date in 2019. Throughput needed to gain another 58.9% to fill the gap. In between, the trends of throughput vs JETS have maintained a surprisingly consistent relationship. Indeed, the daily correlation between the two sits at a relatively high 0.68.
Correlation runs on a scale from -1 to 1 where 1 is a perfectly linear relationship and -1 is an exactly inverse linear relationship. At zero there is absolutely no relationship between the two quantities. The chart below gives a visual representation of this close relationship. The vertical axes are in log scale to make the trends clearer. The left axis measures traveler throughput. The right axis measures the price per share for JETS. The horizontal axis is the date series of available TSA data. The black line shows throughput for the dates shown on the horizontal axis. The yellow line shows the throughput for the prior year. For example, the initial plunge in throughput from the pandemic is shown on the right hand side of the chart because the collapse happened a year ago. The red line represents the stock price for JETS.
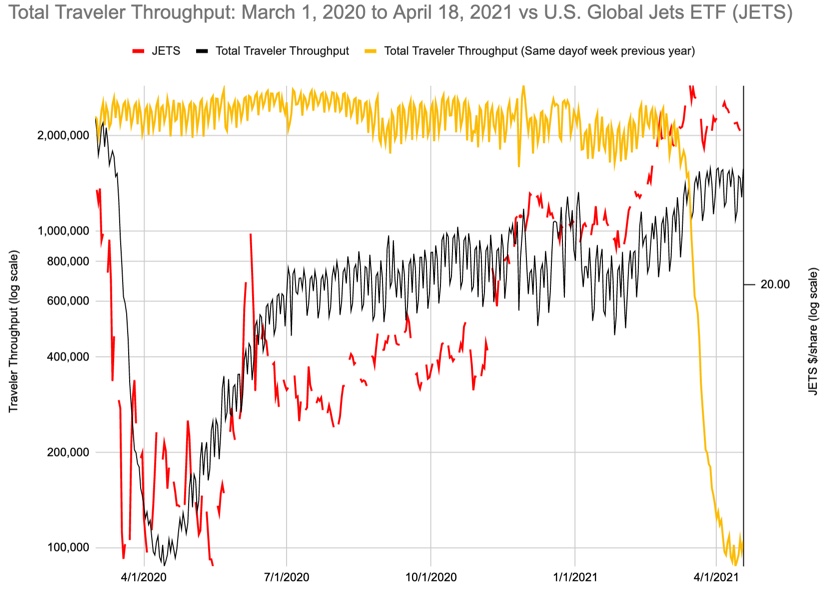
There are just two periods in the above time series where the relationship (correlation) between throughput and JETS broke down notably but temporarily.
- JETS made a new all-time low in May even as throughput was in a sharp recovery mode. The throughput became a leading indicator.
- JETS corrected sharply from a parabolic run-up in June even as throughput continued higher for another month. Again, the throughput became a lead indicator both in suggesting the parabolic run-up could not last and that the correction would bottom out well above the May lows.
In other words, when trading JETS, check the TSA’s traveler throughput. If the two trends agree, trade JETS with the trend. Currently, the correlation is breaking down thanks to the UAL-inspired pullback. With throughput remaining stable, I expect JETS to bottom out well above the last low during the January, 2021 consolidation around $22. The uptrending 200DMA is quickly rising to meet that $22 level. (All these data and charts are stored in a Google sheet).
United Airlines Put the Cherry On the Top
JETS and traveler throughput were stabilizing together from March to April until United Airlines (UAL) stunk up the joint with its poor post-earnings response. UAL fell 8.5% post-earnings, and the drop took down airline stocks across the industry. The move was enough to send the airline ETF U.S. Global Jets ETF (JETS) to a 4.1% loss and a two-month closing low. UAL suffered a breakdown below its 50-day moving average (DMA). JETS confirmed a 50DMA breakdown with a second close below that important trend line. The 50DMA breakdowns confirmed the earlier topping action.
UAL’s drop happened despite what appeared to be on-going optimism from the airline. From the Seeking Alpha transcript of the earnings conference call:
“We’re also pleased to confirm last week that our core cash flow for the month of March was positive and we continue to expect positive core cash flow moving forward. This confirms the view that we first shared in October 2020 that we could see the light at the end of the tunnel. We’re more confident than ever in the recovery and in the long-term earnings power of United Airlines. Even with business and long haul international demand is still off by 80 plus percent. We can now squarely focus on returning to positive adjusted EBITDA as our next milestone. In fact, we now see a clear path to reaching that milestone, even with business and long haul down as much as 70%.
In addition, we expect to return to positive net income once business and long haul international recover to down 35%. And as we’ve maintained from the beginning of the crisis, we’re increasingly confident that both business and long haul will eventually recover fully. When that recovery begin, no airline is better positioned to capitalize on it than United, which is why we’re so confident about returning to profitability and ultimately exceeding 2019 adjusted EBITDA margins in 2023.”
Granted, the soaring optimism from United Airlines focuses on a world still two years out. At least the run on the debt markets is likely over (emphasis mine): “…last week, we announced a new debt offering using our slots, gates and routes as collateral with proceeds to be used to exit the CARES loan. And we expect that this will be our last COVID crisis related debt [raise].” In other words, I still want to buy dips in UAL and JETS in general. A test of 200DMA support would make an ideal dip. A quick return to trading above the 50DMA would surprise me since I just downgraded to neutral on the stock market.
Be careful out there!
Full disclosure: no positions
I think UAL’s optimism is misplaced for two reasons:
1) It completely ignores that sales executives have found virtual travel to be vastly more cost-efficient and productive than in-person visits
2) Air travel is one of the biggest contributors to climate change, both emitting carbon in general and specifically the effects of jet exhaust on the stratosphere. This fact has flown under regulators’ radar to date (pun intended) but activists will force them to address it soon. There is a data-oriented discussion of the situation here:
https://ourworldindata.org/co2-emissions-from-aviation
Yikes. Well since they are looking at 2023, there is time yet for the thesis to get upended. In the meantime, I think the traveler throughput trends will be even more telling as a trading signal. I hope the TSA permanently publishes the numbers.