
AT40 = 53.3% of stocks are trading above their respective 40-day moving averages (DMAs)
AT200 = 58.8% of stocks are trading above their respective 200DMAs
VIX = 13.7
Short-term Trading Call: bearish
Stock Market Commentary
It just got tougher to stick to my recent bearish short-term trading call on the stock market.
On Friday, news went out that the Trump administration is considering tax incentives to encourage households to buy stocks and bonds. From CNBC:
“The proposal, one of many new tax cuts under consideration, would see a portion of household income treated as tax-free for the purposes of investing outside a traditional 401(k). Under one hypothetical scenario described by multiple officials, a household earning up to $200,000 could invest $10,000 of that income on a tax-free basis, although officials noted these numbers are fluid.”
The stock market is already greedily feeding off a convergence of passive fund inflows, nearly incessant central bank liquidity, and tax incentives encouraging companies to buy back stock. An additional tax incentive on the demand side is akin to throwing accelerant on a cozy camp fire. This proposal reminded me of the centrality of the stock market to today’s economic narrative. Truly under such conditions, bearishness must remain a fleeting fancy. The administration floated a love note to the stock market for Valentine’s Day, and the signal is clear: the stock market will get the support it needs for the foreseeable future.
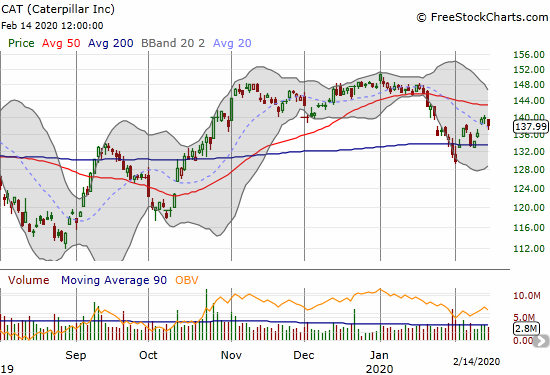
The current love affair with the stock market is so enduring that one would be hard pressed to see in the price action any concern for anything. My instincts tell me the market’s pricing mechanism is broken. The lover in me wants to say the market is just showing an admirable ability to stay focused on the future no matter how far away that future lies. Whatever the reality, I have found little reason to trade on my bearishness, especially given Caterpillar (CAT) bounced off its 200-day moving average (DMA) in picture-perfect form (see below). The most bearish thing I am currently doing is to steadily take profits on longer-term holdings.
The S&P 500 (SPY) is up 4.6% year-to-date. Over this time, AT40 (T2108), the percentage of stocks trading above their respective 40DMAs, fell from 66.2% to 53.3%, including a 1-day stop at overbought and a plunge as low as 38.2%. A good amount of stocks are getting left behind in the latest rally. While I will stick to the bearish thesis for at least another few weeks, I think it makes sense to consider some pair trades while I wait for a good bearish entry. For example, I still like buying call options on IWM while I rotate through puts on SPY and QQQ.
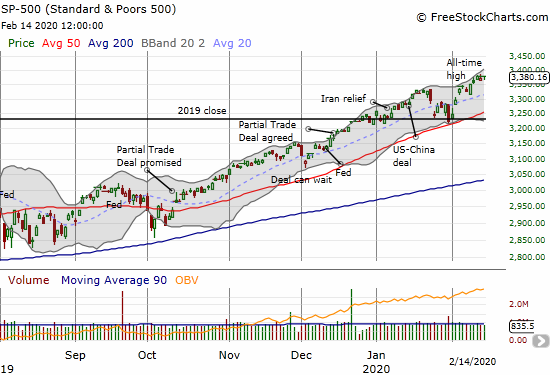
The deviation or dichotomy in the S&P 500 unfolded in a different way last week. The Invesco S&P 500 Low Volatility ETF (SPLV) jumped 0.6% on Friday to end the week with a 2.3% gain. The Invesco S&P 500 High Beta ETF (SPHB) lost 0.5% of Friday but still managed to gain 2.3% on the week. Since the S&P 500 gained 1.6%, a large swatch of “middle” stocks failed to get love notes and significantly lagged last week. This has the look of a rotation. I will watch this coming week to see whether SPHB re-challenges my bearish thesis.
Volatility
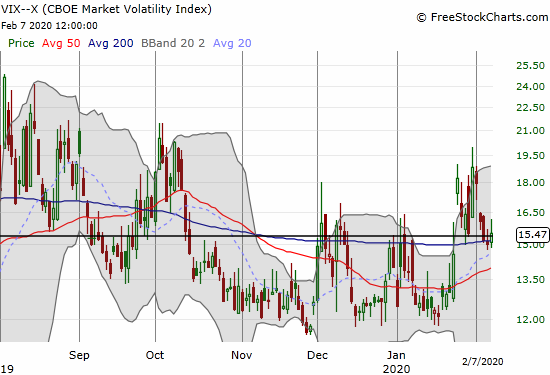
The volatility index (VIX) looks ready to retest the 12 level and thus put further pressure on my bearish thesis. The last cycle of fear ended with a breakdown below the 15.35 pivot. The VIX is close to a full reversal of the spike from January 24th that launched the last (brief) fear cycle.
The Short-Term Trading Call
As I indicated above, I have yet to see a good set-up for bearish trades. I am nibbling to make sure I have put options in play in case the expected downdraft happens suddenly and without further warning. Otherwise, my new bear/bull line is 3332 on the S&P 500 (332 on SPY). I will aggressively trade on the bearish short-term trading call below that line.
Stock Chart Reviews – Below the 50DMA
Caterpillar (CAT)
I expected Caterpillar (CAT) to open the week following through on a crack through its 200DMA support. Instead, CAT mildly bounced and then sprinted for two days. On Friday’s 1.2% loss, I nibbled on a fresh put option. As I have noted before, I cannot get excited about my bearish case as long as CAT is holding 200DMA support.
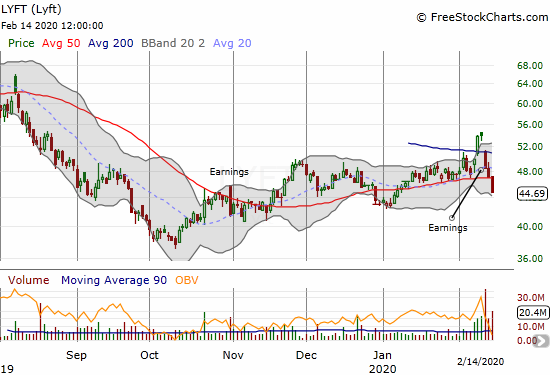
Lyft (LYFT)
Lyft (LYFT) disappointed investors with its earnings last week. The breakout ahead of earnings was an ideal setup for a letdown. Friday’s 5.0% loss and 50DMA breakdown convincingly put an end to the rally. I took this opportunity to begin rolling back into the stock. I started by selling short a March $45 put.
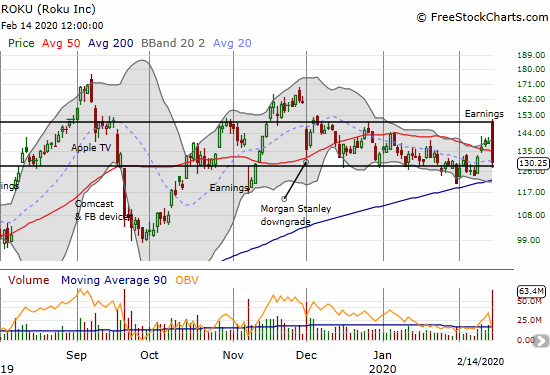
Roku (ROKU)
Investors and traders clearly do not know what to make of Roku (ROKU). This volatile stock has somehow managed to stay mostly within the band I drew months ago. Friday’s post-earnings response took the stock from the euphoria of opening at the top of this band to the deflation of closing at the bottom of the band. I am still waiting for a clear break one way or the other before placing any further trades. The uptrending 200DMA may soon force the issue…a bearish breakdown below support or enough of a bounce off support to breakout above the band.
Stock Chart Reviews – Above the 50DMA
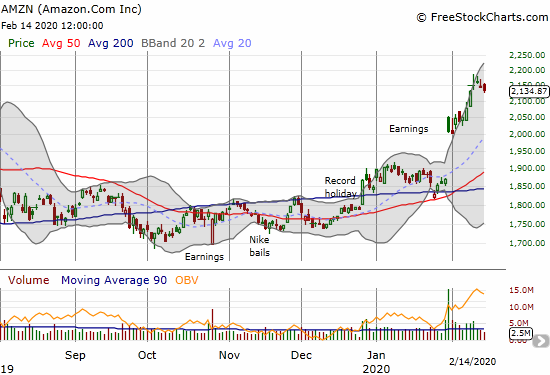
Amazon.com (AMZN)
Amazon.com (AMZN) printed an evening star on Tuesday that I interpreted as a signal confirming bearishness. AMZN only confirmed that topping pattern with Friday’s 0.7% loss. I jumped into a weekly Friday put option that failed, and a 2100/2080 put spread that expires on February 28th.
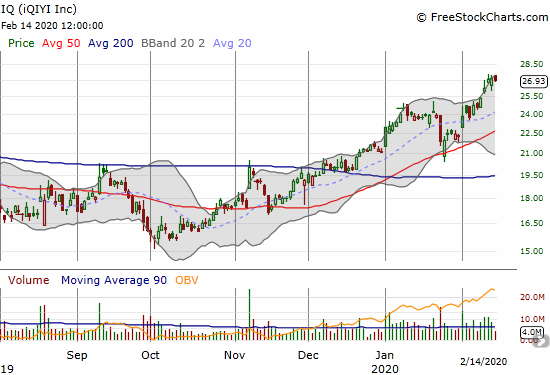
iQIYI (IQ)
iQIYI (IQ), the “Netflix of China,” has printed an impressive comeback since stretching toward its all-time low in October. Last month’s bounceback from a 50DMA breakdown was a key short-term buying opportunity for traders. I accumulated the stock over many months. I used last week’s stall to finally take profits. IQ is just below its 2019 highs, and I am content to stay on the sidelines to watch the drama unfold.
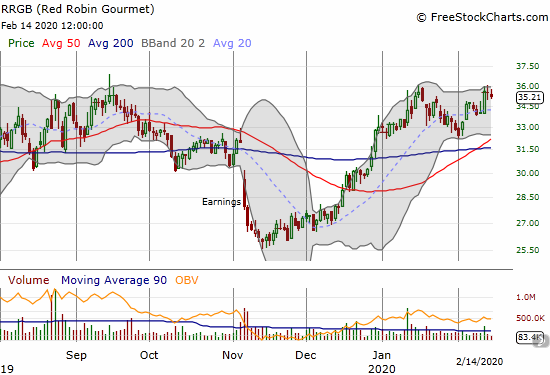
Red Robin Gourmet (RRGB)
With my bearishness, Red Robin Gourmet (RRGB) is another profitable stock I prefer to close out. I rode out a lot of churn that makes my position look poor on a risk-adjusted basis. I essentially got tired of waiting for a resolution of last June’s reported take-out offer. I was tempted to sell call options against my position, but the premiums were too low. If premiums remain low when I am ready to buy back into RRGB, I will likely reach for call options instead of shares.
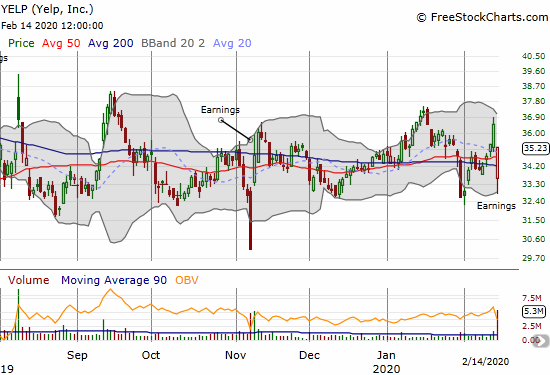
Yelp (YELP)
I am still waiting for an entry point on Yelp (YELP). Incredibly, the stock has churned in a trading range for 15 months. I am thinking it is time to buy a covered call position and see whether I can turn YELP in a periodic income generator as it remains locked in a trading range.
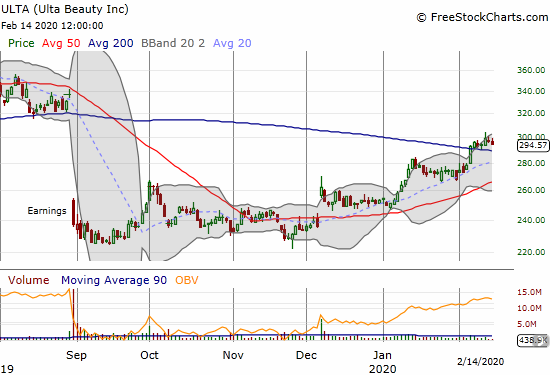
Ulta Beauty (ULTA)
Even while bearish, I cannot resist a 200DMA breakout. Last week I bought a calendar call spread at the $300 strike with the short side expiring last Friday. If the market remains stubbornly resilient, I am looking for ULTA to drift toward $305 in short order.
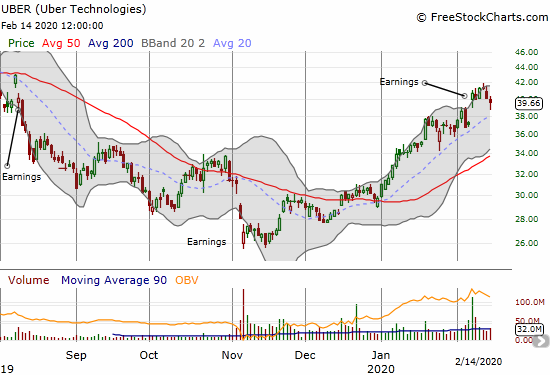
Uber Technologies (UBER)
Uber Technologies (UBER) is suddenly faring better than LYFT. UBER managed a post-earnings gain (that likely motivated traders to rush into LYFT ahead of LYFT’s earnings). Yet, UBER quickly stalled out right at its $42 IPO price. I am looking to go short UBER with a tight stop just above $42. I realize the trade looks “too obvious,” but it makes technical sense.
— – —
FOLLOW Dr. Duru’s commentary on financial markets via email, StockTwits, Twitter, and even Instagram!
“Above the 40” uses the percentage of stocks trading above their respective 40-day moving averages (DMAs) to assess the technical health of the stock market and to identify extremes in market sentiment that are likely to reverse. Abbreviated as AT40, Above the 40 is an alternative label for “T2108” which was created by Worden. Learn more about T2108 on my T2108 Resource Page. AT200, or T2107, measures the percentage of stocks trading above their respective 200DMAs.
Active AT40 (T2108) periods: Day #269 over 20%, Day #108 over 30%, Day #10 over 40%, Day #4 over 50% (overperiod), Day #16 under 60% (underperiod), Day #20 under 70%
Daily AT40 (T2108)
")
Black line: AT40 (T2108) (% measured on the right)
Red line: Overbought threshold (70%); Blue line: Oversold threshold (20%)
Weekly AT40 (T2108)

*All charts created using FreeStockCharts unless otherwise stated
The T2108 charts above are my LATEST updates independent of the date of this given AT40 post. For my latest AT40 post click here.
Be careful out there!
Full disclosure: long VIXY calls, long CAT puts, long QQQ puts, long ULTA calls, short LYFT put, long AMZN put spread
*Charting notes: FreeStockCharts stock prices are not adjusted for dividends. TradingView.com charts for currencies use Tokyo time as the start of the forex trading day. FreeStockCharts currency charts are based on Eastern U.S. time to define the trading day.