
Overall Assessment
I am neutral on M/I Homes (MHO) which means I am content to stay on the sidelines until a fresh catalyst pushes me off the fence.
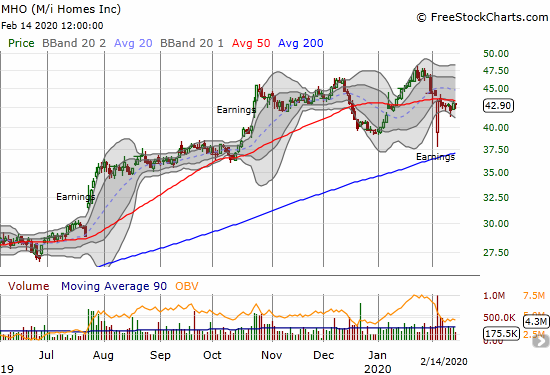
The Q4 earnings report for M/I Homes was relatively straightforward. So I am at a loss to explain why the stock gapped down as much as it did after earnings. The near flat post-earnings close makes more sense. Overall, MHO looks like a builder that will deliver good but not great performance this year.
This earnings review is my second review of the company. MHO caught my attention in late July 2019, when the stock experienced a major post-earnings breakout. With a widening breakout among select homebuilders two weeks prior, I decided it was finally time for me to get more familiar with M/I Homes. M/I Homes (MHO) is a mature builder that has settled into a tight range on margins. The investment thesis for M/I Homes has to be all about sales and revenue growth that falls straight to the bottom-line. MHO is attractive with a low valuation, but I also do not see how the reliance on affordable homes can drive financial performance even better than 2019. Comparables will also be very difficult going later into 2020.
MHO does not provide forward-looking guidance, so the company is prone to major surprises both to the upside and downside. The results from Q4 tell me not to expect any upside surprises: margins are locked in and revenue growth is constrained by the dynamics of the affordably-priced part of the market. In other words, MHO is only a buy on a price discount (a fundamental reason) and/or after the stock closes its post-earnings gap and starts higher (a technical reason).
Stock Performance
- One day after reporting Q4 2019 earnings: -1.8%
- Since the close after Q4 2018 earnings: +45.8%
- Since the close after Q4 2019 earnings: -1.0%
- For the year until the close before earnings: +12.1%; compare to +9.9% for the iShares Dow Jones US Home Construction ETF (ITB)
Valuation (from Yahoo Finance)
- 12-month trailing P/E: 9.6
- 12-month forward P/E: 7.9
- Price/book: 1.2
- Price/sales: 0.5
- Short % of float: 4.5% (an increase from 1.9%, August 11, 2019)
Year-Over-Year Performance (3 months ended December 31, 2019 and quarter-ending values)
- Total revenue: +3% (record 4th quarter)
- Home deliveries: +5% (quarterly record)
- New contracts: +42% (record 4th quarter)
- Average selling price: -1.6%
- Operating income: +12.5%
- Adjusted gross margin: from 19.8% to 19.9%
- Gross margin: +9.8%
- Net income per diluted share: +25.2%
- Ending backlog value: +18% (record 4th quarter)
- Cash and cash equivalents: -71.7%
- Ratio of net debt to capital: from 44% to 38%
Year-Over-Year Performance (12 months ended December 31, 2019)
- Total revenue: +9.3%
- Home deliveries: +9.0%
- New contracts: +15.9%
- Average selling price: 0%
- Operating income: +14.7%
- Adjusted gross margin: from 19.9% to 19.8%
- Gross margin: +10.3%
- Net income per diluted share: +21.1%
- $600M spent on on land purchases and land development, 44% on raw land.
Year-Over-Year Guidance and targets
- Average community count: +5% from 2019
- $650-700M spending on land purchase and development
Highlights from the Earnings Call
General Guidance
- Margins will be at least at current levels and no worse.
- Average sales price will be down 2-3% (but it is hard to predict)
- Smart Series homes could go over 30-35% of sales in the next 12 to 18 months
Market Conditions and Characteristics of Demand
- Smart Series houses (the most affordable offering) will be in over 25% of communities versus 10% a year ago, 25% of sales.
- Traffic up 19%
- 49% of sales were first time buyers versus 46% in Q3
- 44% of sales were inventory homes versus 47% in Q3.
- Selling season started earlier this year (before the Super Bowl)
Regional highlights
- Columbus, Ohio is one of the company’s strongest markets.
Inventory
- Control about 5 years of land
Margins and Costs
- “Minimal” change in construction costs
- MHO is a 20-21% gross margin business
- Finished lot cost is up just around $1000 over previous year
Pricing Power
- “…we have a little bit of pricing power, not a lot, and it’s market dependent and location dependent.”
- Hard to get operational efficiencies with a declining average sales price
- Discounting is not a big issue
Earnings sources
- 2019 4th quarter results: February 5, 2020
- 2019 3rd quarter results: October 23, 2019
- 2019 1st quarter results: April 24, 2019
- 2018 4th quarter results: February 5, 2019
- Seeking Alpha Transcripts: M/I Homes, Inc. (MHO) CEO Bob Schottenstein on Q4 2019 Results – Earnings Call Transcript
Be careful out there!
Full disclosure: long ITB calendar call spread and ITB calls