
Housing Market Intro/Summary
{This post marks the last one impacted by the previous U.S. government shutdown. I delayed publishing until I gathered a complete set of January’s housing market data. At the time of writing February’s data are rolling in}.
In the January Housing Market Review, I described a pause in the bad housing data long enough to allow the stocks of home builders to rally sharply with the stock market. The iShares US Home Construction ETF (ITB) was testing resistance at its 200-day moving average (DMA); that moment turned out to be beginning of the latest peak in the index. The index suffered a 50DMA breakdown that confirmed the overhead resistance from its 200DMA. A deeply dovish statement on monetary policy from the Federal Reserve brought in buyers to rally ITB off its lows, but it still closed in the red.
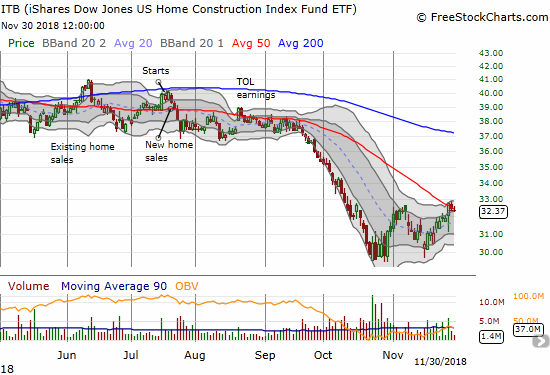
Source: FreeStockCharts.com
This breakdown brings at least a technical end to the seasonal trade in home builders. I will discuss trade positioning further in the next Housing Market Review (in just another 2 weeks or so). Needless to say, all the individual stock stories I reference earlier suffered breakdowns or otherwise worsened.
New Residential Construction (Single-Family Housing Starts) – January, 2019
From July to October, housing starts seemed to stabilize after a period of decline. Plunges in November and December confirmed that housing starts topped out. However, a January surge suggests that the decline in starts may already be ending as well.
Single-family housing starts for December were revised downward from 758,000 to 740,000. January starts catapulted month-over-month by 25.1% to 926,000. On an annual basis, single-family housing starts increased by 4.5%, the first year-over-year increase since September, 2018. The recovery in starts comes on the heels of a decline that was steep enough to cause grave concerns about the health of the housing market. The earlier decline was the worst drop since starts were regularly dropping double-digit percentages in 2011. Now, it seems some form of stabilization is possible, especially with lower mortgage rates providing more hope to buyers and market participants.
June’s year-over-year decline was the first for housing starts since August, 2016, and June’s level sat as the lowest of the year until the October to December plunge. The market has transitioned from a slow motion breakdown to a break neck breakdown to now a significant rebound.
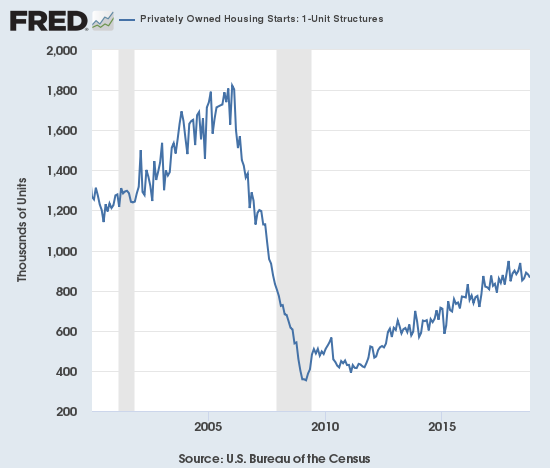
Source: US. Bureau of the Census, Privately Owned Housing Starts: 1-Unit Structures [HOUST1F], retrieved from FRED, Federal Reserve Bank of St. Louis, March 17, 2019.
When overall housing starts plunged in November, three of the four regions experienced sharp declines led by the West. For December, the West and Midwest were the two declining regions both with exceptionally large changes. The wide range in regional changes in January suggests that January’s surge is not likely sustainable. The on-going decline in the West is particularly concerning. The Northeast, Midwest, South, and West each changed 33.9%, -10.7%, 9.9%, and -6.6% respectively.
The bump up in last July’s housing starts was less impressive than it appeared given it was mainly driven by the Midwest. For August, only a second month of gains for the West prevented housing starts from looking worse. In September, the regions delivered solid performances outside of the Northeast. The West out-performed for two months with double-digit year-over-year gains and helped prevent the overall starts numbers from looking worse. The West has now become the market’s leading red/yellow flag.
Existing Home Sales – January, 2019
The losing streak for existing home sales continued in January. Monthly sales changes are trending downward and the streak of year-over-year declines reached 11 months. The National Association of Realtors (NAR) has gone from a premature celebration of a stabilization of sales in August to straining for positive messaging in the increasing inventory trend in November’s data to finally acknowledging in December the weakness in the market due to a sensitivity to higher rates and poor affordability. For January’s declines, the NAR did more projecting than usual in claiming that the down cycle has come to an end. Unfortunately, nothing in the existing home sales data confirms such an end.
The seasonally adjusted annualized sales in January of 4.94M were down 1.2% month-over-month from the slightly upwardly revised 5.00M in sales for December. Year-over-year sales decreased 8.5%, surpassing the 7.0% year-over-year decline in November which was then the largest annual decline since 2011 but better than December’s 10.3% year-over-year decline. Existing home sales are at their lowest level since November, 2015.

Source for chart: National Association of Realtors, Existing Home Sales© [EXHOSLUSM495S], retrieved from FRED, Federal Reserve Bank of St. Louis, March 20, 2019.
The NAR’s routine explanation for changes in existing sales has usually blamed sales declines on a shortage of inventory and celebrated sales increases in spite of inventory shortages. With sales mostly in decline for so long, the narrative has shifted. In the November report the NAR strained to paint a story of increasing demand. The NAR used the monthly gain in sales to celebrate: “After six consecutive months of decline, buyers are finally stepping back into the housing market…” With buyers still stepping away from the market, the NAR this time reached for a market bottom (emphasis mine): “Existing home sales in January were weak compared to historical norms; however, they are likely to have reached a cyclical low. Moderating home prices combined with gains in household income will boost housing affordability, bringing more buyers to the market in the coming months…Lower mortgage rates from December 2018 had little impact on January sales, however, the lower rates will inevitably lead to more home sales.” As I countered in the December Housing Market Review, the substantial year-over-year declines still indicate that the more meaningful trend remains downward.
The NAR continues to point to rising inventories as a positive sign. In the November report, the NAR noted that “increasing housing inventory has brought more buyers to the market.” For December, the NAR declared: “Several consecutive months of rising inventory is a positive development for consumers and could lead to slower home price appreciation.” For January, the NAR spun the shift of market power to buyers as a positive: “Decelerated sales and the increases in inventory will work in favor of potential homebuyers, putting them in a better negotiating position heading into the spring months.” (There is something circular in promoting decelerated sales as a positive driver of market demand!). Yet, median prices continue to go up and do not support such optimism. Indeed, the NAR acknowledged an on-going inventory shortage at the lower-end of the market.
Absolute inventory levels increased from 1.52M a year prior to 1.59M in January. A 3-month streak of monthly inventory declines ended with an increase from December’s downwardly revised 1.53M. On a basis of months of supply, inventory followed the trend in the absolute numbers: “Unsold inventory is at a 3.9-month supply at the current sales pace, up from 3.7 months in December and from 3.4 months in January 2018.”
In November, the NAR observed that “as more inventory enters the market and we head into the winter season, home price growth has begun to slow more meaningfully…This allows for much more manageable, less frenzied buying conditions.” This description was a good positive spin on slowing price growth although prices are not slowing as much as I would expect in this kind of slowing market. While the median price of an existing home continued monthly declines with a 2.8% drop, annual prices continued their ascent with a 2.8% year-over-year increase – the 83rd straight annual increase (the slowest price growth since February 2012).
The share of sales going to first-time buyers made its first substantial move in a long time. For January, the share dropped to 29% from 32% in December. For the second month, the share was actually flat with the year prior (note in previous posts I missed the downward revision in the January, 2018 share). The average share for first-time homebuyers for 2016 was 35%. The NAR’s 2017 Profile of Home Buyers and Sellers reported an average of 34% for 2017 and 33% for 2018.
Investors purchased 16% of homes in January, an increase from an upwardly revised 15% in December but down from 17% the year prior. Investor sales averaged a share of 15% in 2017 and 14% in 2016.
For the fourth month in a row, existing home sales decreased across all four regions year-over-year. In particular, the West suffered a seventh consecutive substantial drop. Here are the regional numbers with December, November, October and September’s year-over-year changes in parentheses respectively listed for comparison (any revisions are not included): Northeast -1.4% (-6.8%, -2.6%, -6.8%, -5.6%), Midwest -7.9% (-10.5%, -4.3%, -3.1, -1.5%), South -8.4% (-8.7%, -5.6%, -2.3%, -0.5%), West -13.8% (-15.0%, -15.4%, -11.2%, -12.2%). As usual, regional sale fluctuations had little to no relationship to the on-going price run-ups. The year-over-year price changes for December were surprisingly high given the sales declines but “moderation” finally arrived for January (December, November, October, September in parentheses without accounting for revisions): Northeast 0.4%, (8.2%, 6.5%, 3.0%, 4.1%), Midwest 1.4%, (0.0%, 2.6%, 2.4%, 1.9%), South 2.5% (2.5%, 3.2%, 3.8%, 3.0%), West 2.9% (0.2%, 1.8%, 1.9%, 4.1%).
Single-family sales dropped 1.8% from December and decreased on a yearly basis by 8.4%. The median price of $255,200 was up 3.1% year-over-year.
California Existing Home Sales – January, 2019
{Skipping this section; it will return in the next Housing Market Review}
New Residential Sales (Single-Family) – January, 2019
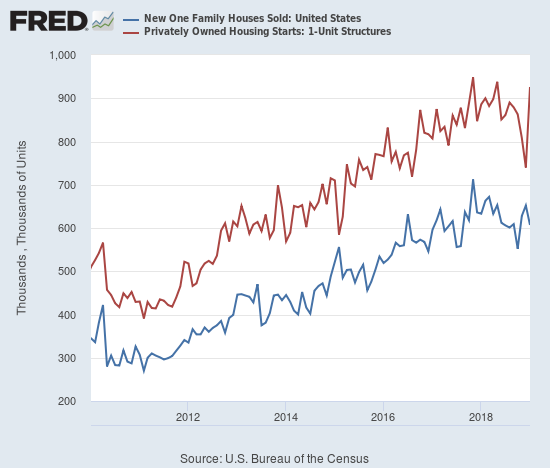
In a surprisingly stark contrast to existing home sales, new home sales from May to August increased in each month on a year-over-year basis. September finally unleashed a “pent-up” decline in new home sales that ended with a rebound in November and December. The fresh drop in sales in January provided another confirmation that November, 2017 will continue to stand as a substantial and sustained peak in new home sales. A new contrast has occurred with new home sales moving inversely to housing starts since November. Perhaps tentative builders are more sensitive than ever to the new home sales numbers given the recent weakness in the market. The January surge in starts looks like a delayed reaction to the rebound in new home sales, but the January drop in sales may bring a quick end to the rebound in starts.
The Census Bureau revised December sales of new single-family homes upward from 621,000 to 652,000. New home sales for January decreased 6.9% month-over-month and declined 4.1% year-over-year to 607,000.
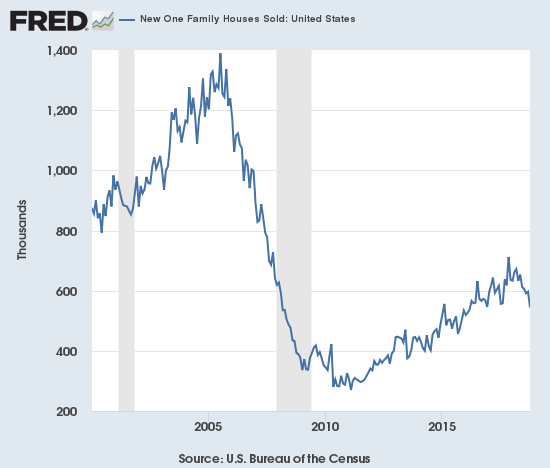
Source: US. Bureau of the Census, New One Family Houses Sold: United States [HSN1F], retrieved from FRED, Federal Reserve Bank of St. Louis, March 17, 2019.
In June, the inventory of new homes for sale jumped to 6.0 months of sales, a perfect balance. Inventory has trended upward from there. October’s inventory jumped to 7.2. After falling down for a few months, inventory bounced back to 6.6 in January.
In November, the median sales price of a new single-family home hit its lowest level of 2018 at $306,500 (revised), a 10.7% year-over-year plunge. Prices were last that low February, 2017 ($298,000). December’s median price rebounded to $311,100 (revised), still a 5.3% year-over-year drop. January’s median slid slightly to $317,200. December’s sequential bounce looked like a function of a reversal of the recent shift from the high-end to the middle and low-end of the overall market. January’s distribution shifted sharply back to the middle of the price range. It is interesting to see how the price of new homes is much more volatile than existing homes.
The 2-month double-digit bounce for the Northeast came to an end with an 11.4% drop. The South was the only region to gain in sales year-over-year. The Midwest plunged 41.9%. The South gained 6.2%. The West dropped 3.2% which follows eye-popping plunges of 23.9% and 25.9% in December and November, respectively.
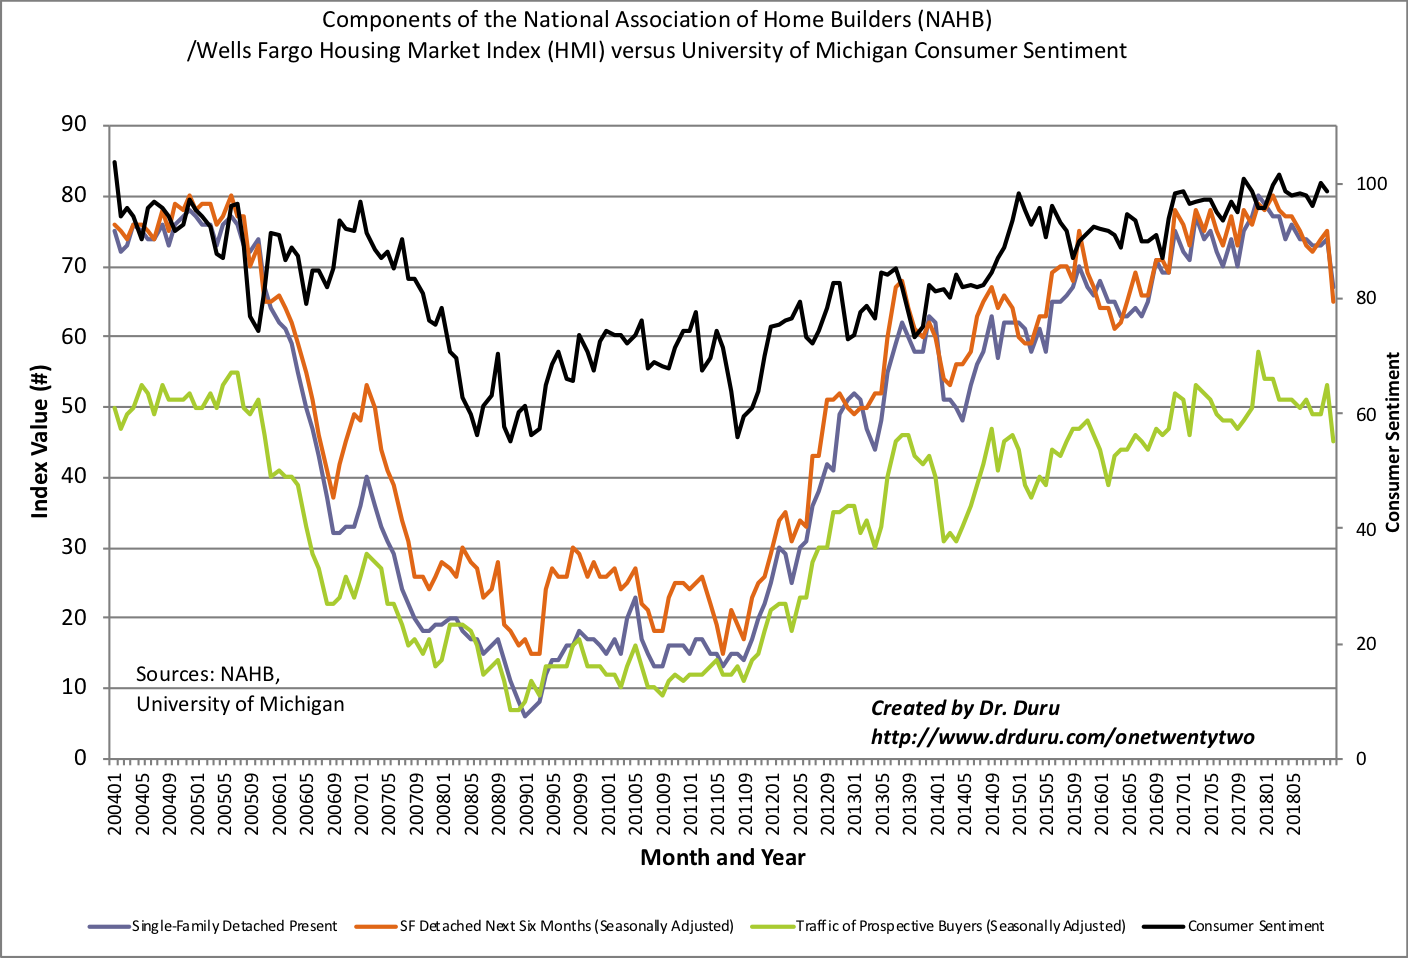
Home Builder Confidence: The Housing Market Index – February, 2019
The Housing Market Index (HMI) ended 2018 at an average 66.4, just slightly below 2017’s average of 67.8. The HMI fell off a cliff in the last two months of 2018 after finally giving in to the weight of declining components. The year 2019 has so far delivered major relief. The HMI perked back up 2 points to 58 in January and tacked on another 4 points to 62 in February. All the components have risen in unison. In a rare display of divergence, the consumer confidence index plunged in January; it started to play catch-up in February.
Source: NAHB
The NAHB once again took encouragement from declining mortgage rates. The NAHB even looked forward to the spring selling season: “In the aftermath of the fall slowdown, many builders are reporting positive expectations for the spring selling season.”
Although the HMI is recovering, the regional story remains mixed. After all four regions ended 2018 at multi-year lows, just two regions gained in January. At the time, I concluded that it was too early to extrapolate the HMI increase to an imminent improvement in housing data; I was only partially correct. In February, again, only two regions participated in the HMI’s gains. The Northeast declined from 47 to 45. The Midwest increased from a 4 1/2 year low at 49 to 54. The South also jumped, from 61 to 66. The West lost ground again falling from 70 to 67.
In the September Housing Market Review, I concluded that HMI had to begin a recovery in October for me to look forward more optimistically to the seasonally strong period for home builder stocks (November through March/April). Unfortunately, I concluded that “…home builder sentiment still looks like a breakdown in slow motion.” The brakes failed in November. The overall upticks to start the year are encouraging but seem to be reactions to sharply stronger new home sales. I suspect HMI will at least flatten out quickly in coming months (I previously predicted a resumption of the decline). Certainly the stocks of home builders suggest the rebound in data has a low ceiling.
Parting thoughts
The Nightly Business Report presented a report from CoreLogix (CLGX) on homeowner equity. Ironically, these increases are helping to encourage people to stay put and are making housing unaffordable in too many areas.
Be careful out there!
Full disclosure: long ITB calls