While the general stock market just keeps crawling steadily upward, individual stocks continue to produce some very interesting, and very tradable charts. For example, over the past several months, I have been able to identify many valuable breakouts as well as some breakdowns. The three charts in this post are not directly related, but I am combining them here for convenience. I may do more of these in the future
iShares Barclays TIPS Bond Fund (TIP)
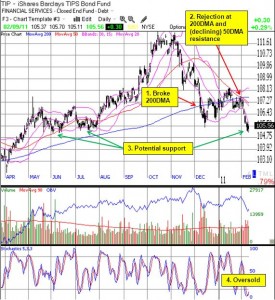
When I first ventured into TIPS, I thought it had a very simple relationship to inflation expectations: an increase in the price of TIPS equals an increase in inflation expectations. But when TIP reached multi-year highs for the first time last summer, a debate about the meaning of the price move ensued that taught me that the dynamics of TIPS are not quite that simple. I sold my holdings into that debate (and into the Federal Reserve’s TIPS-buying program), figuring that the downside risks far outweighed the upside opportunity.
TIP continued to rise almost 5% before peaking two months later. Fast forward another four months and TIP has finally dipped below my selling price after breaking down from key technical levels. I finally decided to buy into this dip on Wednesday (after commissions, I think I saved only a small amount of money while missing out on additional dividend payouts). When I rolled into TIP during the first round, I was buying simplistic inflation protection. This time around, I am looking for some inflation protection, but I am also positioning for what I think will eventually be another rally in these bonds. If I am fortunate enough to get much lower prices, I will “back up the truck” as they say. At a 2.47% yield, I am also fine just sitting in the current position if TIP goes nowhere for months on end. Most importantly, I am getting more serious about implementing some more diversification for the portfolio, similar to my decision to finally buy some, gasp, muni bonds (it helps that I have a friend who keeps pestering me about this!)
(Click image for larger view)

ProShares UltraShort 20+ Year Treasury (TBT)
The apparent top in bonds has perhaps produced one of the better and more precise timing calls in a long while, at least since the small group of folks who called for a bottom in stocks in late March, 2009 (even the President nailed that bottom).
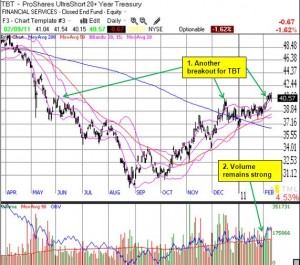
I missed that bottom in stocks, but I was chomping at the bit for the top in bonds. The ride in TBT, the inverse of long-dated Treasuries, has been a great one. With over a 33% gain from its bottom in late August and confirmed bottom in October, TBT is actually out-performing the S&P 500’s 27% gain from the moment Federal Reserve chairman Ben Bernanke announced the printing presses were warming up again. When TBT soared on record one-day volume following the Fed’s official announcement of QE2 in November, the bottom in TBT looked firmly secured.
At this point, I am thinking TBT has perhaps one more run left before the downside risks discourage me from trying to wait out any further upside opportunity. TBT broke out to fresh eight-month highs this month, so the next rally may have already started. Regardless, I am looking for the point to sell, rather than buy….although I have found a good number of short-term trading opportunities in the day-to-day and intraday volatility of TBT.
(Click image for larger view)

iShares MSCI Brazil Index Fund ETF (EWZ)
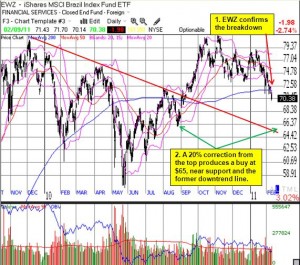
When EWZ first broke below its 200-day moving average (DMA) in late January, I speculated that the bounce in EWZ would be temporary. On Wednesday, EWZ confirmed my suspicions and finally closed below its 200DMA. EWZ is now about 13% below its closing peak from November, 2010. I am now looking to revive the “20% correction” strategy for buying EWZ. This strategy implies a buy on EWZ around $65. Given potential support at $66, I may buy a little early (assuming EWZ does indeed trade down this low). I still like Brazil as my favorite emerging market play, but the risks in Brazil are higher than ever as a new President has taken office, inflation is on the rise, and the country struggles with controlling capital inflows.
(Click image for larger view)

*All charts created using TeleChart:

Be careful out there!
Full disclosure: long TIP, TBT, and MUB. Long SSO puts.
