Nike (NKE)
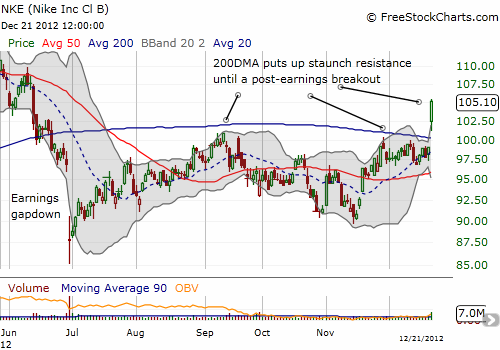
Just 6 months ago, Nike (NKE) posted earnings that disappointed investors to the tune of a 9.4% one-day drop. That drop was unusually large for NKE, but it printed the stock’s low for 2012. The stock steadily ground its way higher and filled its gap down within a month. NKE next stalled at the 200DMA, swung below the 50DMA, and rallied back into the 200DMA where it churned all month until earnings on December 20th. In a near 180 degree turn, investors decided they LOVED Nike’s latest earnings. The 6.2% pop created one of the strongest technical breakouts you will ever see in a stock.

This breakout cleared what now looks like a sloppy consolidation phase for NKE with the 200DMA capping gains. Coming on a weak market day (the S&P 500 was down 1.7% at one point), NKE’s relative strength is definitely buyable. I will of course wait for some kind of pullback to cool things down a bit. NKE is trading above its upper Bollinger Band, never a good time to buy as the stock is over-extended at that point.
Apple (AAPL)
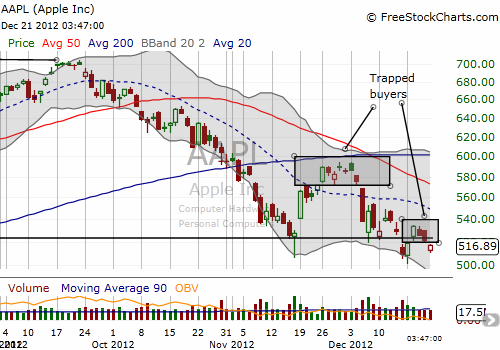
AAPL is a constant source of technical intrigue as the stock garners a lot of market attention. Particularly lately, the stock has shown the remarkable ability to move in large chunks on a weekly and sometimes daily basis. The latest drama features AAPL breaking down on Friday, Dec 21, reversing nearly all gains from the first two days of the week. The brief bounce from 10-month lows was largely a relieved response to news from Apple that iPhone5 sales in China are just fine (the previous trading day, Friday, December 14th, featured rumors that sales in China bombed).
This breakdown is similar to the breakdown earlier in December that confirmed resistance at the 20DMA. In both cases, the gap down left behind “trapped buyers.” These are people who bought into a gap up only to find themselves waking up one morning with sudden losses. This move then creates motivated sellers who are likely to nervously dump the stock as soon as they get close to breakeven.

Source: FreeStockCarts.com
Most importantly, AAPL has likely NOT yet bottomed. The strong downward bias remains as demonstrated in the declining 20 and 50DMAs. The continued breakdowns in the stock violate support levels and remind us that AAPL has yet to establish firm support. These are warning signs that must be taken seriously. On this latest breakdown, I used my call/put spread strategy to buy a call spread expiring Jan 4th to supplement/hedge a put spread expiring December 28th. My main position remains a call spread expiring on the third Friday in January. In the past week, poor execution meant I left a good amount of money on the table (failure to close out winning positions) despite Apple performing day-to-day on a near textbook basis. I am clearly still greasing the gears on my trading strategy! For an update on Apple’s typical daily trading patterns and a strategy for trading them, see “How To Trade Apple’s Breakdown As Negative Sentiment Grows.”
Be careful out there!
Full disclosure: long AAPL shares, long AAPL call and put spreads
