

Housing Market Intro and Summary
The housing market is currently defined by a split between new vs old, new home sales and existing home sales. Data on builder stocks, housing starts, and new home sales tell a diverging story from existing home sales data across the country. Homebuilder equities remain sensitive to policy headlines but continue to trade within a seasonally strong window. Builder confidence has softened, yet single-family construction and new home sales have shown signs of stabilization and resilience.
At the same time, existing home sales declined sharply in January at both the national and state levels. California reported a broad retreat in sales and prices, while regional data across the country showed month-over-month and year-over-year weakness. Inventory trends also differ across segments, with new home supply drifting toward balance while existing inventory dynamics vary by region.
Mortgage rates, affordability measures, builder incentives, and regional disparities all factor into the evolving picture. The sections below review housing stocks, builder sentiment, construction activity, new home sales, and existing home data to examine how the new vs old divide is shaping the current housing market.
Here is a summary for February’s housing market update:
- Housing stocks remain resilient, with the iShares US Home Construction ETF (ITB) outperforming the S&P 500 and holding above its bear market threshold despite policy headlines and recent volatility.
- Builder confidence declined for a second consecutive month, signaling affordability pressures even as pricing concessions and incentives stabilize.
- Single-family housing starts rebounded in December, suggesting improving momentum for new construction despite year-over-year declines.
- New home sales remained elevated through year-end, supported by mortgage rates below 6%, price incentives, and smaller home sizes.
- Existing home sales fell sharply in January, with national and regional weakness highlighting a divergence in new vs old housing activity.
- Inventory dynamics differ across segments, as new home supply trends toward balance while existing home markets face regional softness.
- California and Georgia data reinforce broader signs of softness in existing home markets despite improving affordability metrics.
- The emergence of rent now, pay later schemes indicate troubling conditions for lower income households.
Housing Stocks
The iShares US Home Construction ETF (ITB) returned to a bear market in December but has spent most of this year above the bear market line (marking a 20% loss from the all-time high). The ETF of home builders started the year fast as part of an overall market rotation into formerly beaten up parts of the stock market but lost steam at the back half of the month. A fresh rush of buying took ITB to a new high of the year before the recent pullback. ITB fell 3.4% in the wake of the President’s State of the Union Tuesday night which included a renewed call to ban institutional buyers from buying single-family homes. I’m surprised this reiteration spooked the market all over again especially given the numbers do not support this policy as a significant factor for the housing market.
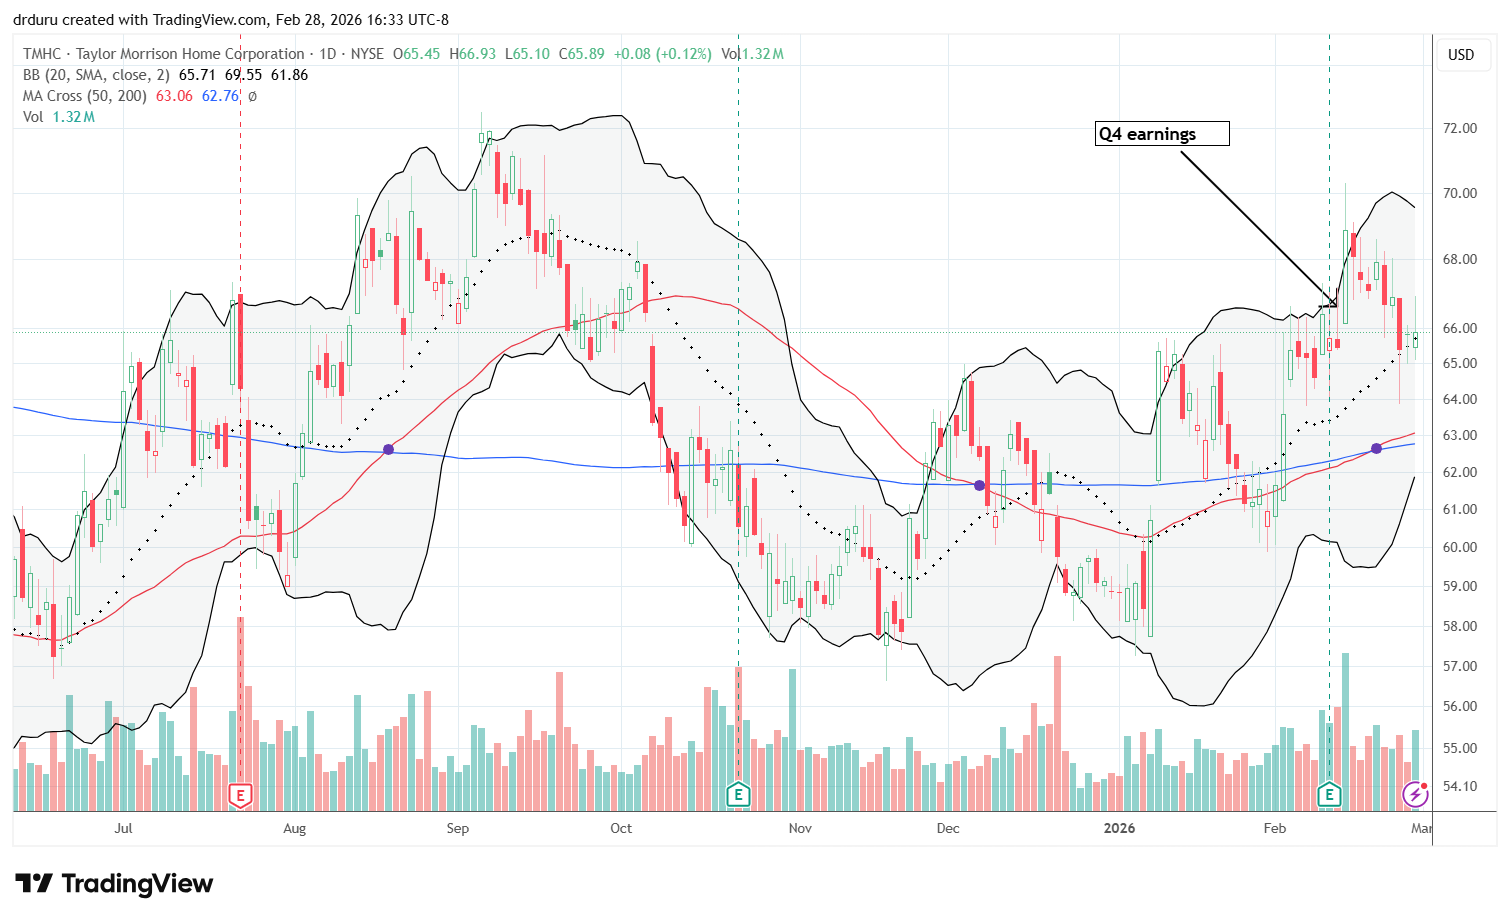
I bought into the retreat by rebuilding a position in Taylor Morrison Homes Corporation (TMHC). Given the seasonally strong period of trading in the stocks of home builders, I am primed to buy the dips almost no matter the news. ITB is up 11.7% year-to-date compared to the S&P 500’s 0.5% gain.
")
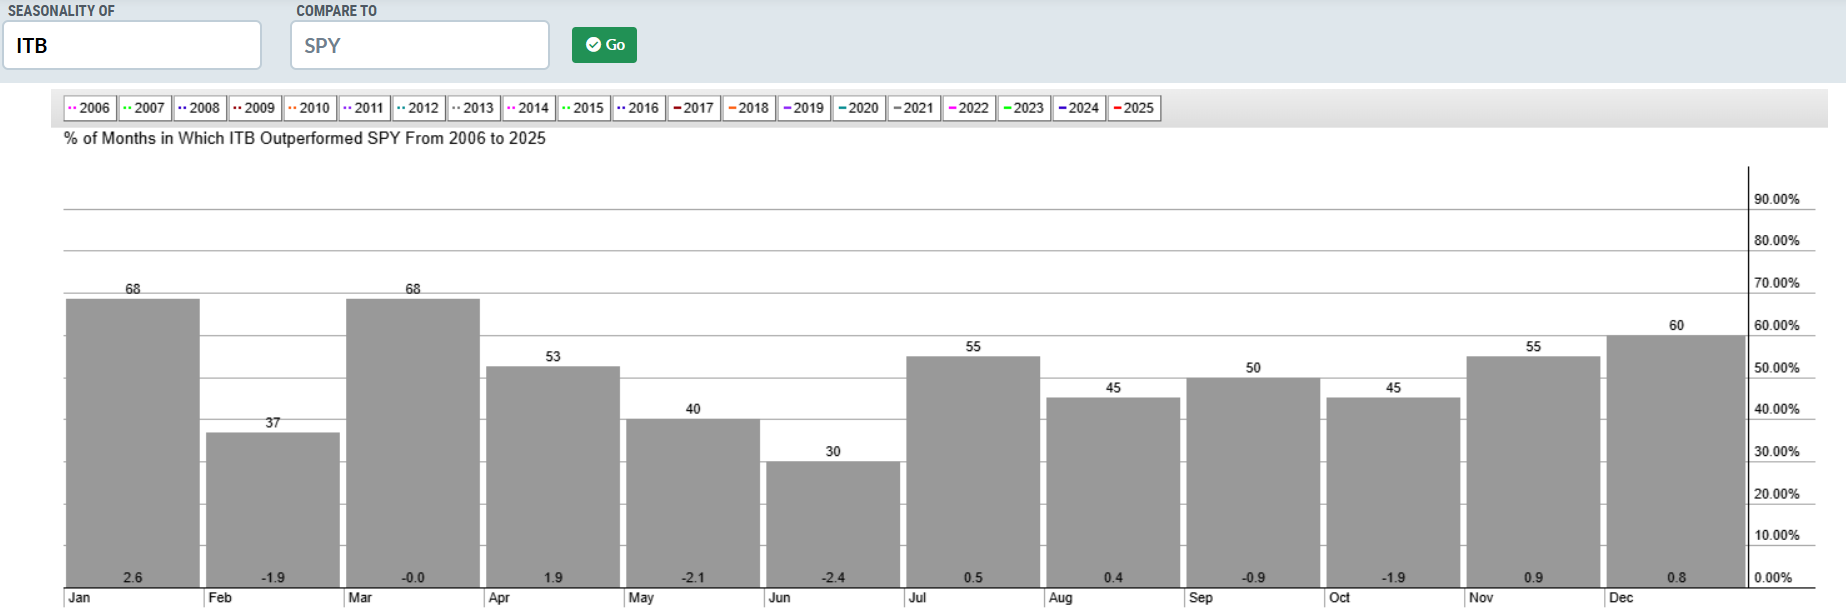
StockCharts provides a seasonality tool which gives me the ability to do a first check on the core thesis of the seasonality trade. The snapshot below shows that ITB tends to outperform the S&P 500 (SPY) monthly between November and April, except for February. I was very surprised to see how strongly ITB performs in July, especially in the last 5 years. Note that this chart only counts occurrences of outperformance; the chart says nothing about the magnitude. My analysis focuses on magnitudes, the most important factor for trading.
I have made few changes to my seasonal trades. Selling calls against my TMHC position has continued to work. Last week’s reversal of TMHC’s post-earnings gain gave me an opportunity to start rebuilding my position after getting a part of my position called away (before the latest cycle I sold calls against the full position, but I did not want a positive post-earnings response to take me out of the entire position). See “Taylor Morrison Remains A Solid Candidate For The Seasonal Trade On Home Builders” for more details.
Housing Data
Home Builder Confidence: The Housing Market Index – February, 2026
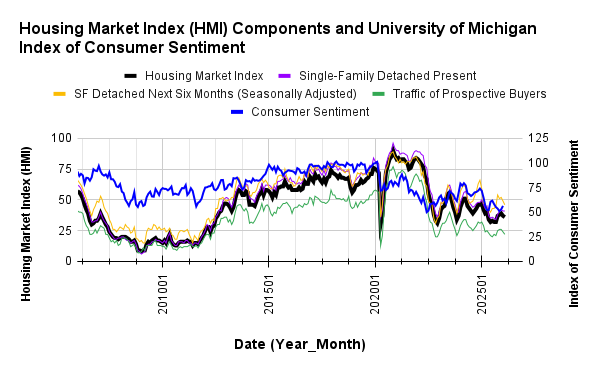
The National Association of Home Builders (NAHB)/Wells Fargo Housing Market Index (HMI) decreased 1 point to 36 in February. The NAHB blamed “persistent affordability challenges, including high housing price-to-income ratios and elevated land and construction costs” for this second consecutive decline.
Underlining the end of the upward momentum, the component for “Single-Family: Next Six Months”, a measure of expectations for future sales, fell three points to 46 after falling three points in December. The HMI index gauging current sales conditions held steady at 41 from January to February, and the gauge charting traffic of prospective buyers fell two points to 22.
/Wells Fargo Housing Market Index (HMI) and the University of Michigan Index of Consumer Sentiment")
Source for data: NAHB and the University of Michigan
Previously, I was hopefully that rising builder confidence would translate into improved consumer confidence. Consumer confidence improved, but builder confidence is now diverging. The February consumer confidence number was not available at the timing of writing, so I cannot yet assess the implications of this divergence.
While pricing pressure remains high for builders, they may have stabilized for now. The share of builders cutting prices plunged from 40% in January to 36% in February, a level last seen last May. The average price reduction remained at 6% in February. The use of sales incentives was 65% in February, unchanged from January.
The South was the only region to avoid a month-over-month decline. The Northeast lost almost all its gains in January with a drop from 47 to 42. The Midwest continued its reversal of December’s surge by slipping one point from 42 to 41. The South remained at 35 for the third month in a row. The West finished reversing all its gains from October by slipping from 34 in January to 30 in February.
New Residential Construction (Single-Family Housing Starts) – December, 2025
{The Census Bureau is now catching up on data reporting after the government shutdown. Housing starts data for November and December became available at the time of writing}
Single-family housing starts increased in December. The 981K in starts is the highest level since February 2025. December’s 981K in single-family starts represents a 4.1% month-over-month gain but a 9.0% year-over-year decrease. Despite the year-over-year decline, the ability to hold the line at 800K starts suggests that a fresh bottom is in place for housing starts and momentum is picking up for the spring selling season.
![US. Bureau of the Census, Privately Owned Housing Starts: 1-Unit Structures [HOUST1F], first retrieved from FRED, Federal Reserve Bank of St. Louis, February 19, 2026](https://drduru.com/onetwentytwo/wp-content/uploads/2026/02/20260219_Housing-Starts-Nov-Dec-2025.png "Housing starts")
The recent recovery in building permits (new privately-owned housing units authorized in permit-issuing places) stalled out in December. Single-family authorizations were 881K, a 1.7% month-over-month decrease from November and a 10.9% year-over-year decline.
There were wide divergences in regional starts of single-family homes. Month-over-month the changes were +2.9%, -6.1%, +0.9%, and 24.7% for the Northeast, Midwest, South, and West respectively. Year-over-year the changes were +12.7%, -19.0%, -8.6%, and +-9.4% for the Northeast, Midwest, South, and West respectively.
New Residential Sales (Single-Family) – December, 2025
{The Census Bureau is still catching up to data and analysis interrupted by last year’s government shutdown: “The December New Residential Sales release also contains initial estimates for the month of November”. January data are not available.}
After new home sales surged in August, I expected significant downward revisions with the breakout remaining marginally intact. Even the NAHB made it clear that future revisions would likely bring this sales number down. Surprisingly, not only did the August surge remain intact, but now sales through December have remained elevated including a fresh surge in November. Sales jumped 15.5% from October to November although sales next declined 1.7% from November to December, while rising 3.8% year-over-year to 745K new single-family homes sold.
The Mortgage Bankers Association estimated January sales….
“MBA estimates new single-family home sales, which has consistently been a leading indicator of the U.S. Census Bureau’s New Residential Sales report, is that new single-family home sales were running at a seasonally adjusted annual rate of 663,000 units in January 2026. The new home sales estimate is derived using mortgage application information from the BAS, as well as assumptions regarding market coverage and other factors.
The seasonally adjusted estimate for January is an increase of 3.6 percent from the December pace of 640,000 units. On an unadjusted basis, MBA estimates that there were 58,000 new home sales in January 2026, an increase of 16 percent from 50,000 new home sales in December. “
The resilience in new home sales still seems to be a result of aggressive price concessions, incentives, and smaller home sizes (for example see Taylor Morrison’s description of the competitive environment). Mortgage rates falling below 6% further support sales.
![US. Bureau of the Census, New One Family Houses Sold: United States [HSN1F], first retrieved from FRED, Federal Reserve Bank of St. Louis, February 28, 2026](https://drduru.com/onetwentytwo/wp-content/uploads/2026/02/20260228_New-Home-Sales-December-2025.png "new home sales")
For August, the median price for new homes jumped to the top of the current downtrend channel. For December, the median price increased to $414,400, marking a 4.2% sequential increase and a 2.0% year-over-year decline. The presumed $400,000 floor survived this latest pricing cycle.
The share of homes priced under $300,000 declined to 20% in December from 21% in November. Homes priced $300,000 to $399,999 fell from 28% to 26% share of sales. All price ranges from $400,000 to $999,999 shifted modestly month-over-month. The million dollar and higher homes held at 8% share in December. The reduced share at the lower price range helps explain the recent jump in the median price. The overall trend continues to point downward.
November inventory was 485K and December inventory declined to 472K. The months’ supply decreased from 7.7 to 7.6 months. Compared to a year ago, inventory is down from 489K and months’ supply is below the prior year’s 8.2 months. The inventory of new homes continues to drift toward balance as builders focus on managing their supply. The absolute inventory declined month-over-month. Even with inventory drifting toward balance, affordability remains a binding constraint for buyers.
Regionally, December sales changed month-over-month as follows: Northeast -37.3%, Midwest +31.7%, South -6.7%, and West +9.0%. On a year-over-year basis, the Northeast, Midwest, South, and West changed +12.1%, +30.1%, -1.1%, and +1.8% respectively.
Existing Home Sales – January, 2026
Existing-home sales declined sharply in January. The National Association of Realtors (NAR) reported an 8.4% month-over-month decrease to a seasonally adjusted annual rate of 3.91M, alongside a 4.4% year-over-year decline. The NAR called the sales plunge “disappointing” and attributed the numbers to unusually cold and wet January weather. At the same time affordability improved to levels last seen in March 2022 per the NAR’s Housing Affordability Index.

(For historical data from 1999 to 2014, click here. For historical data from 2014 to 2018, click here) Source for chart: National Association of Realtors, Existing Home Sales© [EXHOSLUSM495S], retrieved from FRED, Federal Reserve Bank of St. Louis, February 12, 2026

Total housing inventory in January was 1.22M units, down 0.8% from December and up 3.4% from January 2025 (1.18M units). The NAR reported a 3.7-month supply of unsold inventory, up from 3.5 months in December and also up from one year ago.
The median sales price of an existing home was $396,800 in January, up 0.9% from one year ago ($393,400). January marked the 31st consecutive month of year-over-year price increases, and the NAR noted that the median price reached a new high for the month of January. The affordability gains came from wage growth and a decline in mortgage rates.
The REALTORS® Confidence Index showed a median time on market of 46 days in January, up from 39 days in December and 41 days in January 2025.
The NAR also reported that first-time homebuyers represented 31% of sales (up from 29% in December and 28% one year ago).
Month-over-month and year-over-year sales fell in all regions. The regional year-over-year changes were: Northeast -4.0%, Midwest -7.1%, South -1.6%, West -7.9%.
Single-family existing home sales decreased 9.0% month-over-month in January to a seasonally adjusted annual rate of 3.53M and declined 4.3% year-over-year. The median price of a single-family home was $400,300, up 0.6% from last year.
California Existing Single-Family Home Sales – January, 2026

The California Association of Realtors (C.A.R.) reported that California home sales sharply retreated in January to their lowest level since May 2025 even as home prices fell to a 23-month low. C.A.R. noted that “after closing out 2025 on a strong note, California’s housing market has started the new year on a softer footing, with both sales and prices coming in below last year’s levels.” However, as mortgage rates ease toward recent lows and housing supply is expected to improve, C.A.R. anticipates momentum to build heading into the spring homebuying season. In the meantime the data overall shows continued market softness.
California’s existing single-family home sales declined 10.8% in January to 256,550, down 1.3% year-over-year. The median price decreased 3.2% month-over-month and down 1.9% year-over-year to $823,180. The statewide median price per square foot was $399, down from $409 a year ago. The sales-price-to-list-price ratio was 98% in January, up from December’s 97.8% but down from a year ago at 98.6%. This relative stability suggests the current price drop will not turn around in the short-term.
January’s unsold inventory index (UII), which measures the number of months needed to sell the supply of homes on the market at the current sales rate, increased from 2.7 in December to 4.4, also up from 4.1 a year ago. Total active listings rose from January 2025 for the 24th consecutive month, though the annual gain was the smallest in two years. California’s inventory of single-family homes experienced a ninth consecutive month of decelerating growth.
The median time on market increased from 35 a year ago to 39.
January was a broadly softer month of sales in California. While the C.A.R. is optimistically looking forward given declining mortgage rates, I am much more cautious. Nationally, existing home sales fell from a lack of inventory according to the NAR. California’s inventory rose and thus cannot explain the state’s decline in sales. C.A.R. offered an unsatisfactory explanation by grasping at coincident headlines from “heightened policy uncertainty and geopolitical tensions”.
Georgia’s Housing Market – January, 2025
The following infographic was created from Notebook LLM based on the December Georgia housing data posted by the Georgia Association of Realtors. (Note that the GAR does not clarify whether the reported percentage changes are month-over-month, year-over-year, or a mix).
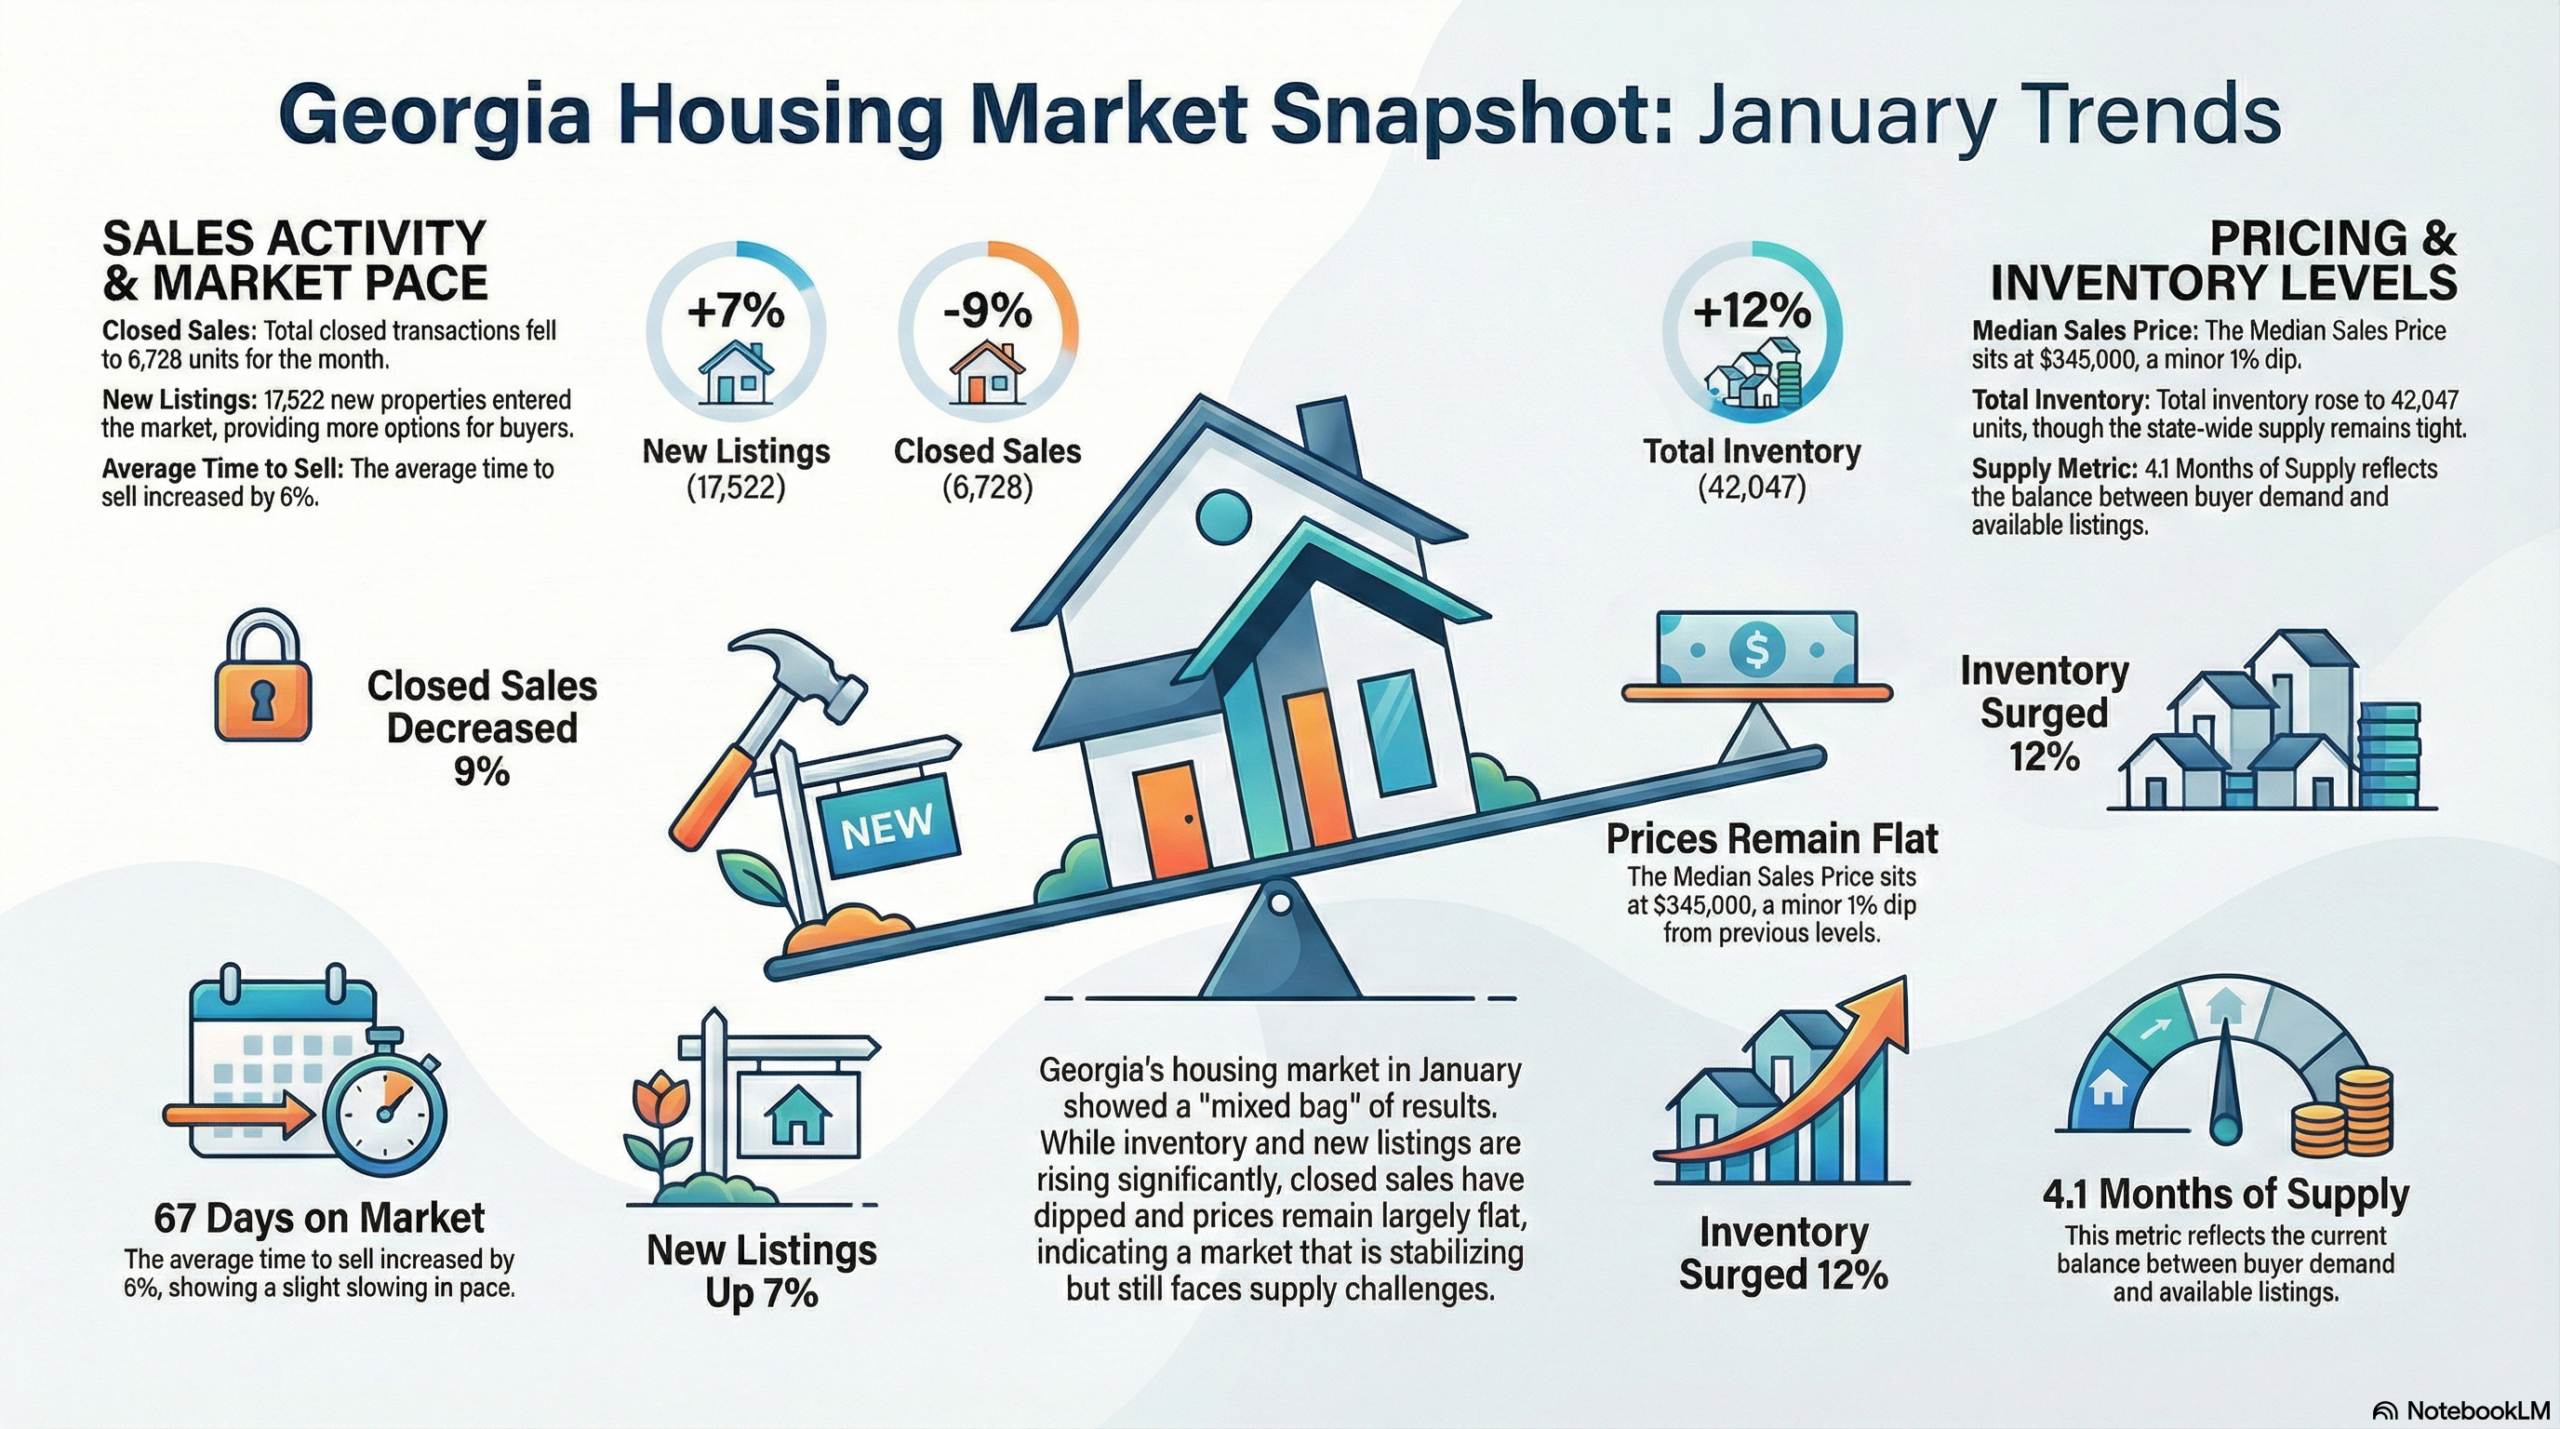
The Association called the results mixed, but the most important numbers tell me that Georgia’s market for existing homes was particularly soft in January.
Home closing thoughts
Rent Now, Pay Later
Incredibly, financial markets have now figured out how to extend lending for paying rent. According to Marketplace’s interview with Cora Lewis from the Associated Press, these financing companies charge a subscription fee and 1% of rent to grant the ability to delay paying rent. All together, Lewis’s sources estimate these costs amount to triple digit annualized interest rates on the loans. The interview did not provide numbers on the prevalence of these loans, but their very existence is an alarming signal for the health of lower income households.
Spotlight on Mortgage Rates…And Affordability
The Mortgage Bankers Association (MBA) reported two weeks with a decrease in mortgage applications and two weekly increases for the month of February. For all of January, new home purchase mortgage applications increased 2% year-over-year and surged 19% sequentially (not seasonally adjusted). The MBA sees consistency across the new home sales and housing start numbers. Thus, they are reinforcing my expectation for growing momentum for the spring selling season for new homes.
![Freddie Mac, 30-Year Fixed Rate Mortgage Average in the United States [MORTGAGE30US], retrieved from FRED, Federal Reserve Bank of St. Louis; February 28, 2026.](https://drduru.com/onetwentytwo/wp-content/uploads/2026/02/20260228_30-Year-Fixed-Rate-Mortgage-Average-in-the-United-States.png)
Be careful out there!
Full disclosure: long ITB, long TMHC
As someone who may need to sell my current home and move into a single‑level, no‑stairs home in about five years, your article made me wonder: based on the trends you described, where new homes seem to be holding up better than existing homes, does it make more sense for future buyers like me to focus on new construction, or do you think the existing‑home market will recover by then?
That’s a tough question to answer in general. As you likely appreciate, housing markets are local when it comes to individual buying decisions.
For your specific situation, buying a new home comes with the assurance that you will have some warranties to cover issues in your first 3-5 years. For existing homes, you’re on your own. You also don’t need to worry about replacing a roof for at least 15-20 years or more.
If you are worrying about resale value in the future, then the history of appreciation in the local market is much, much more important than whether the home is existing or new. For example, in a market with slow price appreciation, I would go new for the reasons above. In a market with substantial appreciation, I would just focus on getting the home I want…and move fast because in that market inventories are likely slim pickings.
Finally, you are much more likely to get a good price per square foot with new homes as existing homeowners cannot (or do not) offer incentives or mortgage rate buydowns.
Does all that make sense? Anything I missed for your specific situation?