

Housing Market Intro and Summary
This edition of “What Happened in the Housing Market” is once again without data on housing starts and new home sales because of the previous shutdown of the Federal government. Yet, plenty of data dropped to confirm the on-going sluggishness of the housing market. Poor responses to key earnings report turned December into a month of unseasonal pressure on the stocks of home builders. I made a premature observation in the last housing market update that initial momentum leading to a better a spring selling season in 2026 was likely underway. The hints actually increased in December with the Mortgage Bankers Association projecting a jump in home sales from notable improvements in affordability, but a bear market in home builder stocks resumed anyway.
Here is a summary for December’s market data:
- The stocks of home builders reentered a bear market and significantly underperformed the S&P 500.
- A measure of builders’ future sales expectations stayed above 50 for the third month, providing a sliver of hope for an improved spring selling season.
- Existing home sales continued to recover from the summer’s trough but overall remain sluggish.
- California’s market for existing homes reached a 3-year high.
- Georgia’s market for existing homes is constrained by a lack of inventory.
- The upcoming FIFA World Cup is raising questions about the availability (and affordability) of home rentals.
- Home affordability continues to improve as mortgage rates trend downward.
Housing Stocks
After a failed breakout in early December, the iShares US Home Construction ETF (ITB) spent the rest of the month mired again in a bear market. ITB is ending the year below key trendlines at its 50-day moving average (DMA) (the red line) and its 200DMA (the blue line). The ETF’s 5.4% loss month-to-date is unseasonal pressure as it represents a significant divergence from the S&P 500’s 1.2% month-to-date gain, a marked reversal of fortunes from November’s rally. Poor responses to home builder earnings weighed on the entire sector. Still, I am sticking with the seasonally strong period of trading in the stocks of home builders but now in anticipation of the performance gap closing in the coming weeks or months.
")
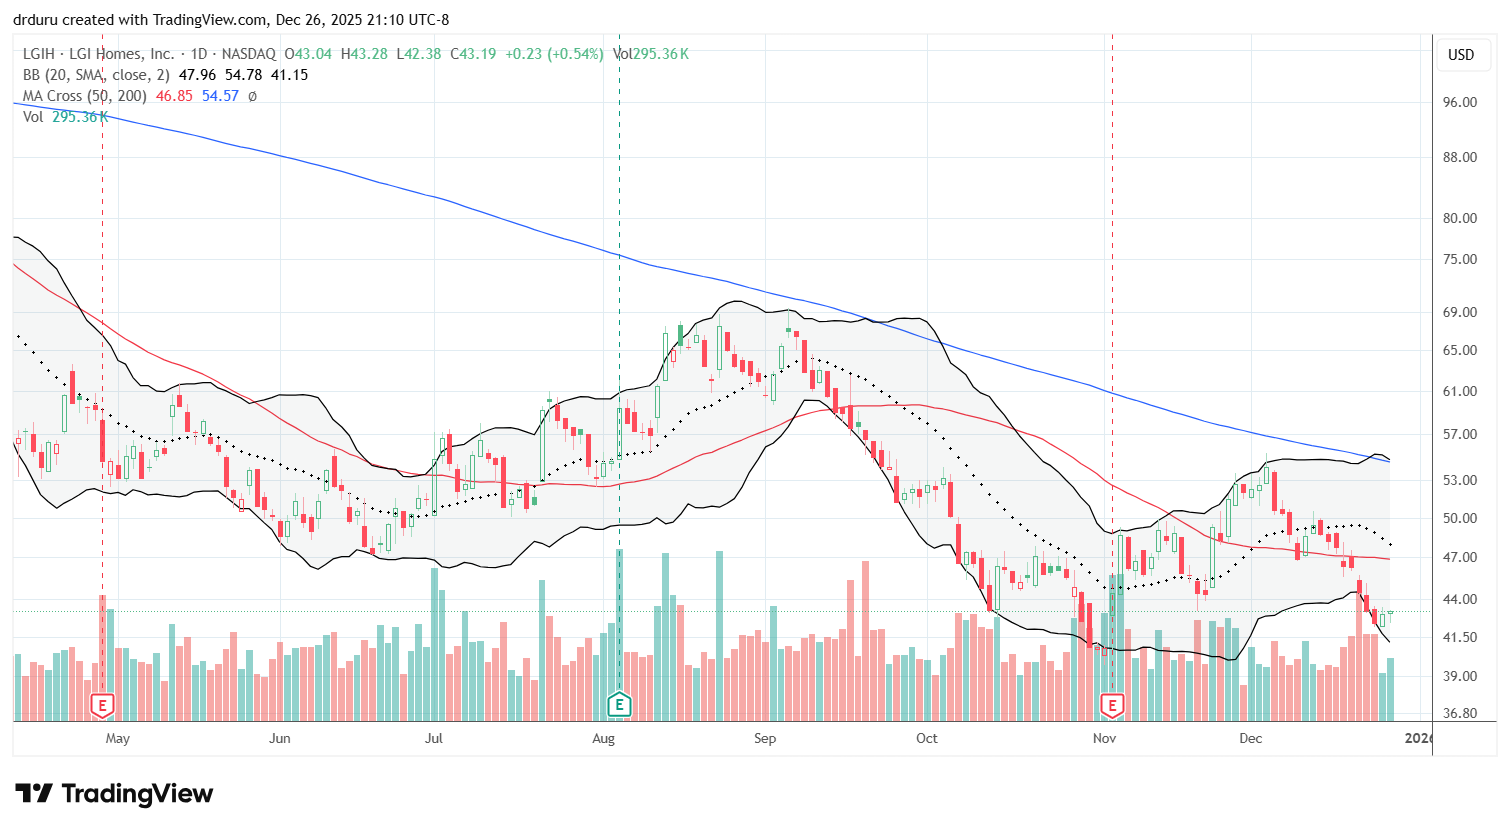
I previously hoped that LGI Homes (LGIH) could hold a bottom even as I dropped the stock from my builder shopping list. That hope was tested with December’s major reversal and loss of 17.0% month-to-date. This reversal confirmed the downtrending 200DMA (the blue line) as a significant price ceiling and symbolized the persistent weakness in the trade on home builders.
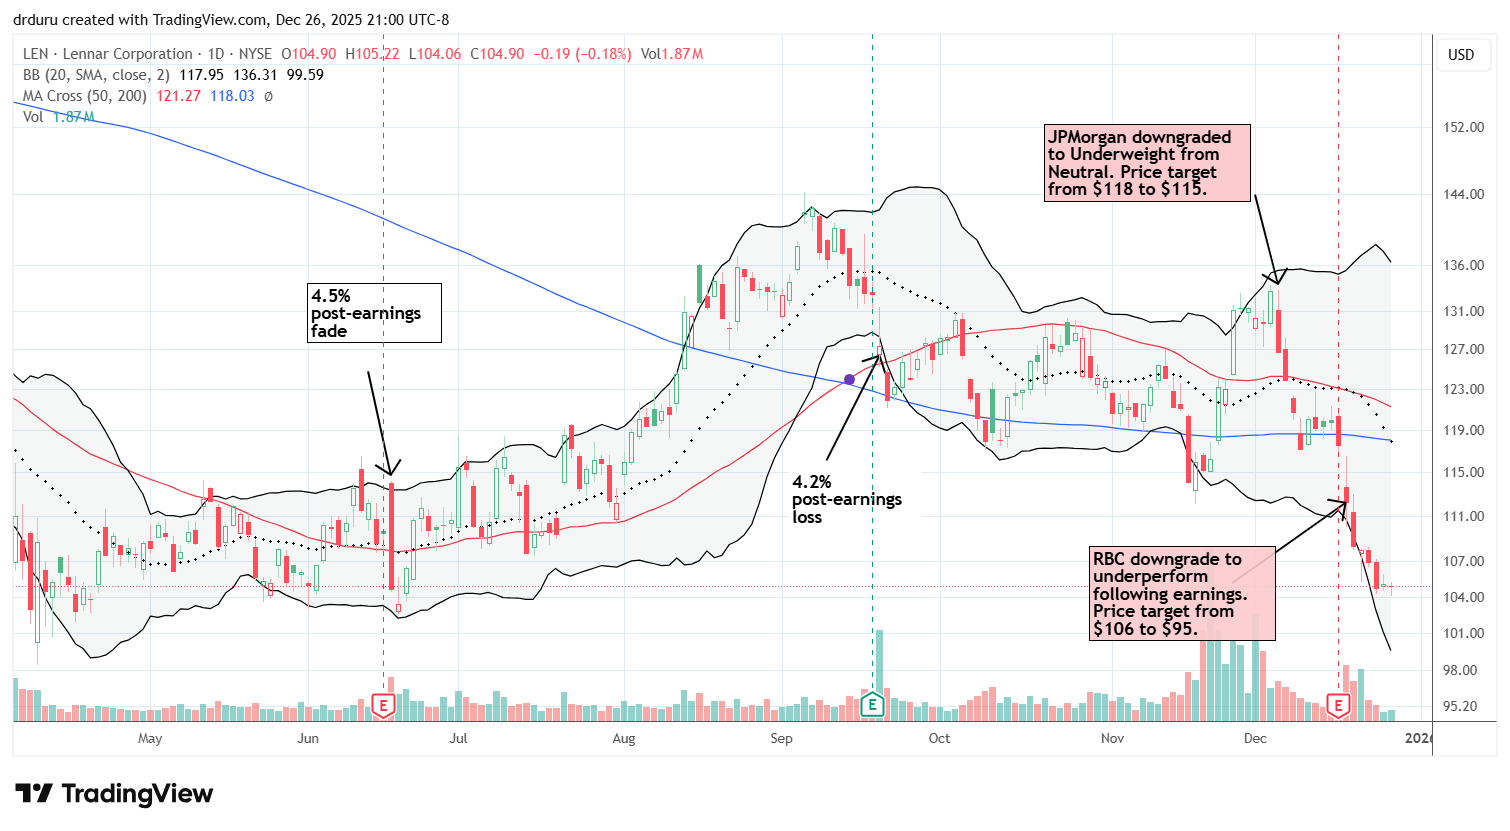
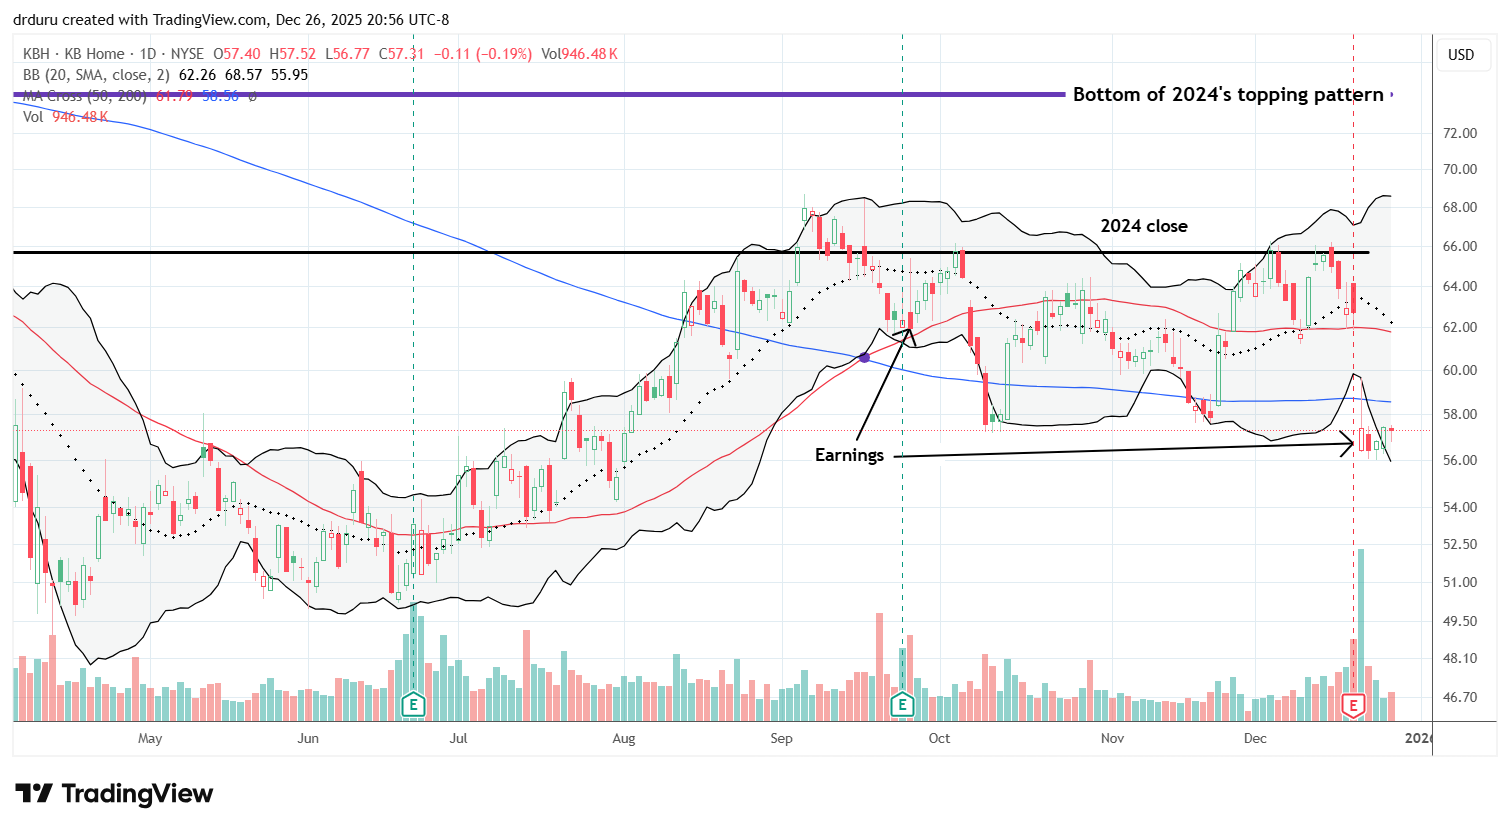
Poor reactions to the earnings reports from Lennar Corporation (LEN) and KB Home (KBH) really sealed the fate of the home builder trade in December.
LEN lost 4.5% post-earnings and sellers have barely slowed down since then. RBC downgraded LEN right after earnings citing lasting margin concerns. The accompanying underperform rating and price cut from $106 to $95 is clearly weighing on the stock.
KBH fared even worse than LEN with an 8.5% post-earnings loss. Unlike LEN, sellers have yet to make more progress in pressuring the stock. KBH is holding a near 5-month closing low.
Housing Data
Home Builder Confidence: The Housing Market Index – December, 2025
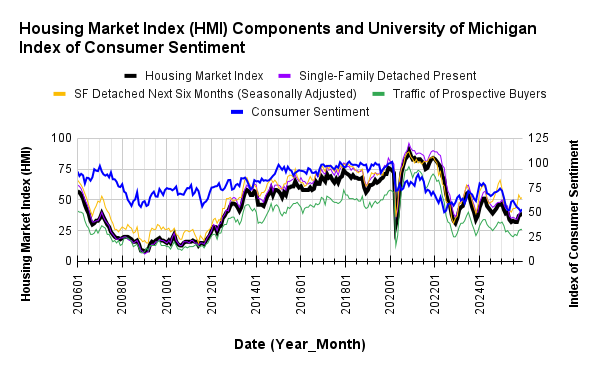
The National Association of Home Builders (NAHB)/Wells Fargo Housing Market Index (HMI) increased 1 point to 39 in December. HMI spent the entire year in negative territory (below 50) and is only three months away from its low of the year. Yet, the component for “Single-Family: Next Six Months”, a measure of expectations for future sales, hovered above 50 for the last three months. That positive reading provides a glimmer of hope that the seasonal trade on home builders may yet succeed in coming months.
/Wells Fargo Housing Market Index (HMI) and the University of Michigan Index of Consumer Sentiment")
Source for data: NAHB and the University of Michigan
While builder confidence continues to recover, consumer confidence ended the year on a weak note. In November, consumer confidence hit a 3 1/2 year low. December’s rebound barely placed consumer confidence above its previous low of the year. I am still hoping builders see something consumers do not yet see.
The recovery in builder sentiment is happening despite ongoing pricing pressures and sluggish demand for housing. The share of builders cutting prices hit a post-COVID record of 41% in November and declined just slightly to 40% in December. A 37% to 39% range had been in place since June. The average price discount declined from 6% in November to 5% in December. The share of builders providing incentives was flat from September to November at 65% but increased to “two thirds” in December.
A surge in sentiment in the Midwest and improvement in the West pushed the overall HMI to a gain for November. The Northwest dropped from 45 to 41 and finished the year well off a surprise surge to 55 in October. The Midwest delivered its own surprise with its high of the year at 47. The South declined from 37 to 35. At 36 the West finished 2025 at its second highest level of the year.
New Residential Construction (Single-Family Housing Starts) – September, 2025
{September through November data not available due to the previous shutdown of the U.S. Federal government}
![US. Bureau of the Census, Privately Owned Housing Starts: 1-Unit Structures [HOUST1F], first retrieved from FRED, Federal Reserve Bank of St. Louis, September 18, 2025](https://drduru.com/onetwentytwo/wp-content/uploads/2025/09/20250918_Housing-starts-August-2025.png "Housing starts")
New Residential Sales (Single-Family) – October, 2025
{September through November data from the Census Bureau are not available due to the previous shutdown of the U.S. Federal government. The data below are a close proxy from the Mortgage Banker’s Association.}
“MBA estimates new single-family home sales, which has consistently been a leading indicator of the U.S. Census Bureau’s New Residential Sales report, is that new single-family home sales were running at a seasonally adjusted annual rate of 755,000 units in November 2025. The new home sales estimate is derived using mortgage application information from the BAS, as well as assumptions regarding market coverage and other factors.
The seasonally adjusted estimate for November is a decrease of 2.1 percent from the October pace of 771,000 units.”
![US. Bureau of the Census, New One Family Houses Sold: United States [HSN1F], first retrieved from FRED, Federal Reserve Bank of St. Louis, August 28, 2025](https://drduru.com/onetwentytwo/wp-content/uploads/2025/09/20250925_New-home-sales-August-2025.png "new home sales")
Existing Home Sales – November, 2025
November’s existing home sales increased 0.5% month-over-month and decreased 1.0% year-over-year. The third straight month of sequentially increasing sales cannot hide the on-going sluggishness of the market for existing homes.

(For historical data from 1999 to 2014, click here. For historical data from 2014 to 2018, click here) Source for chart: National Association of Realtors, Existing Home Sales© [EXHOSLUSM495S], retrieved from FRED, Federal Reserve Bank of St. Louis, December 22, 2025

Absolute inventory decreased sequentially 5.9% to 1.43M unsold homes and printed a 7.5% year-over-year gain. According to the NAR, there is a “4.2-month supply of unsold inventory, down from 4.4 months in October and up from 3.8 months in November 2024”. Absolute inventory increased on a year-over-year basis for a 10th straight month.
The median sales price of an existing home set a record in June at $432,700 and has trended downward since then. November’s median price of $409,200 resumed the decline with a 1.4% drop from October. The median price still extended its streak of year-over-year price increases to 29 months with a 1.2% gain.
The average time on the market for an existing home increased from 34 days in October to 36 days in November. The year-over-year increase from 32 days is another reminder of the sluggishness of the market for existing homes.
The share of sales going to first-time home buyers decreased from 32% in October to 30% in November and flat with a year ago. I am surprised by the decline in share given the on-going decrease in the median home price. The NAR’s observation that “wage growth is outpacing home price gains, which improves housing affordability” is generally not showing up in sales outcomes. The NAR’s 2017 Profile of Home Buyers and Sellers reported an average of 34% for 2017, 33% for 2018, 33% for 2019, 31% for 2020, 34% for 2021, 26% for 2022, 32% for 2023, and a plunge to an all-time low of 24% in 2024.
No region gained in sales year-over-year. The regional year-over-year changes were: Northeast flat, Midwest -3.0%, South flat, West -1.3%.
Single-family existing home sales increased 0.8% to 3.75M in November and decreased by 0.8% year-over-year. The median price of a single-family home was $414,300, up 1.2% year-over-year and down 1.4% month-over-month.
California Existing Single-Family Home Sales – November, 2025

California’s existing single-family home sales reached an important milestone in November. At 287,940, sales achieved a 3-year high with a 1.9% increase from October and a 2.6% increase from a year ago. The median price decreased 3.9% month-over-month and flat year-over-year to $852,680. The median price per square foot dropped from $431 in October to $423, also down from $429 a year ago. The sales-price-to-list-price ratio remained flat for the second month in a row at 98.3%. A year ago the ratio stood at 99.4%.
The California Association of Realtors (C.A.R.) continued to temper its expectations. The organization now expects just “mild to moderate” sales and price growth next year because of the Federal Reserve’s apparent caution on monetary policy despite a slowing economy. The C.A.R. still expects mortgage rates to trend downward but not to change “dramatically”.
November’s unsold inventory index (UII), which measures the number of months needed to sell the supply of homes on the market at the current sales rate, increased from 3.2 in October to 3.6, also higher than the 3.3 from a year ago. Total active listings increased for the 22nd month in a row, but the rate of growth has declined for 7 straight months. Slowing growth in listings may also slow the housing market in coming months unless the coming spring selling season surprises significantly to the upside.
The median time on market stayed increased from 26 a year ago to 32.
Georgia’s Housing Market – November, 2025
The following infographic was created from Notebook LLM based on the November Georgia housing data posted by the Georgia Association of Realtors.
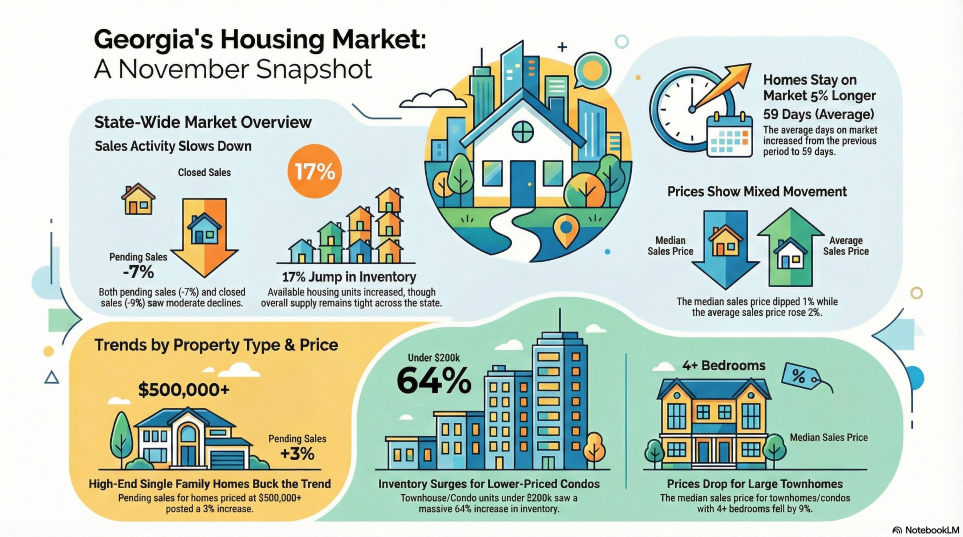
The Association warned that despite select increases in inventory, “lack of inventory remains a challenge throughout the state”.
Home closing thoughts
Does Investing In rentals for the FIFA World Cup Make Sense?
Marketplace went to Kansas City, MO to do a story on how next year’s FIFA World Cup may impact the smallest housing market of the 16 North American cities hosting games. I was surprised by the story of a couple who bought a 3-bedroom house last year in anticipation of cashing in on inflated rental prices during the World Cup. They hope to charge $1000/night (no bookings yet at the time of the broadcast).
However, when I look at the current FIFA schedule, I see calendar spacing that is much more hotel-friendly than Air B&B friendly. Kansas City is hosting just 6 days of games. The schedule includes 5 and 6-day gaps. Country-specific fans are not going to plant themselves in a single city and will instead jump from city-to-city. So a short-term rental runs a large risk of sitting empty for a large portion of the overall time frame for the tournament.
Still, Marketplace covered the story and interviewed people who seemed to think that housing scarcity will be an issue. If FIFA was really trying to help short-term renters make money, they would have compressed the schedule by reducing the number of hosting cities. I wonder what I am missing….
Blind to Risk?
Techcrunch recently reported that Zillow dropped its climate risk scores after complaints from agents who lost sales as a result of the data. These scores have been in place since 2024 and have been in place for years at other real estate listing sites. Thus, I am left confused about the controversy. Moreover, the article did not report concrete data or evidence of the impact these scores have had on the market. Presumably, buyers will demand discounts on homes that face some kind of “higher than normal” risk, but how those prices get negotiated are not clear, especially if existing insurance policies cover the risks.
Spotlight on Mortgage Rates…And Affordability
The Mortgage Bankers Association (MBA) reported 2 weeks with a decrease in mortgage applications and two weekly increases for the month of November. For all of October, new home purchase mortgage applications dropped 2.3% year-over-year and 1% sequentially. Surprisingly, at the same time, the MBA estimated a significant increase in the sale of new homes.
A jump in sales (for October) would be consistent with improved affordability. The MBA reported an ongoing improvement in affordability: “Affordability conditions have now improved for the fifth consecutive month because of lower mortgage rates, higher household earnings, and flattening home-price growth”. The MBA’s Purchase Applications Payment Index (PAPI) is now at a 3 1/2 year low. These data provided the strongest possibility of a rebound in the seasonal trade on home builders in coming weeks and months..
Softer prices will need to carry the load for affordability after mortgage rates stopped falling in November just as I anticipated in the last housing market review. This stall increases the tension in the market for the upcoming announcement on monetary policy (interest rates) from the Federal Reserve on December 10th.
![Freddie Mac, 30-Year Fixed Rate Mortgage Average in the United States [MORTGAGE30US], retrieved from FRED, Federal Reserve Bank of St. Louis; November 28, 2025](https://drduru.com/onetwentytwo/wp-content/uploads/2025/11/20251128_30-Year-Fixed-Rate-Mortgage-Average-in-the-United-States.png)
Be careful out there!
Full disclosure: long ITB shares and calls