

Housing Market Intro and Summary
This edition of “What Happened in the Housing Market” is truncated because the shutdown of the Federal government prevented the release of data from the U.S. Census Bureau. The Census Bureau is responsible for reports on housing starts and new home sales. The remaining data in this month’s post depicts a familiar mixed narrative of good and bad news in the housing market. A surge in positive builder sentiment was the most notable data point of the month followed by a continued recovering in existing home sales. While a rate cut in December is no longer a foregone conclusion, overall momentum is slowly building for an improved spring 2026 selling season.
Here is a summary for October’s market data:
- Under pressure from the president’s accusation of collusion-like practices holding up lots from development and a sector-wide downgrade from Evercore, the stocks of home builders returned to bear market territory.
- A measure of builders’ future sales expectations continued its upward momentum from September with a surge in October.
- Existing home sales pushed higher in what looks like an on-going recovery from the summer’s trough.
- California’s market for existing homes continued an on-going recovery from a trough in May.
- Pending home sales were flat from the previous month, suggesting the momentum going forward will be choppy.
- A development battle in Newark, CA tells a classic California narrative on the struggle for more housing.
- Mortgage rates fell to a fresh one-year low but are projected not to fall much lower for the time being.
Housing Stocks
In September, the iShares US Home Construction ETF (ITB) teetered on the edge of a fresh bear market soon after completing a bearish to bullish reversal. In October, accusations of collusion over lot development helped push ITB back into a bear market. A sector-wide downgrade from Evercore appears poised to keep ITB trading near and around the bear market line for some time. A bear market conventionally starts after a 20% decline from an all-time high. Despite the disappointing performance, I treated the fresh declines as a classic entry point to launch the seasonally strong period of trading in the stocks of home builders. (For more details on this year’s strategy see “ITB: Next Seasonal Trade On Homebuilders Starts With A New Bear Market“)
")
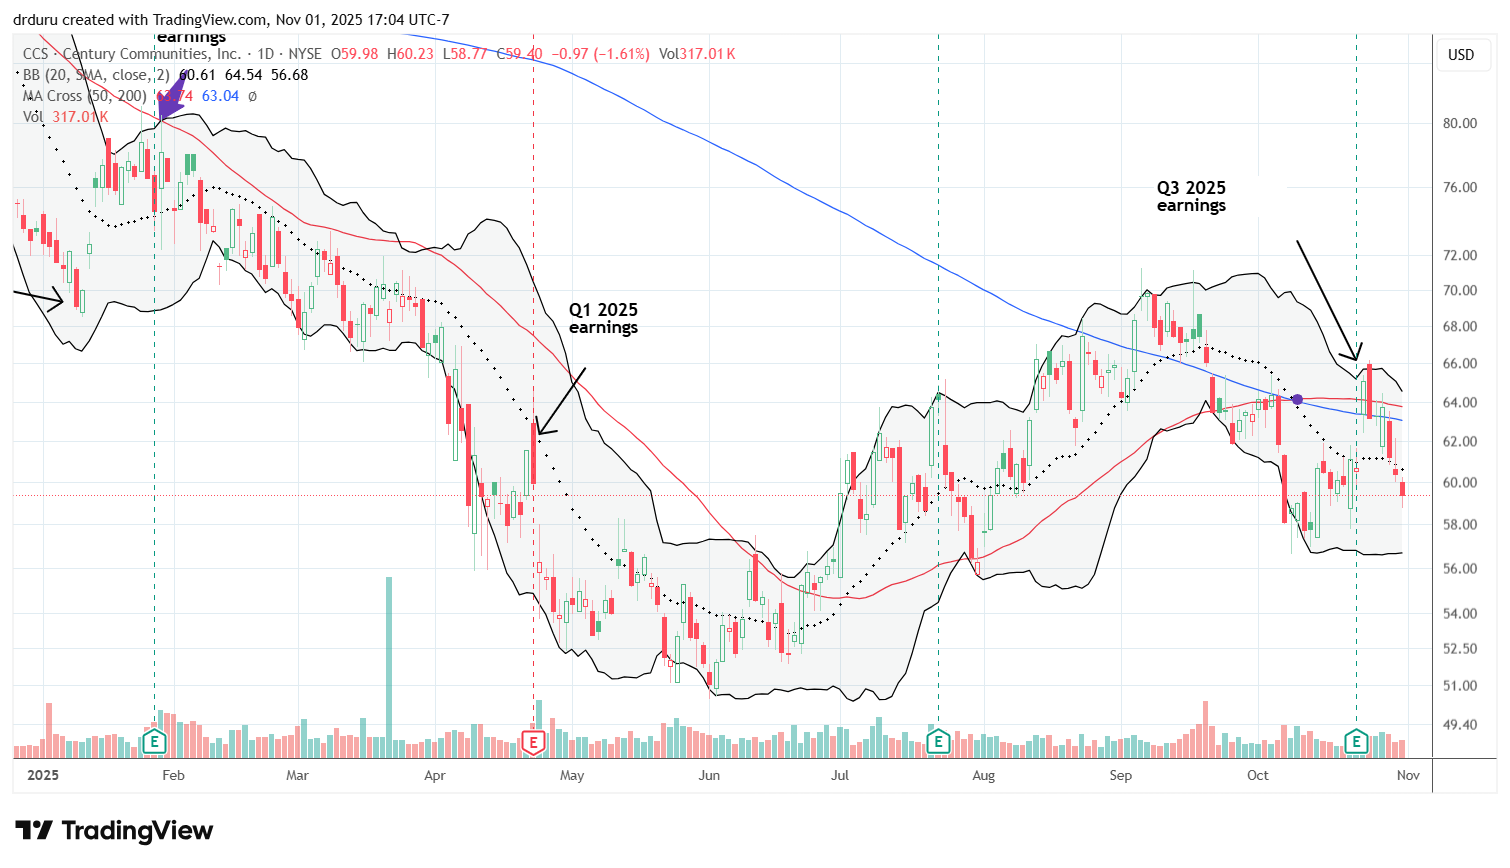
Century Communities (CCS) is one of the few home builders this earnings season to garner an initially positive response to its earnings. Unfortunately, the one day 7.2% post-earnings pop and breakout failed to generate additional momentum. In a sign of the choppy trading ahead for the seasonal strong period for builder stocks, CCS reversed its post-earnings gains in 4 trading days and looks at risk to test recent lows. I recently made a bullish case for CCS and remain positive on the trade.
Housing Data
Home Builder Confidence: The Housing Market Index – October, 2025
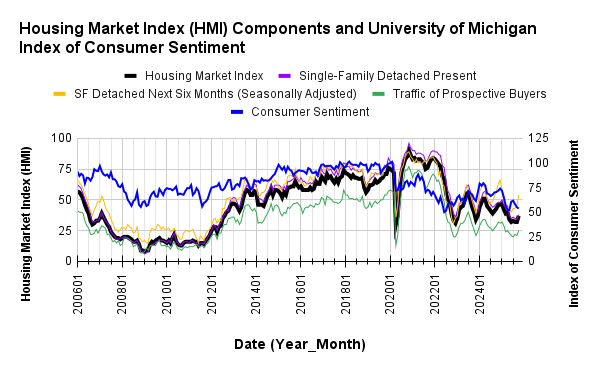
The National Association of Home Builders (NAHB)/Wells Fargo Housing Market Index (HMI) jumped 5 points to 37 in October. This sudden turn was mostly driven by an encouraging surge in the future sales expectations component of the HMI. At 54, this “Next Six Months” component is expressing optimism about the future for the first time since the component sat at 59 in January of this year. The other two components increased by 4 points. This turn-around bodes well for the spring 2026 selling season. Such optimism is the basis for the seasonal trade on the stocks of home builders.
/Wells Fargo Housing Market Index (HMI) and the University of Michigan Index of Consumer Sentiment")
Source for data: NAHB and the University of Michigan
While builder confidence is stabilizing and apparently about to trend higher, consumer confidence continues to sag. This divergence is unsustainable over time. Hopefully builders see something consumers do not yet see.
Overall pricing power declined slightly yet again for builders. The average price discount increased to 6% from the 5% where it previously stood since November, 2024. However, the share of builders cutting prices edged downward to 38% from the post-COVID record of 39%. A 37% to 39% range has been in place since June. The share of builders providing incentives stayed flat with September at 65%.
The Northeast drove the entire decline for the HMI in August, in September it was the only region to experience an increase. For October, all regions enjoyed increases in HMI with the Northeast leading the way with an 11-point surge to 55. The Northeast is now the first region to return to positive territory since February when the Northeast was at 50. The Midwest only increased from 41 to 42 and has stayed in a tight range all year between 38 and 44. At 35, the South hit its highest level since April, a 6 point gain. The West gained 4 points to reach 30, its highest point since April.
New Residential Construction (Single-Family Housing Starts) – September, 2025
{September data not available due to the on-going shutdown of the U.S. Federal government}
![US. Bureau of the Census, Privately Owned Housing Starts: 1-Unit Structures [HOUST1F], first retrieved from FRED, Federal Reserve Bank of St. Louis, September 18, 2025](https://drduru.com/onetwentytwo/wp-content/uploads/2025/09/20250918_Housing-starts-August-2025.png "Housing starts")
New Residential Sales (Single-Family) – September, 2025
{September data not available due to the on-going shutdown of the U.S. Federal government}
![US. Bureau of the Census, New One Family Houses Sold: United States [HSN1F], first retrieved from FRED, Federal Reserve Bank of St. Louis, August 28, 2025](https://drduru.com/onetwentytwo/wp-content/uploads/2025/09/20250925_New-home-sales-August-2025.png "new home sales")
Existing Home Sales – September, 2025
September’s existing home sales increased 1.5% month-over-month and increased 4.1% year-over-year. Sales are increasing per the expectations of the National Association of Realtors (NAR) with inventory at 5-year highs and mortgage rates at one year lows. I still expect overall sluggishness until the next spring selling season. Increased inventory has rarely catalyzed increased sales these past few years and affordability has proven more critical. Given the stickiness of home prices, lower mortgage rates will create the biggest impact on affordability.

(For historical data from 1999 to 2014, click here. For historical data from 2014 to 2018, click here) Source for chart: National Association of Realtors, Existing Home Sales© [EXHOSLUSM495S], retrieved from FRED, Federal Reserve Bank of St. Louis, October 28, 2025

Absolute inventory increased sequentially 1.3% to 1.55M unsold homes and printed a 14.0% year-over-year gain. According to the NAR, there is a “4.6-month supply of unsold inventory, no change from August and up from 4.2 months in September 2024.” Absolute inventory increased on a year-over-year basis for an 8th straight month.
The median sales price of an existing home set a record in June at $432,700 and has trended downward since then. September’s median fell month-over-month by 1.7% to $415,200. Still, the median price extended its streak of year-over-year price increases to 27 months with a 2.1% gain.
The average time on the market for an existing home increased from 31 days in August to 33 in September. The year-over-year increase from 28 days continues to highlight the overall sluggishness of the market.
The share of sales going to first-time home buyers increased from 28% in August to 30% in September and up from 26% a year ago. The NAR’s 2017 Profile of Home Buyers and Sellers reported an average of 34% for 2017, 33% for 2018, 33% for 2019, 31% for 2020, 34% for 2021, 26% for 2022, 32% for 2023, and a plunge to an all-time low of 24% in 2024.
The West was the only region without a sales increase. The regional year-over-year changes were: Northeast +4.3%, Midwest +2.2%, South +6.9%, West 0%. The recent gains in the South are a particularly encouraging sign for the housing market.
Single-family existing home sales increased 1.7% to 3.69M in September and increased by 4.5% year-over-year. The median price of a single-family home was $420,700, up 2.3% year-over-year and down 1.6% month-over-month.
California Existing Single-Family Home Sales – September, 2025

California’s existing single-family home sales have trended slightly upward since the unseasonal trough in May. Sales reached a 7-month high with a gain of 5% from August and a 6.6% year-over-year gain to 277,410 in September. The median price decreased 1.7% month-over-month and increased 1.8% year-over-year to $884,640. The median price per square foot increased from $426 in August to $427 in September and ended a 4-month streak downward but is still higher than the $424 a year ago. The sales-price-to-list-price ratio continued its downward streak with a slight decline from 98.3% to 98.2% month-over-month. A year ago the ratio stood at 100%.
In August, the California Association of Realtors (C.A.R) optimistically looked forward to “stronger buyer activity and renewed demand in the months ahead”. The organization tempered expectations a bit in September citing economic uncertainty from the Federal government shutdown and the most recent flare-up in the economic war between China and the U.S. (At the time of writing, this war returned to detente).
August’s unsold inventory index (UII), which measures the number of months needed to sell the supply of homes on the market at the current sales rate, decreased from 3.9 in August to 3.6 in September, the same level from a year ago, as sales increased and active listings fell. Total active listings increased year-over-year for the 20th month in a row by 16.2%.
The median time on market increased from 31 days in August to 32 days in September, up from 24 days a year ago.
Home closing thoughts
Pending Home Sales
Pending sales of existing homes did not change from August to September. Still, according to the NAR, contract signings reached their second highest level of the year. However, “signings have yet to fully reach the level needed for a healthy market.” The NAR suggested that a softening job market was an overwhelming factor driving the tepid performance for pending home sales. This somber characterization contrasts with the more optimistic tone in the existing home sales report.
Development Battle in Newark, CA
The city of Newark is considering approval for a housing development site next to marshlands. Environmentalists oppose the project and prefer for the area to be restored to marshlands to combat impacts of rising sea levels from climate change.
Looking at pictures of the site, where an auto junk yard currently operates, I sure would not want to buy a house in this area. Yet, such are the extremes of trying to find places to build homes in California. The environmental group pointed to land next to an emptying mall as better suited for development. The related article in the local paper did not indicate whether the developers of the marshland site own or have access to the land near the mall.
Spotlight on Mortgage Rates
The Mortgage Bankers Association (MBA) reported 3 weeks with a decrease in mortgage applications and one weekly increase for the month of October. These surprising declines came a month after the exact opposite pattern occurred when new home purchase mortgage applications increased 2.0% year-over-year and decreased 5.0% from August (not seasonally adjusted).
Mortgage rates fell to a fresh 1-year low. However, a rally in long-term bonds (lower rates) came to a screeching halt last week after the Federal Reserve cut rates and then balked at projecting another cut in December. Given the resulting spike in bond yields, mortgage rates may possible stop going down for the time being.
![Freddie Mac, 30-Year Fixed Rate Mortgage Average in the United States [MORTGAGE30US], retrieved from FRED, Federal Reserve Bank of St. Louis; November 1, 2025](https://drduru.com/onetwentytwo/wp-content/uploads/2025/11/20251101_30-Year-Fixed-Rate-Mortgage-Average-in-the-United-States.png)
Mortgage Rates Not Going Anywhere?
A near-term floor for mortgage rates would not surprise Chief Economist Mike Fratantoni from the Mortgage Bankers Association. Fratantoni visited CNBC’s Fast Money on October 28, 2025 to provide his forecasts for the housing market. His headline message: mortgage rates will not come down with Fed rate cuts because of a combination of rising term premiums, trillions in debt issuance by the U.S. government, and upward pressure on prices from tariffs. Thus mortgage rates will stay in the 6% to 6.5% range for the time being.
Other key points:
- The Fed will be discouraged from lowering rates more than 3 or 4 times over the next 6 months because of inflationary pressures from tariffs
- Expect home sales to increase about 5% in 2026
- First-time buyers have already acclimated to the current rate environment
- The potential move-up buyer is reluctant to give up their 3% rate
- Offering permanent buydowns has been a very effective way for home builders to get new customers and will continue until inventory gets back down to a more typical level (about 6 months of sales)
Be careful out there!
Full disclosure: long ITB shares and calls, long CSS