

Housing Market Intro and Summary
What happened in the housing market in April, 2025? Macro-economic headlines and conditions dominated the environment with tariff pressures and chaos at the center. The economic uncertainty cascading from the burden of tariff policy permeated results from homebuilder and consumer sentiment, housing starts, and existing home sales. New home sales provided a small port in the storm.
- Home builder stocks fell even deeper into bear market territory as home builders continue to report deteriorating earnings results and ratchet back guidance.
- Home builder sentiment eked out a one point gain. However, expectations for sales in the next 6 months dropped 4 points to a 17-month low.
- Single-family housing starts plunged from recent highs while building permits suffered their first significant decline since last summer.
- Sales of new single-family homes rose to the top of a two-year range in sales.
- Existing home sales dropped in confirmation of a sluggish spring selling season while pending home sales resumed a steep decline.
- California’s existing home market outperformed the rest of the West.
- Westchester County in NY experienced a strong burst in housing activity for the spring selling season.
- The Homeownership rate dropped to a post-pandemic low as affordability ssues weigh on the market.
- Home sellers are giving concessions at a near record rate while homes sell at the slowest pace since 2019.
- Mortgage rates stopped declining but have also likely topped out.
Housing Stocks
The iShares US Home Construction ETF (ITB) remains stuck in a deep bear market. The ETF of housing related stocks recovered along with the rest of the market from deeply oversold conditions, but the downtrend for ITB remains firmly in place. but now struggles at resistance formed by its 2024 lows. This year’s seasonal trade on home builders is officially dead. ITB is down 11.9% year-to-date while the S&P 500 (SPY) is down 5.8%. I also fear that homebuilders continue to point the way downward for the stock market and the economy.
The next major catalyst for builders will need to come from the U.S. Federal Reserve in the form of significant rate cuts, but stagflationary pressures promise to delay the cavalry.
")
Century Communities, Inc (CCS) has had one of the worst responses to earnings this earnings season. The stock dropped 6.1% in the wake of earnings and has now erased almost all its gains since 2023. CCS also trades 50% off its all-time high set last September.
")
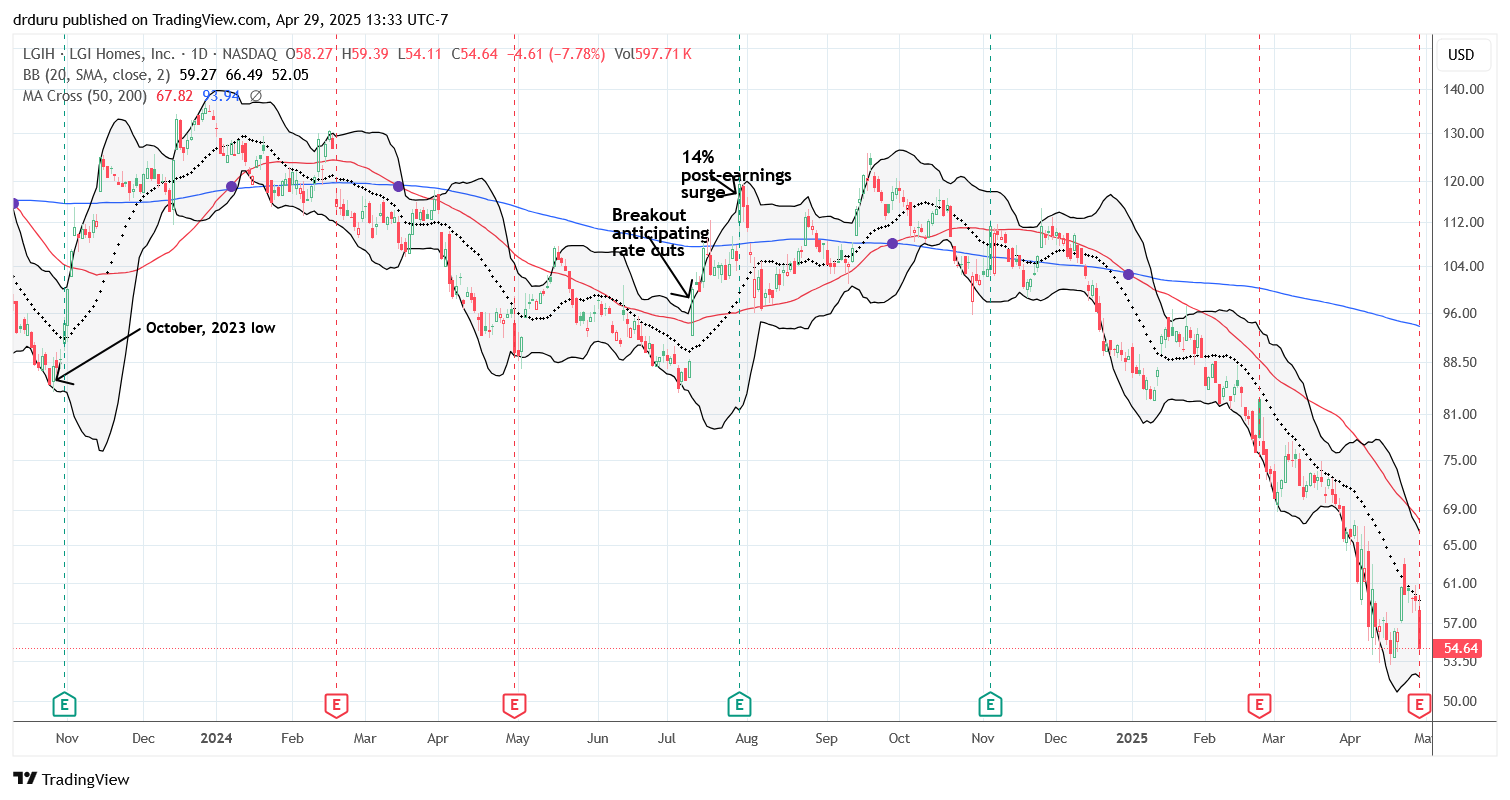
The on-going weakness in LGI Homes (LGIH) continues to worry me about the health of the housing market in the sunbelt, especially the south. LGIH fell 7.8% post-earnings after the company reported big misses on earnings and revenue. Revenue was 10% year-over-year for the quarter.
Pulte Group (PHM) delivered a rare surprise with an 8.6% post-earnings surge. Most importantly, PHM held the line on margin guidance despite a $5000 per home hit from tariffs. The company also made small guidance adjustments downward in land investment and home deliveries for the year. Still, I do not expect PHM to enjoy much more upside in absence of rate cuts and/or improving macroeconomic conditions. The stock is currently stuck at resistance from its 50-day moving average (DMA) (the red line).
")
Housing Data
Home Builder Confidence: The Housing Market Index – April, 2025
After two months of plunges, the National Association of Home Builders (NAHB)/Wells Fargo Housing Market Index (HMI) gained one point to 40. The NAHB took little solace in the gains. The industry association lamented that “growing economic uncertainty stemming from tariff concerns and elevated building material costs kept builder sentiment in negative territory in April.” (Negative territory is below 50). Tariffs have been an on-going concern for the NAHB this year. The NAHB went on to warn that “policy uncertainty is making it difficult for builders to accurately price homes and make critical business decisions. The April HMI data indicates that the tariff cost effect is already taking hold, with the majority of builders reporting cost increases on building materials due to tariffs.”
The HMI components diverged again in April. The 4 point drop in the SF Detached Next Six Months likely weighed on the NAHB’s assessment. This component that measures builder’s expectations for the future dropped after two months of holding steady at the low hit last year. Now the SF Detached Next Six Months sits at a level last seen November, 2023. The other two components experienced slight increases.
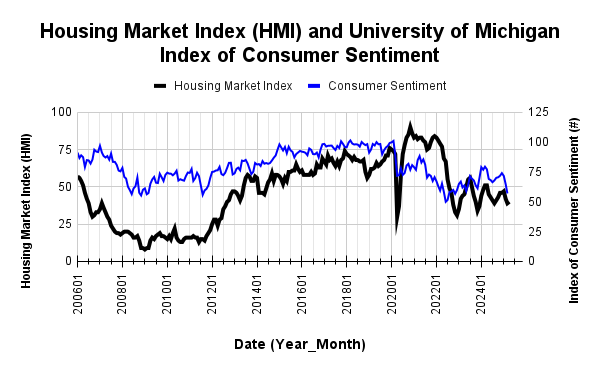
/Wells Fargo Housing Market Index (HMI) and the University of Michigan Index of Consumer Sentiment")
Source for data: NAHB and the University of Michigan
Consumer sentiment continued to plunge even has home builder sentiment rested from recent declines. If past patterns play out, builder sentient will soon take another dive downward.
Pricing power for builders was almost flat from March. The 29% share of builders cutting prices is the same as March. The share of builders providing incentives increased from 59% to 61%. The average price discount was flat yet again at 5%.
For February and March HMIs, each of the four regions dropped. In April, the Northeast fell for the third month in a row to a 43 HMI. The South extended its losing streak to 4 straight months and dropped below its 2024 low. At 38, the South is back to levels last seen November, 2023. The Midwest jumped 5 points to 43, one shy of its high for the year. The West added one point to its trough of the year and moved from 34 to 35.
New Residential Construction (Single-Family Housing Starts) – March, 2025
Single-family housing starts realigned with plunging builder sentiment by dropping sharply by 14.2% sequentially and 9.7% year-over-year. This fall came off a 12-month high. The 940,000 starts finally pulled this number below the 1M mark after holding the line following November’s breakout.
![US. Bureau of the Census, Privately Owned Housing Starts: 1-Unit Structures [HOUST1F], first retrieved from FRED, Federal Reserve Bank of St. Louis, April 19, 2025](https://drduru.com/onetwentytwo/wp-content/uploads/2025/04/20250419_Housing-starts-March-2025-1.png "Housing starts")
Building permits declined in March, the first significant decline since the trough last June. Permits declined slightly by 0.6% year-over-year. This decrease augurs poorly for future housing starts.
While starts declined significantly in the month, the West still managed to increase starts year-over-year. The Northeast, Midwest, South, and West each changed -1.5%, -12.6%, -14.8%, and +3.6% respectively year-over-year. The West has gained two months in a row. I previously thought the November starts boded poorly for the spring selling season, and December starts brought a sliver of hope. January’s weak starts reaffirmed my subdued expectations. March’s starts delivered a final confirmation of a slow spring.
New Residential Sales (Single-Family) – March, 2025
A wide range remains in place for new residential single-family sales even with March’s gain. Since November 2022, new home sales have bounced between 595K and 741K. March sales hit 724K, a 7.4% sequential jump and a healthy 6.0% year-over-year gain. This return to the top of the range stands in contrast with the less promising data for housing starts. Builders may be pivoting to drawing down inventory in preparation for a bigger housing slowdown (in the South at least…see below).
![US. Bureau of the Census, New One Family Houses Sold: United States [HSN1F], first retrieved from FRED, Federal Reserve Bank of St. Louis, April 27, 2025](https://drduru.com/onetwentytwo/wp-content/uploads/2025/04/20250427_New-home-sales-March-2025.png "new home sales")
For March, the median price for new homes dropped 1.9% sequentially and 7.5% year-over-year to $403,600, the second lowest price in three years. A very slow and choppy downtrend continues to unfold from the all-time high in October, 2022. As with many of the prior swings, March’s price swung with notable changes in sales mix.
In January, there was a sharp shift in price to the middle of the price distribution with the $400,00 to $599,999 range collectively gaining 7 percentage points, and homes over $1M gaining a percentage point. For February, the $300,000 to $399,999 range was the only tier to gain share (from 27% to 34%). In March, the distribution completely swung to homes priced under $500,000 both sequentially and year-over-year. This definitive decline drove the median price downward.
March’s inventory declined slightly from February’s 8.9 (unrevised) to 8.3 months of sales. For comparison, a year ago inventory sat at 8.3 months of sales. Absolute inventory continues to rise after remaining flat for most of 2024. Absolute inventory was last this high 17 1/2 years ago. (The NAHB did not calculate total inventory including existing homes for March).
The South was solely responsible for the net gain in year-over-year sales and constituted the majority of the sequential gain. The Northeast, Midwest, South, and the West changed -33.3%, -15.9%, +22.3%, and -12.2% respectively year-over-year.
Existing Home Sales – March, 2025
February existing home sales surged to recent highs and gave fresh hope for the spring selling season. March sales brought the picture right back down to reality with a 5.9% drop to levels last seen in October, 2024. Sales also declined 2.4% year-over-year, a second straight year-over-year loss. Pending home sales also continue to plunge.

(For historical data from 1999 to 2014, click here. For historical data from 2014 to 2018, click here) Source for chart: National Association of Realtors, Existing Home Sales© [EXHOSLUSM495S], retrieved from FRED, Federal Reserve Bank of St. Louis, April 27, 2025

The desired correlation between inventory and sales once again failed to materialize. Inventory surged as should happen in the spring selling season, but sales did not follow. As a reminder, in the last report, the NAR celebrated February’s increase in sales and inventory by stating “…more inventory and choices are releasing pent-up housing demand.” The NAR did not explain why this pent-up demand failed to show up in March. March inventory hit 1.33M, an 8.1% increase month-over-month and up 19.8% year-over-year. According to the NAR, “unsold inventory sits at a 4.0-month supply at the current sales pace, up from 3.5 months in February and 3.2 months in March 2024.” The months of supply and absolute inventory have now increased for three consecutive months and is increasing as I expected for this spring selling season.
Once again, the surge in inventories did not cool off pricing pressures. Year-over-year pricing jumped again despite the surge in year-over-year inventories. The median sales price of an existing home increased 1.7% from February to $403,700 and increased 2.9% year-over-year. This 21st straight year-over-year increase represents the relentless march that soon will take the median price above last June’s record high of $426,900.
Interestingly, for the second straight month and third or fourth time in the past year, the NAR took the side of existing home owners when describing upward price pressures. This time around the NAR blended in a nod to a marginal improvement in affordability relative to aggregate wage gains.
“In a stark contrast to the stock and bond markets, household wealth in residential real estate continues to reach new heights…A small deceleration in home price gains, which was slightly below wage-growth increases in March, would be a welcome improvement for affordability.”
The average time on the market for an existing home decreased from 42 days in February to 36 days in March. While the spring selling season featured a sequential decline in time on the market, the year-over-year increase from 33 days seems to confirm a more sluggish seasonal market.
The share of sales going to first-time home buyers continued some upward momentum. These sales increased from a 28% share in January to 31% in February and now 32% in March, flat with a year ago (for the second month in a row). The NAR’s 2017 Profile of Home Buyers and Sellers reported an average of 34% for 2017, 33% for 2018, 33% for 2019, 31% for 2020, 34% for 2021, 26% for 2022, 32% for 2023, and a plunge to an all-time low of 24% in 2024.
The West flipped from being a large contributor to sequential sales gains in February to the largest contributor to the sequential sales decline. Weakness in the South further weighed on the numbers. Following a flat performance in January, the South was a large drag on year-over-year sales. The regional year-over-year changes were: Northeast 0%, Midwest -3.1%, South -4.2%, West +1.3%.
Single-family existing home sales decreased 6.4% from February to 3.64M in March and decreased by 2.2% year-over-year. The median price of a single-family home was $408,000, up 2.9% year-over-year and up 1.8% month-over-month.
California Existing Home Sales – March, 2025
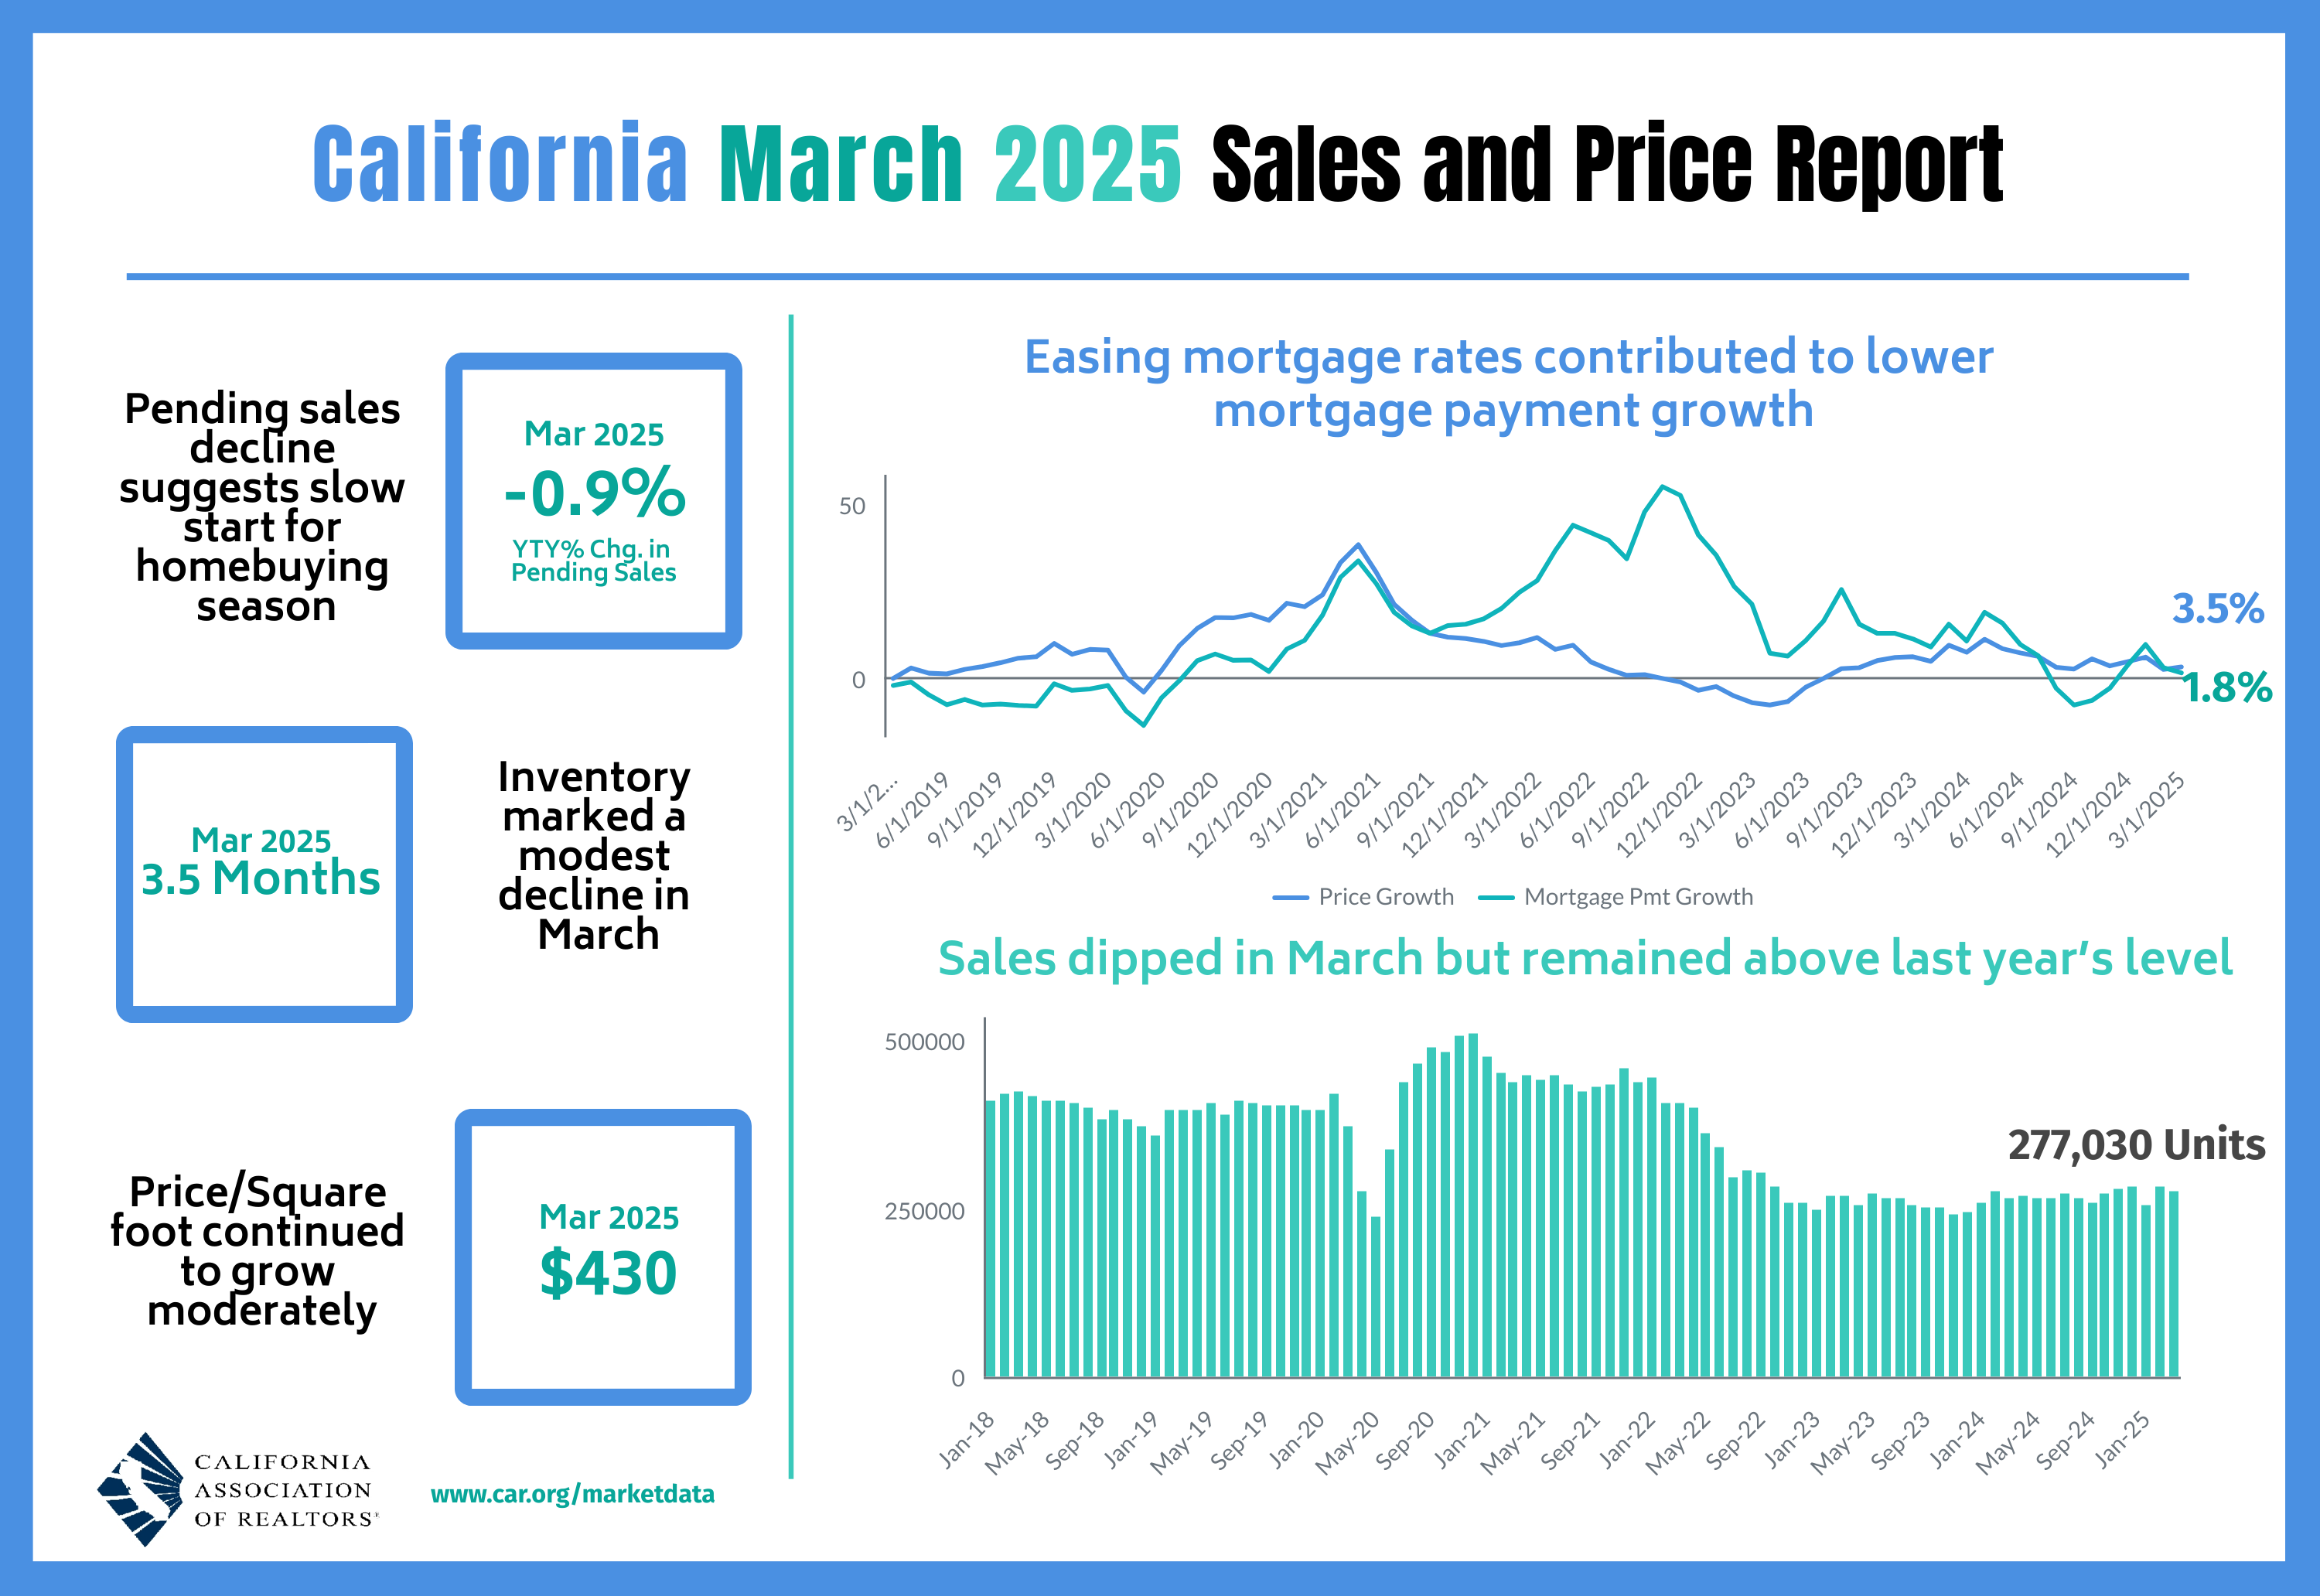
California’s existing home sales numbers ended a burst of volatility. Sales plunged 10.0% from December to January, surged 11.6% from January to February, and declined 2.3% from February to March. The 277,030 in sales is up 4.9% year-over-year. California managed to outperform the West region as a whole, but the California Association of Realtors (C.A.R.) still lamented that “with tariff threats and recession fears growing and home buyer optimism fading, home sales could remain soft in the months ahead.” The C.A.R. also blamed “fluctuating mortgage rates” for a fourth straight drop in pending home sales.
The median price soared 6.7% month-over-month and increased 3.5% year-over-year, marking the 21st month in a row with a year-over-year gain. The median price per square foot only increased 1.4% year-over-year. The C.A.R. once again took some solace in the slower pace of price gains. They characterized the “continued improvement” as “mild”. Moreover, “the monthly improvement was slightly below the 10-year historical average increase of 7.7 percent recorded between February and March”.
California’s housing supply continues to expand. March’s total active listings rose at the fastest pace since January 2023 on a year-over-year basis. Total active listings last month also hit a six-month high and a 14th straight month of year-over-year gains.
Seasonal patterns kicked in for the Unsold Inventory Index (UII) (the number of months needed to sell the supply of homes on the market at the current sales rate). The UII dropped from 4.0 months of supply to 3.5 months but is up significantly from 2.4 months of supply a year ago.
The median time on market increased year-over-year from 18 to 22. The C.A.R.’s statewide sales-price-to-list-price ratio was flat year-over at 100.0%.
Home closing thoughts
Homeownership At A Post-Pandemic Low
Inventory remains relatively scarce and prices are high, so no wonder the rate of homeownership topped out in 2023 well short of the 2004 high. Twenty-one years ago, a little over 69.2% of households owned a home in the U.S. Two years ago, this rate topped out at 66%. A year ago, the homeownership rate dropped to a post-pandemic low of 65.1%. In reporting on this declining rate of homeownership, the National Association of Homebuilders also pointed out that the only demographic to increase its homeownership was the 65 and over age range. With the housing market slowing down, I expect the ownership data to keep declining over time.
A Near Record Share of Sellers Giving Concessions
As the existing home sales market experiences a slow spring selling season and economic uncertainty soars, sellers are apparently falling over themselves to entice buyers with concessions. According to Redfin, a near record share of sellers provided buyers with something to help reduce the buyer’s total purchase cost. The share actually dropped slightly to 44.4% in March from February’s 44.8%. The record is 45.1% from February, 2023. These concessions are also consistent with what Redfin reports as the slowest pace of homes selling since 2019.
A Strong Start to Spring in Westchester County, New York
While the national market for existing homes grinds slower, a cousin in Westchester County is regaling me with amazing tales of homes selling above asking as soon as they hit the market. Sellers in the county are flooded with bids. I decided to examine the local market data for some confirmation of what is going on. The stories seemed to stand out like an anomaly given the Northeast as a whole has had stagnant existing home sales for most of the years since 2010 or 2011 (see the last line in the chart below).

According to the Hudson Gateway Association of REALTORS® (HGAR), Westchester county indeed experienced a mini-boom in March. Sales soared 13.8% year-over-year in March alongside a price surge of 11.0%. At the same time, the inventory of homes for sale shrank 6.7% (even as new listings jumped 15.5% year-over-year). Thus the market is experiencing quite a squeeze! Still, the time on market increased from 54 to 59 days. So while the percent of original list price received edged up from 100.9% a year ago to 101.3%, the average buyer is taking their time. The buyers near my cousin are particularly eager and antsy.
Since the March market looks significantly different from the February market, I am assuming Westchester County is experiencing a particularly strong start to the spring selling season unlike much of the country.
Spotlight on Mortgage Rates
The Mortgage Bankers Association (MBA) reported weekly decreases for three straight weeks after the first week delivered an increase in mortgage applications. The 23-month streak of strong year-over-year performances in new home mortgage purchase applications came to an end in January with a 6% decrease, and continued their decline with another 6.9% decline in February. March delivered a fresh rebound with a 5.5% year-over-year increase in mortgage applications.
Mortgage rates have topped at 7%, but they also stopped going down across March and April. With economic uncertainty increasing volatility in the bond market, mortgage rates actually increased over the last two weeks. Mortgage rates look stuck around current levels as I expected given persistent inflationary pressures tug and pull with on-going economic chaos and tariff drama in the U.S.
![Freddie Mac, 30-Year Fixed Rate Mortgage Average in the United States [MORTGAGE30US], retrieved from FRED, Federal Reserve Bank of St. Louis; April 28, 2025](https://drduru.com/onetwentytwo/wp-content/uploads/2025/04/20250428_30-Year-Fixed-Rate-Mortgage-Average-in-the-United-States.png)
Be careful out there!
Full disclosure: long ITB shares
Westchester County is not the only seller’s market. Central and eastern Massachusetts are likewise. The prevalent sequence here is that a single-family detached home is listed midweek specifying Open House 3-hour periods on the subsequent Saturday and Sunday, with a deadline for bids of noon the following Tuesday. Tuesday afternoon the listing status changes to “Bid accepted, awaiting closing”, and the sale closes within two months. More than half the closing prices are above the ask.
This is mostly due to an acute shortage of homes for sale relative to demand. Trying to address this, last year the MA government legislated an override of “overly restrictive” municipal zoning practices, which put in motion some new multi-family housing projects. Those should absorb some lower-end demand next year.
Personally I expect by the time new supply arrives a significant national/global recession will have reduced buying pressure. I expect time-on-market to increase to reflect that pair, but I expect mortgage rates to stay elevated due to stagflation, and consequently home prices to stay flat-ish.
Of course, the magnitude of the supply and demand forces, as well as unpredictable actions by states, the White House, and the Fed, will determine the actual outcome. I will never forget the chaos caused by stagflation responses in the 1970s: first Nixon’s wage and price controls, then Volker’s double-digit interest rates.
I will look into central and eastern MA markets next!
The race to stagflation has definitely started. I’m gulping hard. Amazing how much MORE government interference we have in the economy right now.