Stock Market Commentary
The stock market looked ready to follow through on leaving its troubles behind. The S&P 500 even made a new all-time high. Everything seemed to fall apart on Friday. The final release of consumer expectations as measured by the University Michigan confirmed earlier preliminary numbers: inflation expectations soared and consumer sentiment tanked. This bad news coincided with the third bad set of housing data and a drop for the preliminary February S&P Global US Services PMI below 50 (contraction). The surprisingly sharp market response created a red flag pullback as notable individual stocks cratered and the major indices sold off to critical support levels. While the market has tended to flip sentiment and character from week-to-week, Friday’s selling looked and “smelled” like a signature statement.
The Stock Market Indices
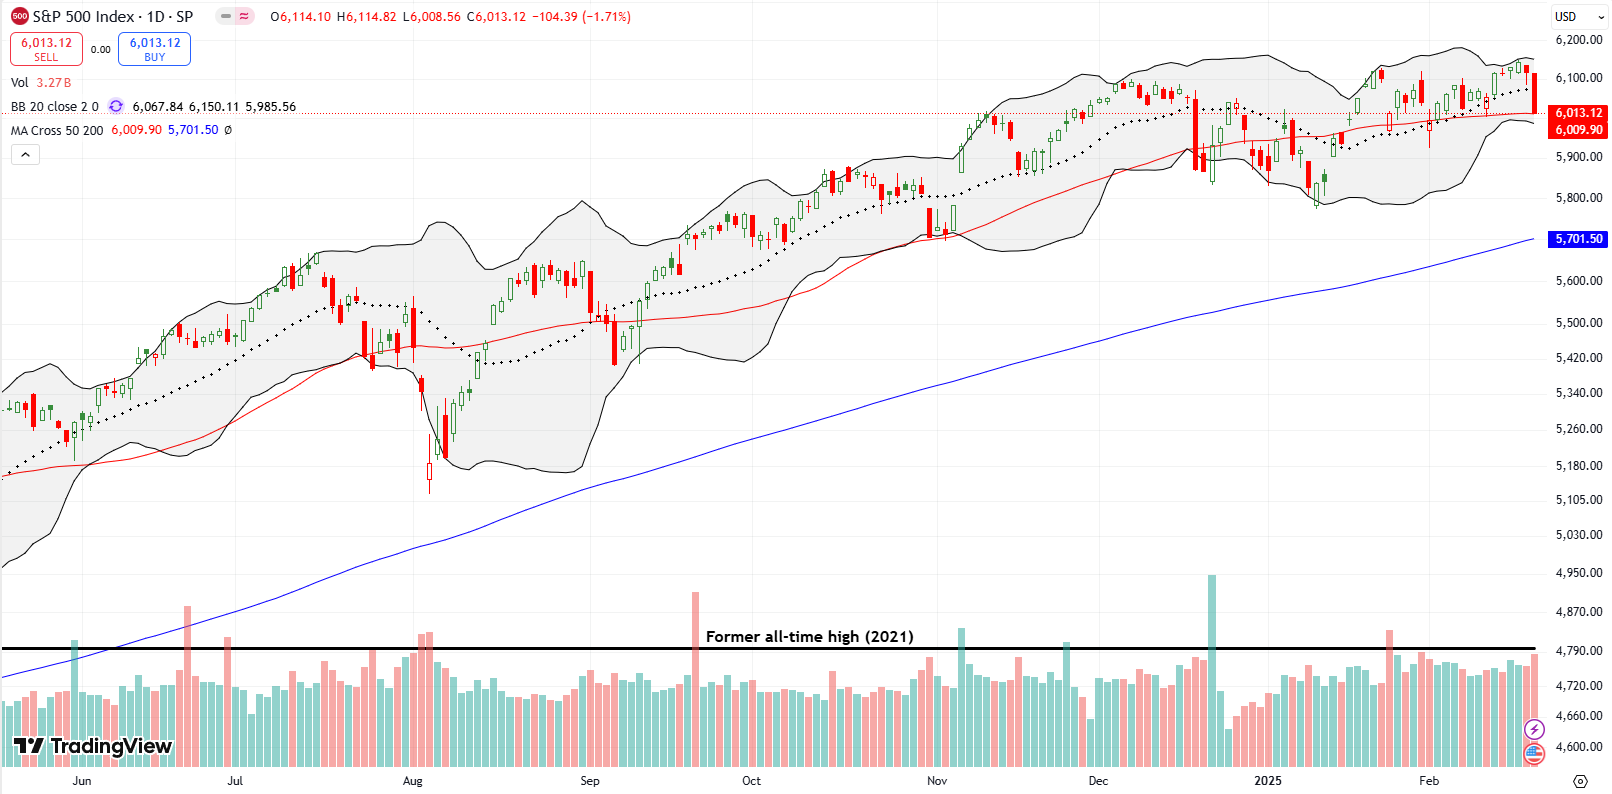
The S&P 500 (SPY) lost 1.7% to end the week right on top of support at its 50-day moving average (DMA) (the red line). Just two days prior the index set a new all-time high and looked ready to break out. This pullback is a red flag given it represents a failed breakout in the middle of a 3-month to-date period where the S&P 500 has made little net progress. The red flag becomes bearish on a close below the previous low where the index closed ever so briefly below its 50DMA.
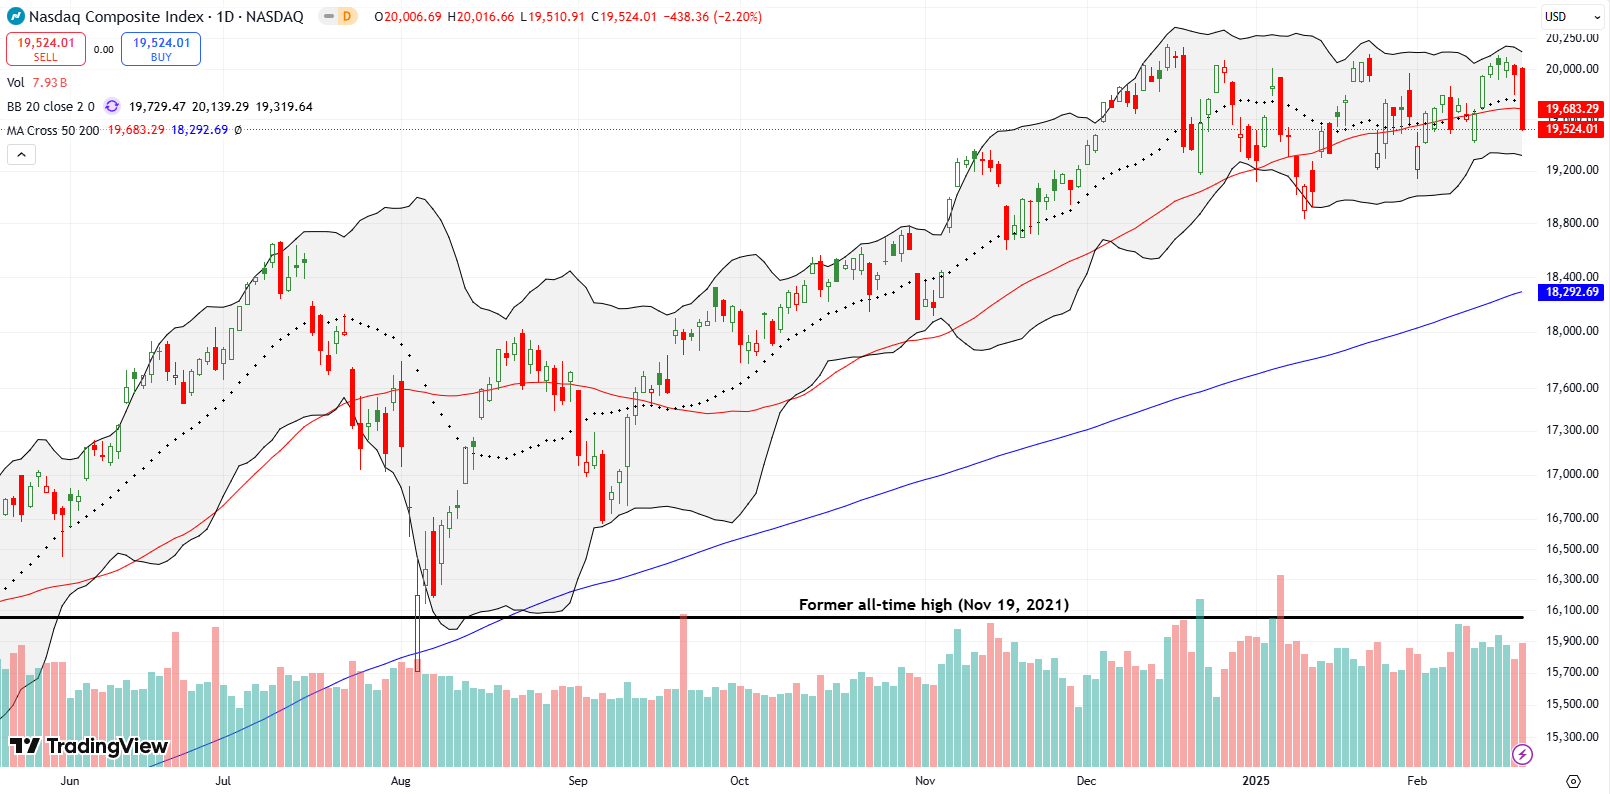
The NASDAQ (COMPQX) is waving its red flag around as a triple top has emerged for the tech-laden index. Friday’s 2.2% loss sliced right through 50DMA support and confirmed a triple top formed over the last three months. The NASDAQ becomes fully bearish on a close below the low of the year. At that point a test of 200DMA support would be in play.
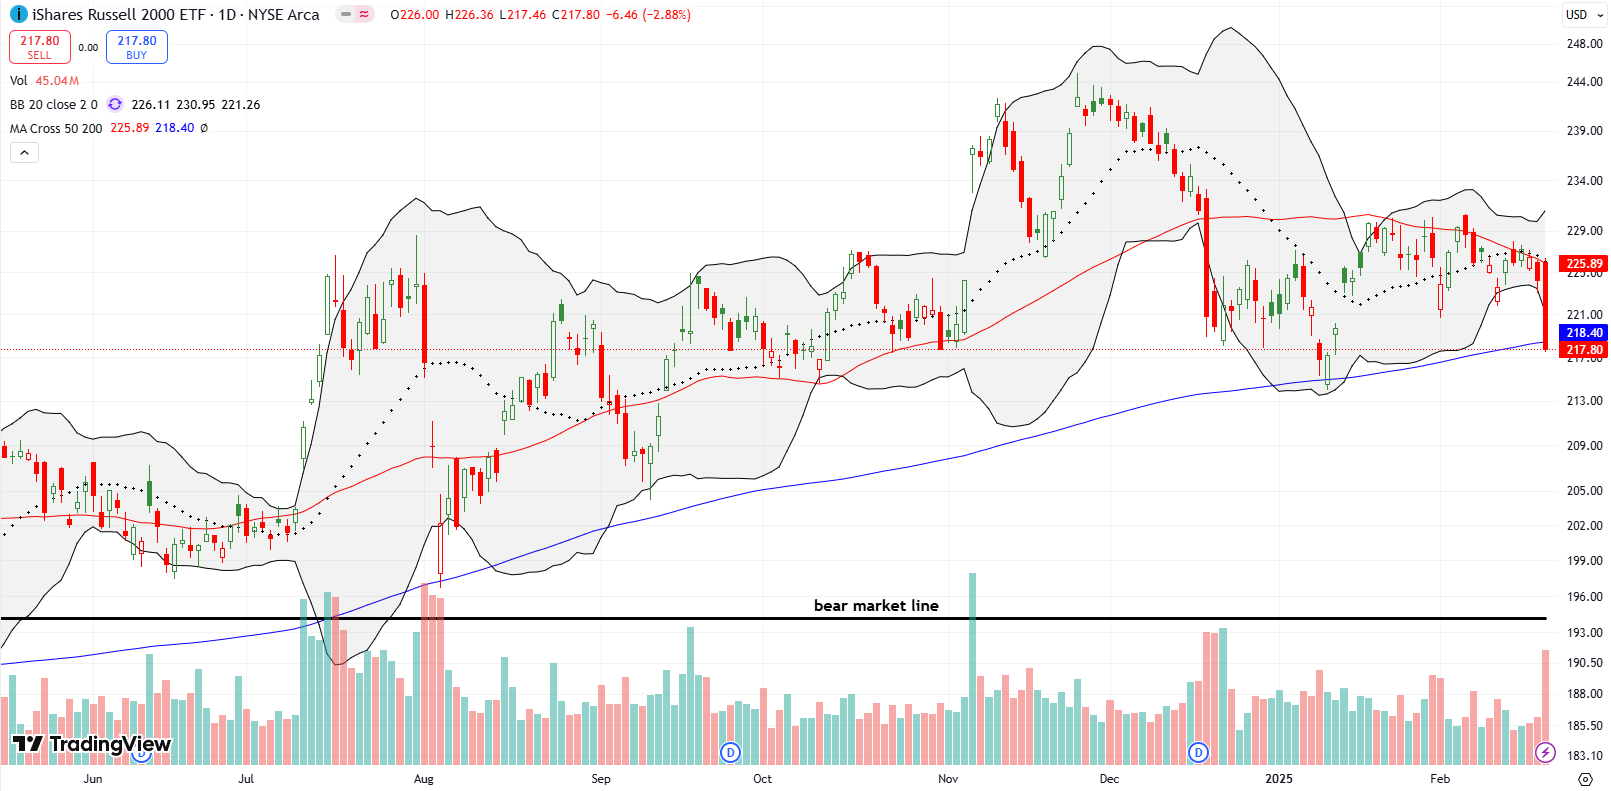
The iShares Russell 2000 ETF (IWM) extended its under-performance by losing 2.9% and closing below its 200DMA (the blue line). The red flag for IWM consists of the first close below its 200DMA in 15 months. The ETF of small caps also once again confirmed tight resistance at its now declining 50DMA. As usual, I speculated on IWM call options after a large decline. I am looking to take profits quickly on a rebound away from 200DMA support. IWM is now down 1.4% for the year.
The Short-Term Trading Call With A Red Flag Pullback
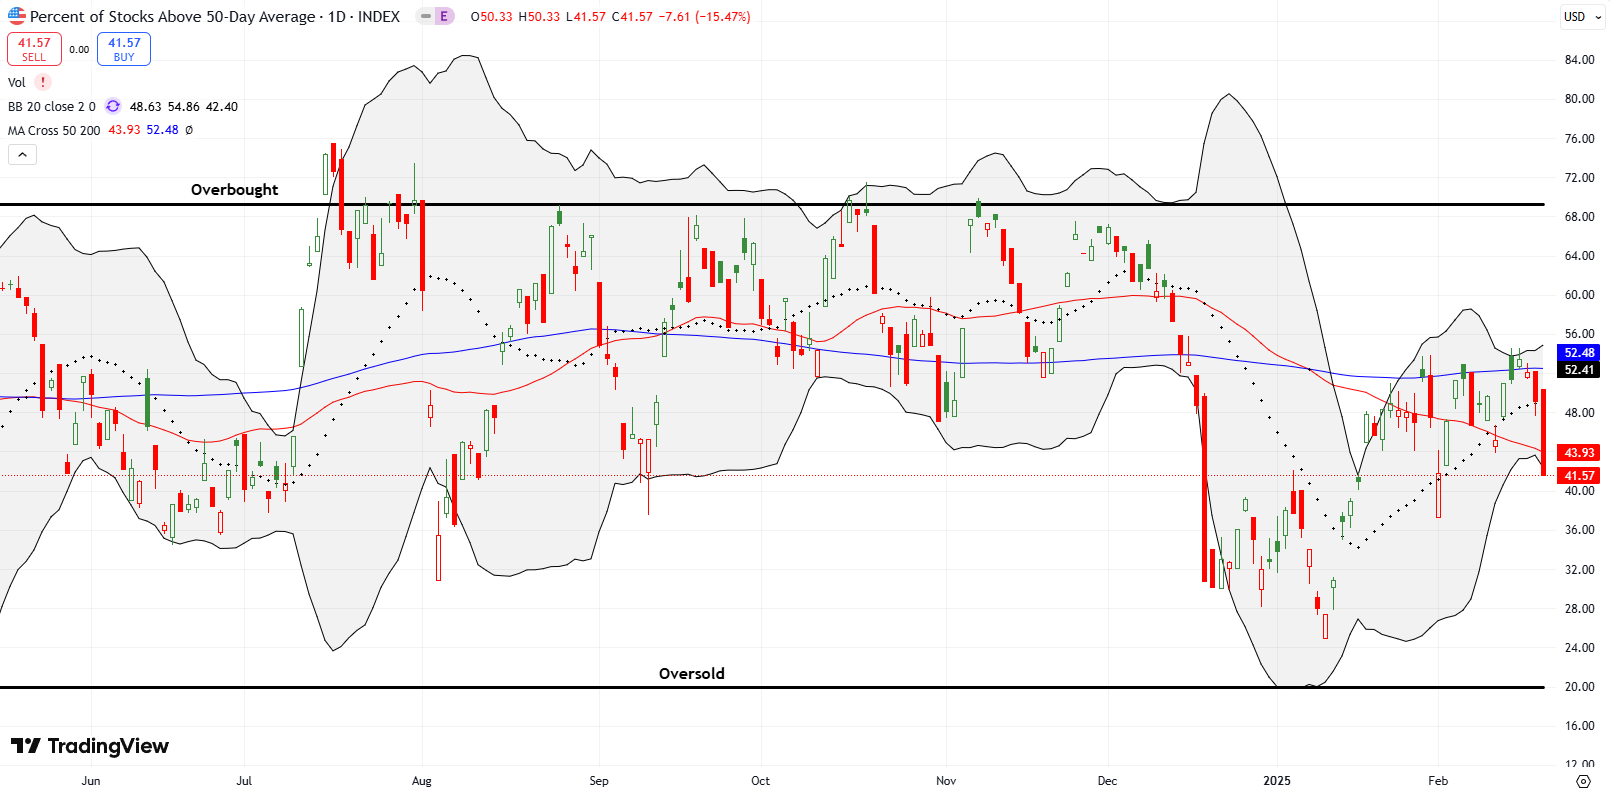
- AT50 (MMFI) = 41.6% of stocks are trading above their respective 50-day moving averages
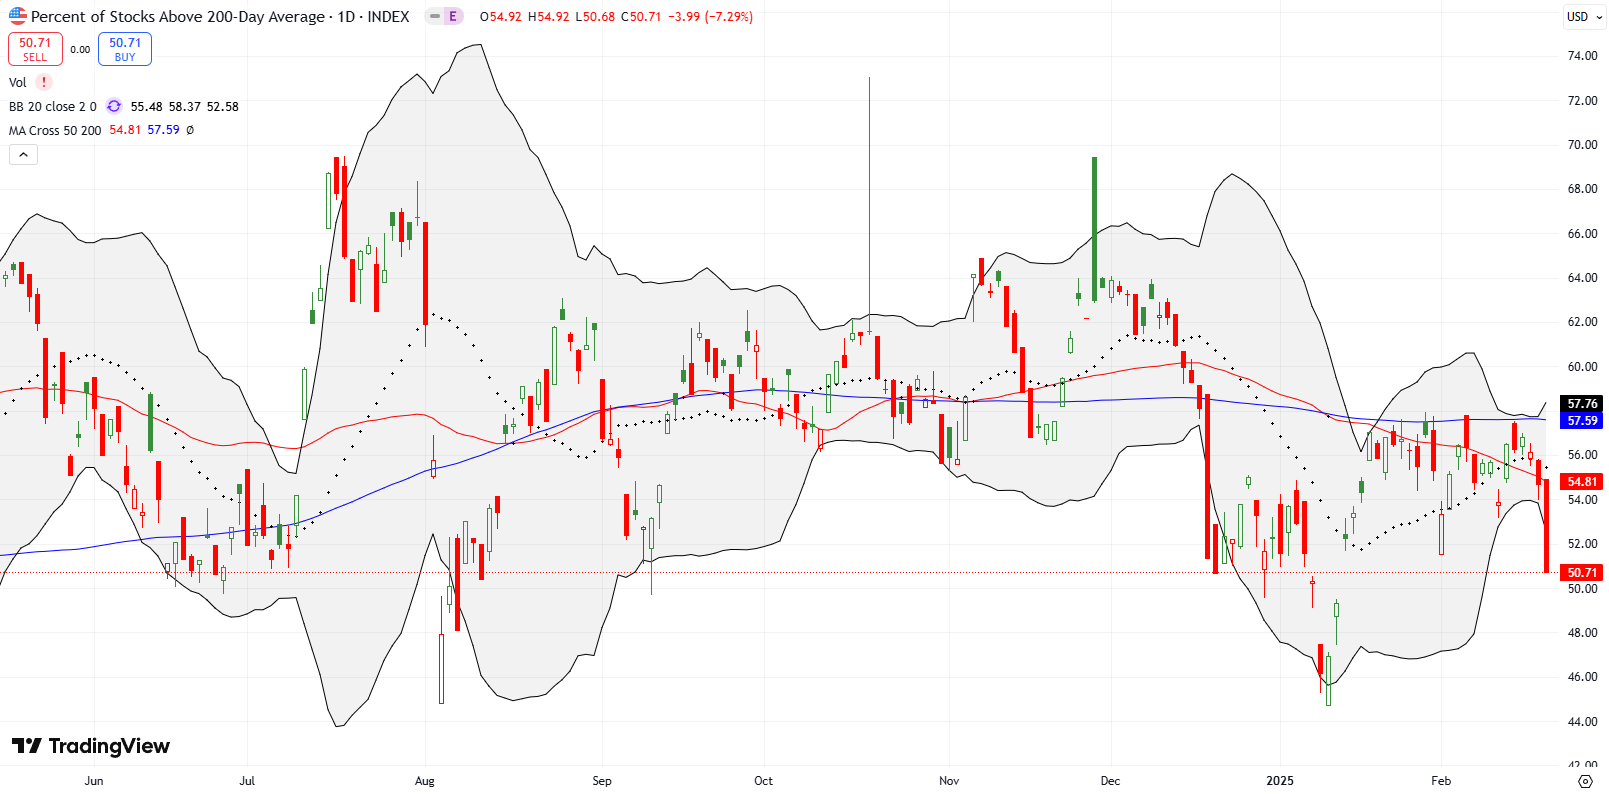
- AT200 (MMTH) = 50.7% of stocks are trading above their respective 200-day moving averages
- Short-term Trading Call: neutral
AT50 (MMFI), the percentage of stocks trading above their respective 50DMAs, closed the week at 41.6%. Friday’s nearly 8 percentage point drop ended a bid by my favorite technical indicator to break out and lead the market higher. Instead, AT50 fell to a 3-week low and looks like it will struggle to get above 55% for quite some time. This line of resistance is acting like a lower overbought threshold. This stubborn resistance is the biggest red flag of the signals from Friday.
While I am deeply concerned by the various red flags from Friday, I am maintaining a neutral short-term trading call. I am keenly aware that this bull market has triggered numerous warnings and ominous signs only to set up invalidations in short order. This time could be the same old story. Thus, I can only get bearish on key confirmations as described above. In the meantime, I am finding numerous bearish individual stocks that are not likely to participate much in a coming rebound.
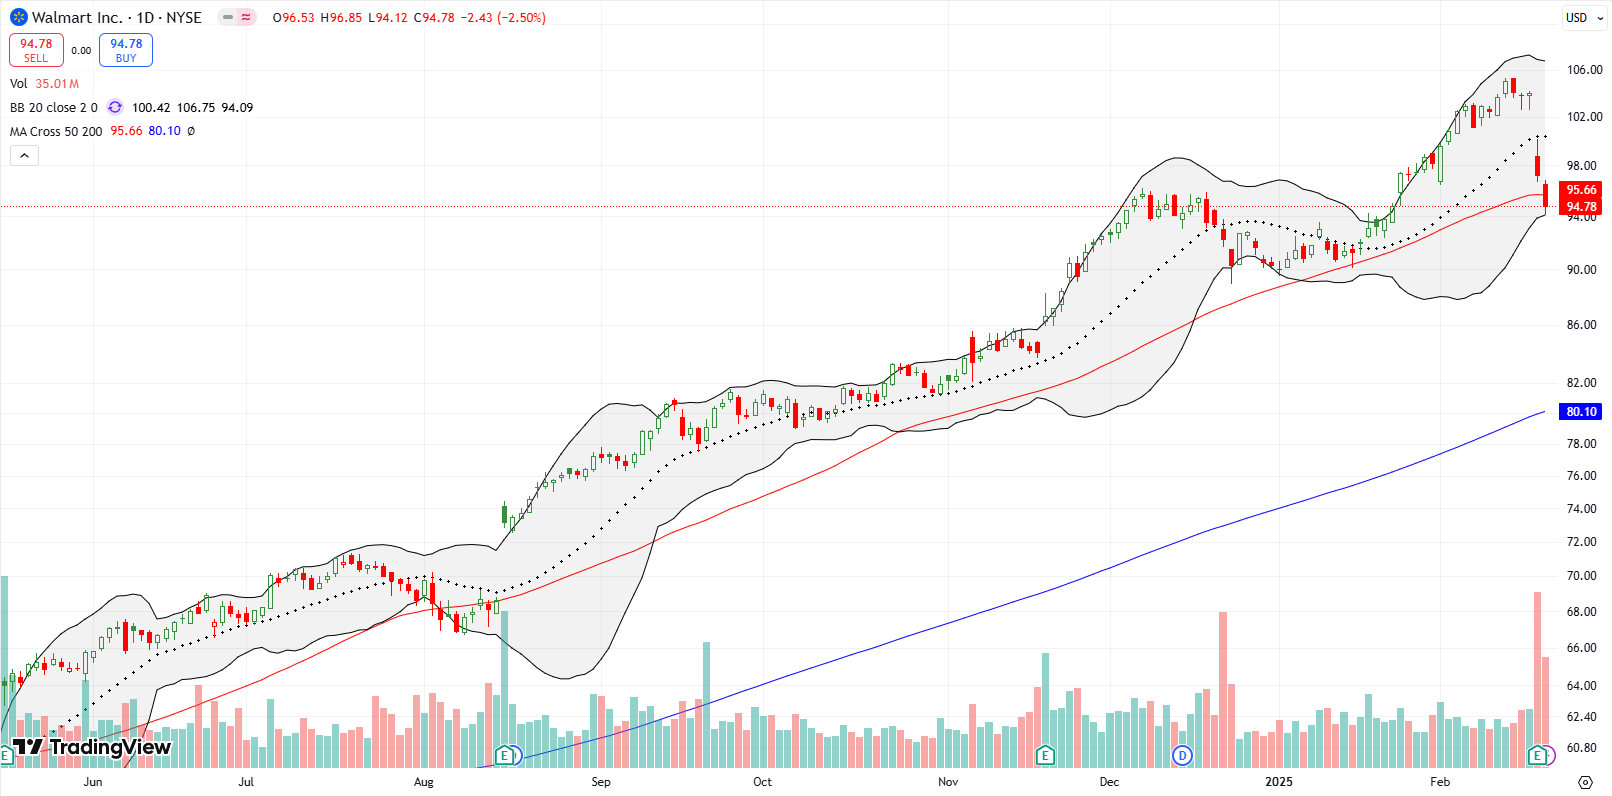
Walmart Inc (WMT) has been a darling retail stock. The chart below shows a very neat and orderly extended uptrend. A 6.5% post-earnings drop disturbed the peaceful drift. Sellers followed through with a 50DMA breakdown. A lower close will confirm the red flag for WMT. While I would not dare short WMT, this breakdown could be the beginning of a bigger pullback for retailers and other stocks dependent on strong consumer spending. (Note, the SPDR S&P Retail ETF (XRT) plunged below its 200DMA on Friday on a 3.1% loss).
WMT is a particularly dangerous stock because buyers have piled in despite an extremely high valuation. For example, WMT has a forward P/E (GAAP) of 36.2, 33% above its 5-year average. Across the board WMT is 30-50% and more higher than its 5-year average in valuation metrics. Moreover, WMT is only growing revenue in the mid single digits. Once sentiment turns on such expensive stocks, the selling and exits can turn quite steep and abrupt!
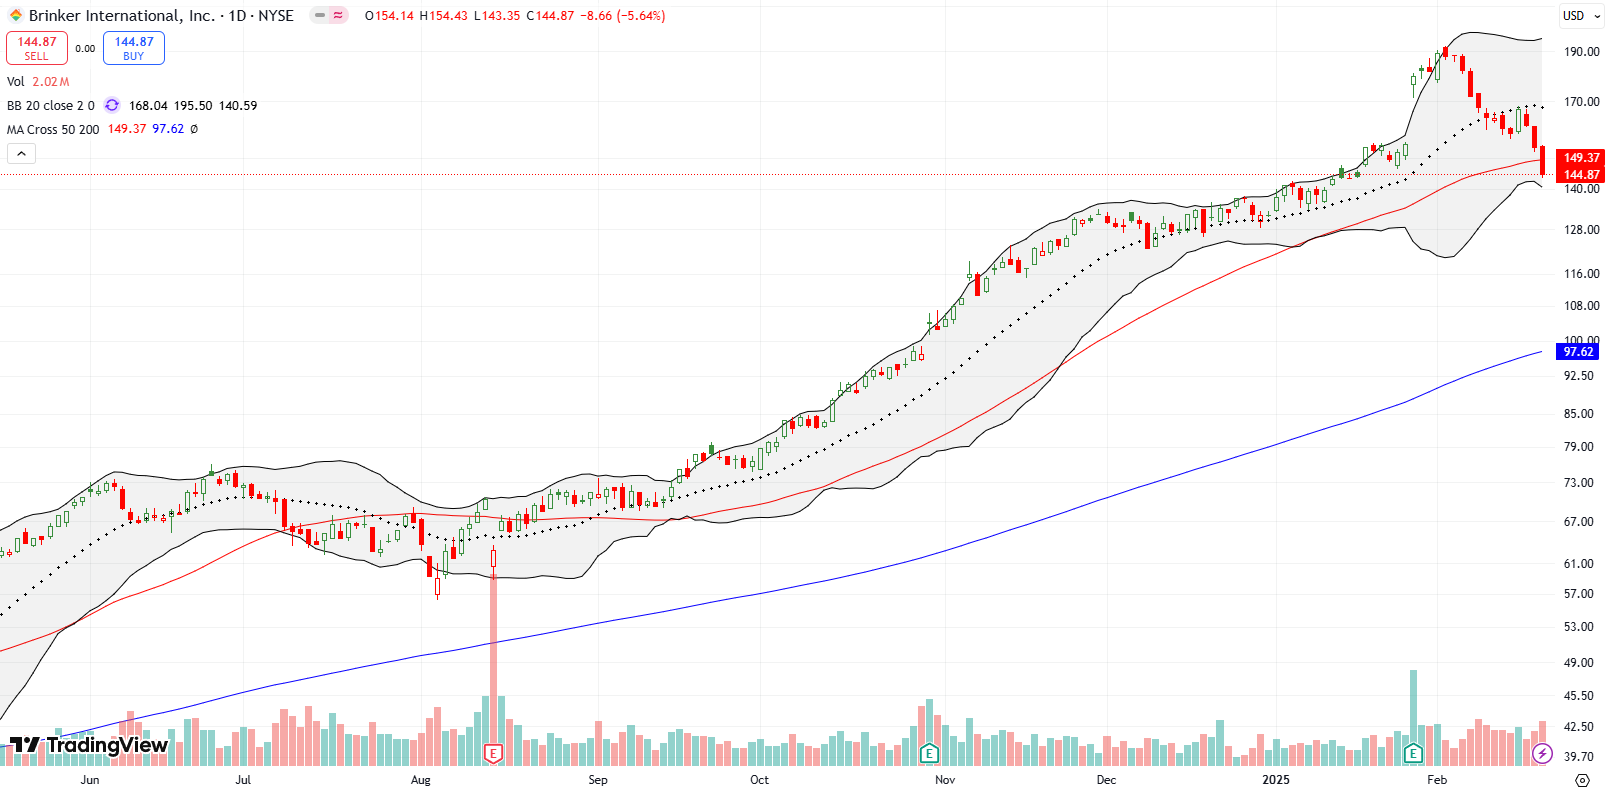
Brinker International, Inc (EAT) somehow became a darling casual dining stock. Like WMT, its valuation has thus become quite elevated. A full reversal of the last post-earnings gains combined with a 50DMA breakdown last week waves a huge red flag for EAT. I even rushed into a March $135/$120 put spread for EAT in anticipation of some kind of extended drift lower. Eventually, EAT could (should?) fill the gap from October earnings.
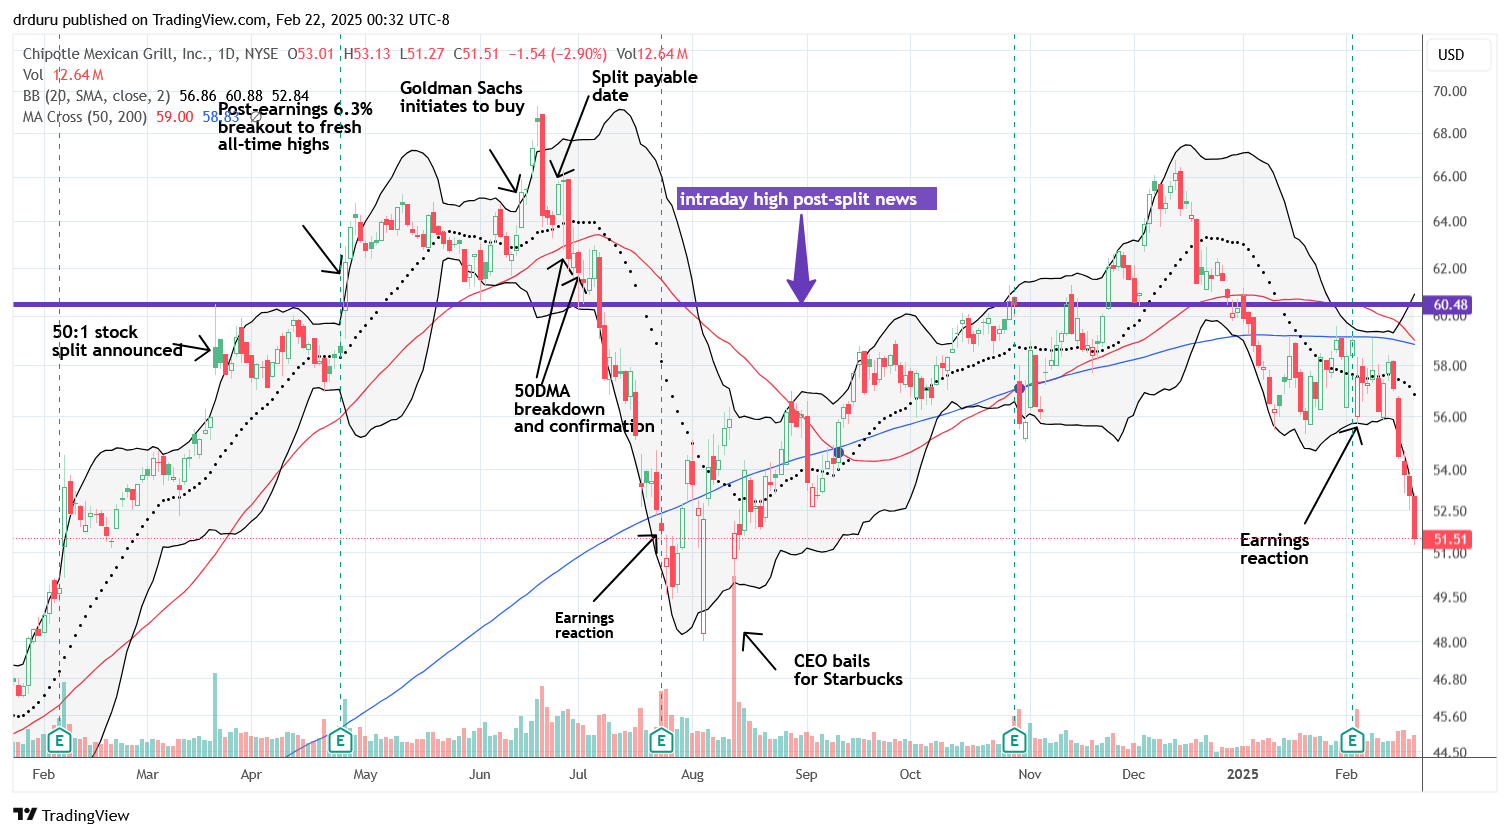
What makes me think EAT is in for extended trouble is seeing (former?) casual dining or fast food darlings like Chipotle Mexican Grill (CMG) falling apart. I had been optimistic about a return to glory for CMG, but last week’s persistent and steep selling waved the red flag for CMG. CMG confirmed resistance at its 200DMA after a tepid post-earnings rebound. People who bought into CMG’s stock split as a bullish catalyst are once again deep in the red. They could get squeezed out of the stock if last summer’s plunge did not already push them out. I have been trading in and out of CMG. My latest shares will of now be in the hopper for longer than I anticipated.
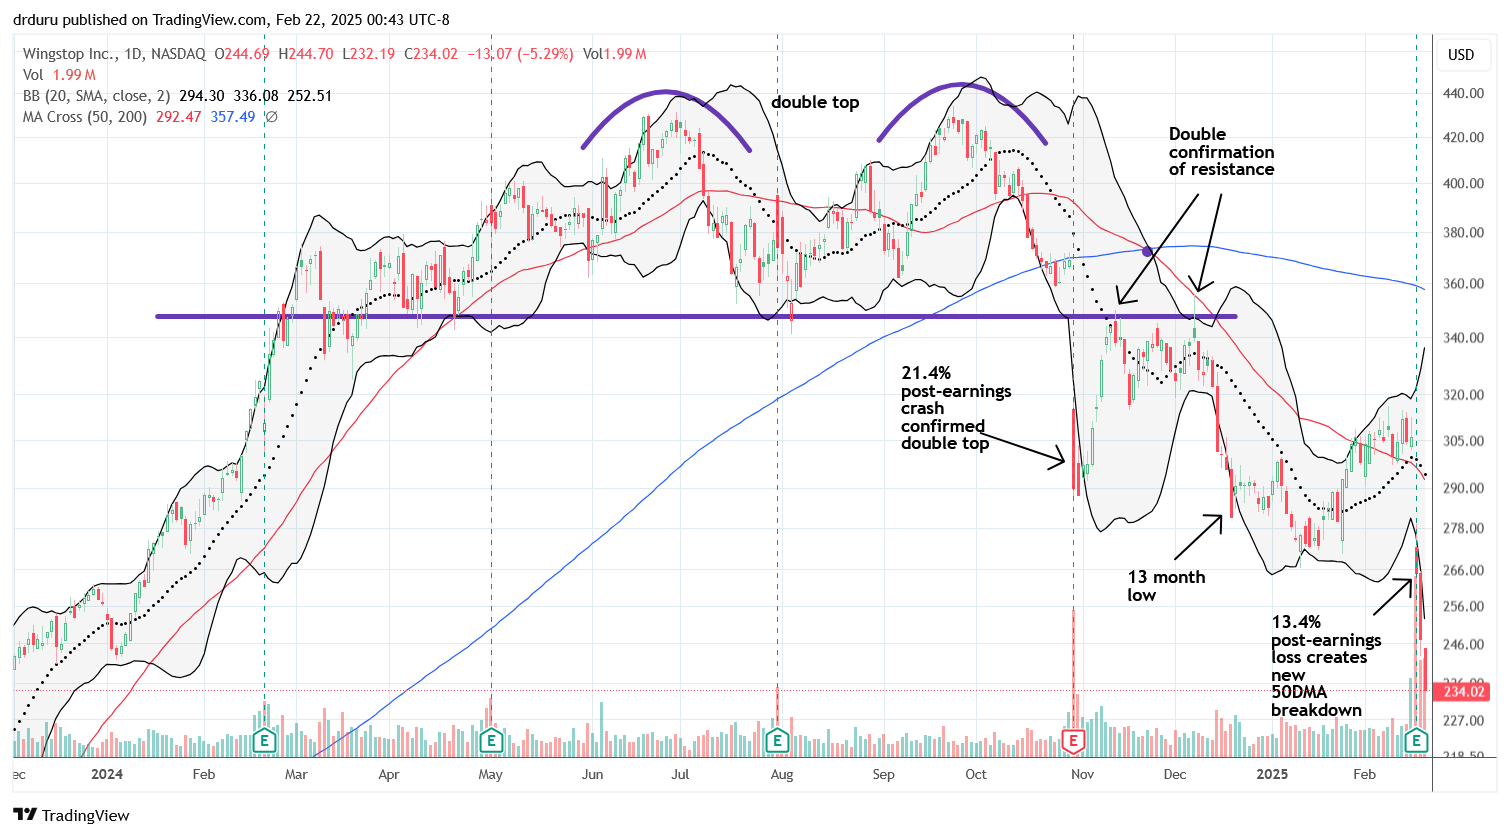
Wingstop, Inc (WING) is an example of how quickly a darling can collapse once it loses favor. WING is now down 45% from its all-time high after waving the classic red flag of a double top across last summer and fall. In early January, I lamented missing the bearish signals and decided to fade a test of 50DMA resistance. However, by the time WING tested 50DMA resistance, earnings loomed. As it turned out WING broke out above its 50DMA just ahead of earnings and created another bull trap. The stock lost 13.4% post-earnings and now trades at a 15-month low. While I would love to chase WING lower, the stock is now over-stretched below its lower Bollinger Band (BB) and is thus a very risky short. Since WING still has a lot of strong buy ratings and even a $480 upside price target, I am assuming there should be at least one more rally left to fade.
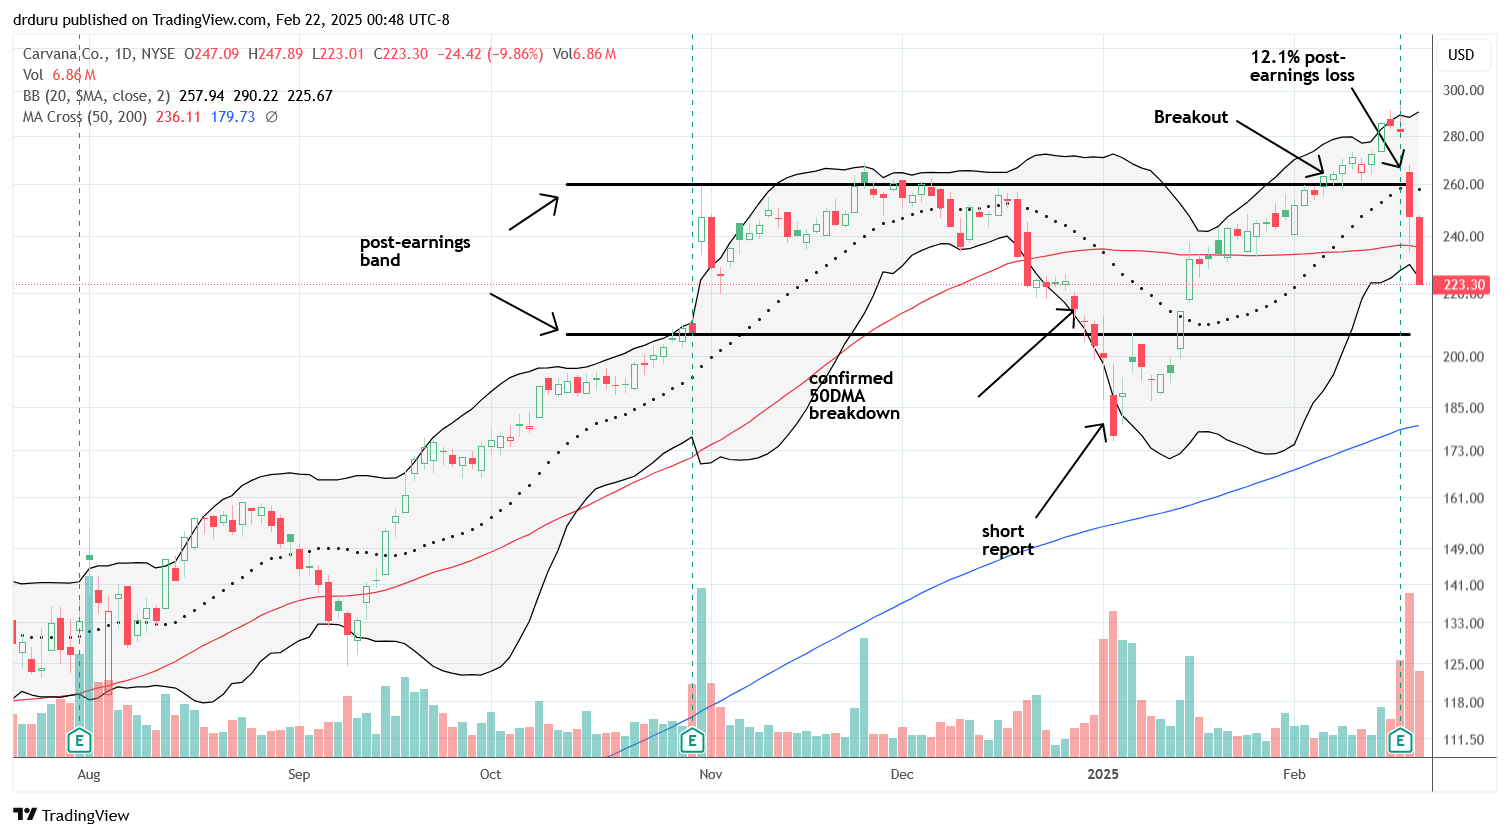
Carvana Co. (CVNA) last bottomed right after a short (bearish) report caused a big storm. With classic bear trap action, the stock sharply rallied from that point. Last week, A 12.1% post-earnings drop brought the momentum to a halt. Sellers added a 9.9% loss the next day to underline the change in fortunes. Now CVNA is below its 50DMA again and looks likely to at least test the bottom of the previous post-earnings band. A test of 200DMA support is long overdue. CVNA last touched that long-term trendline nearly 2 years ago with a close call along the way. Over a month ago, I bought a June $125/$100 put spread as a very speculative position on big downside risks.
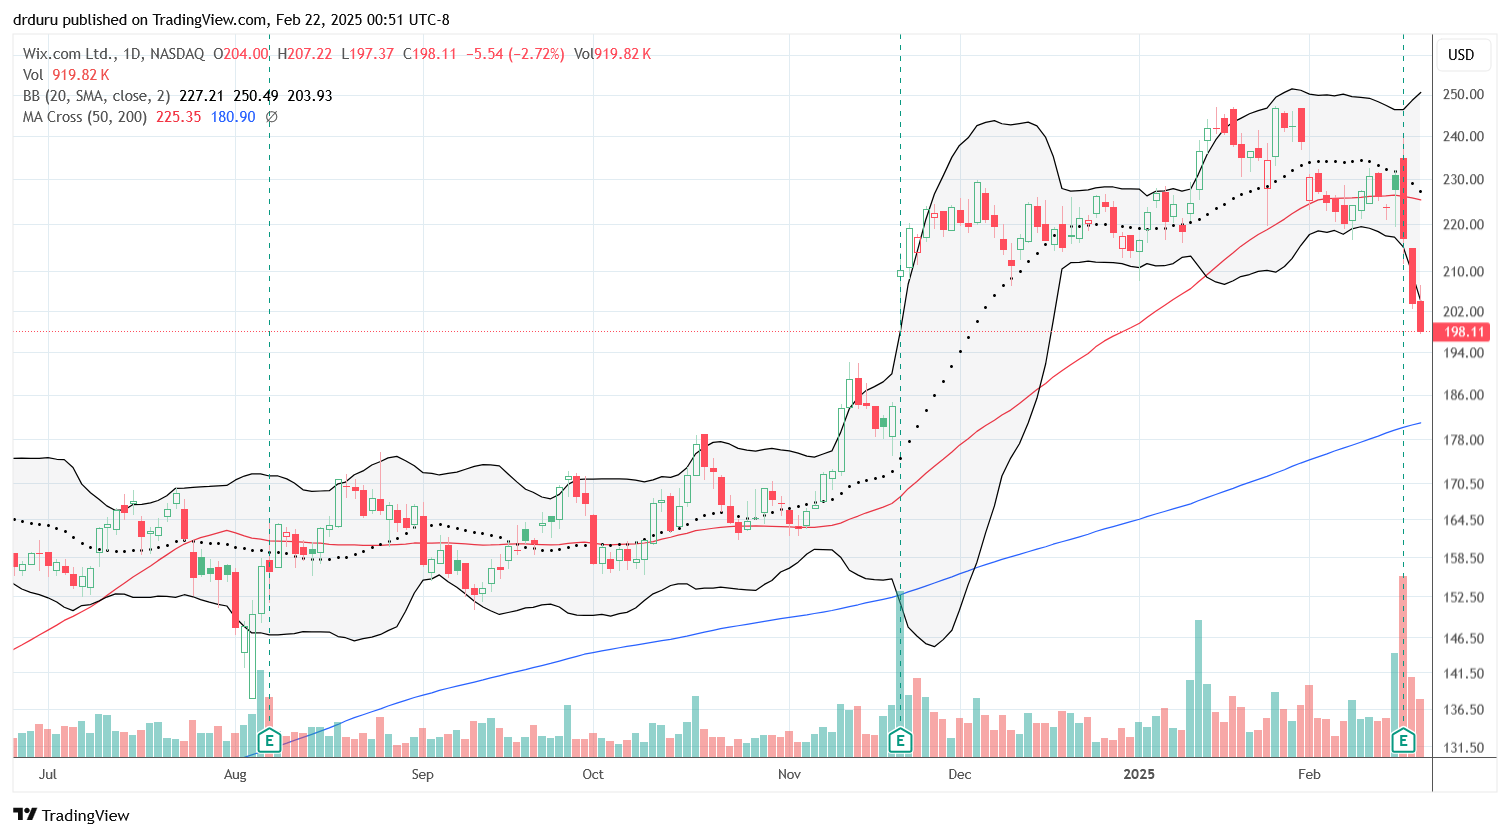
Web site platform Wix.com Ltd (WIX) lost 4.7% post-earnings on Wednesday and created a kind of bearish engulfing pattern on the way to a 50DMA breakdown. That double-whammy of a red flag convinced me to jump into a short position. Two subsequent closes below the lower Bollinger Band confirmed a bearish change in the stock’s behavior but also placed WIX in an over-stretched position. Thus WIX could experience a sharp relief rally at any time. I am on alert to close out my position at the first sign of a relief rally.
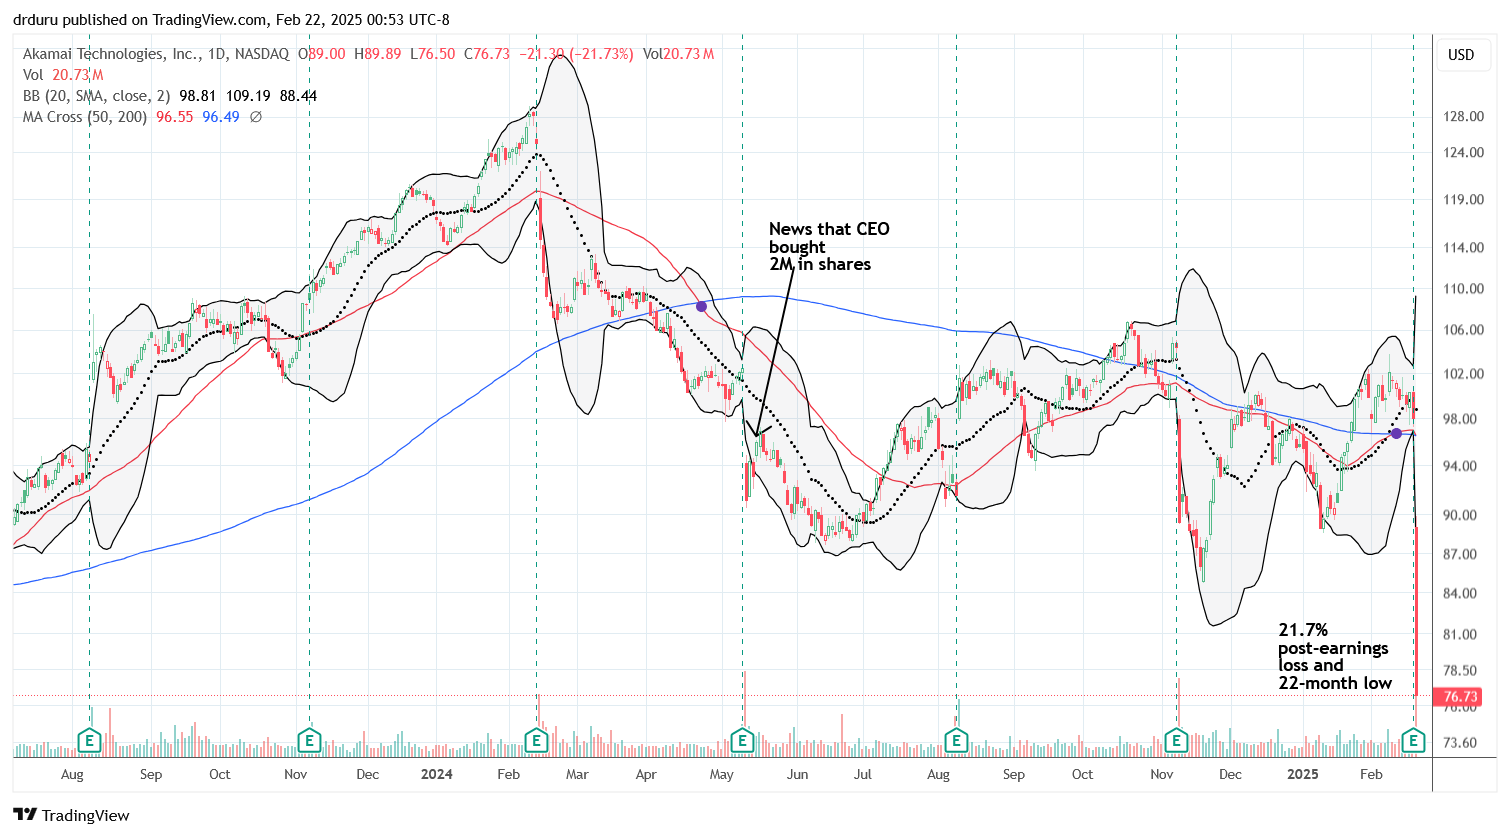
Akami Technologies, Inc (AKAM) is a classic example of why there are so few individual stocks I am comfortable holding beyond a trade. I had a very simple thesis for AKAM with CEO share purchases sitting firmly in the center of my justification. When AKAM disappointed investors last November, I held on for dear life. AKAM rewarded my stubbornness after the stock recovered all its losses. Thus, I felt very comfortable (aka complacent!) going into earnings last week with sitting on my gains. AKAM was even in a good technical position levitating above converged 50 and 200DMA support.
Unfortunately, somehow AKAM disappointed investors yet again. This time the punishment was even more severe with a massive 21.7% post-earnings loss to a 22-month low. I am still unwilling to sell into a panic, but I also am weary of holding this stock. AKAM has now dropped significantly after 4 of its last 5 earnings. This red flag behavior suggests that AKAM has turned the corner in a bearish way; upside will likely be limited for quite some time. Thus, I will be all too happy to sell into the next relief rally.
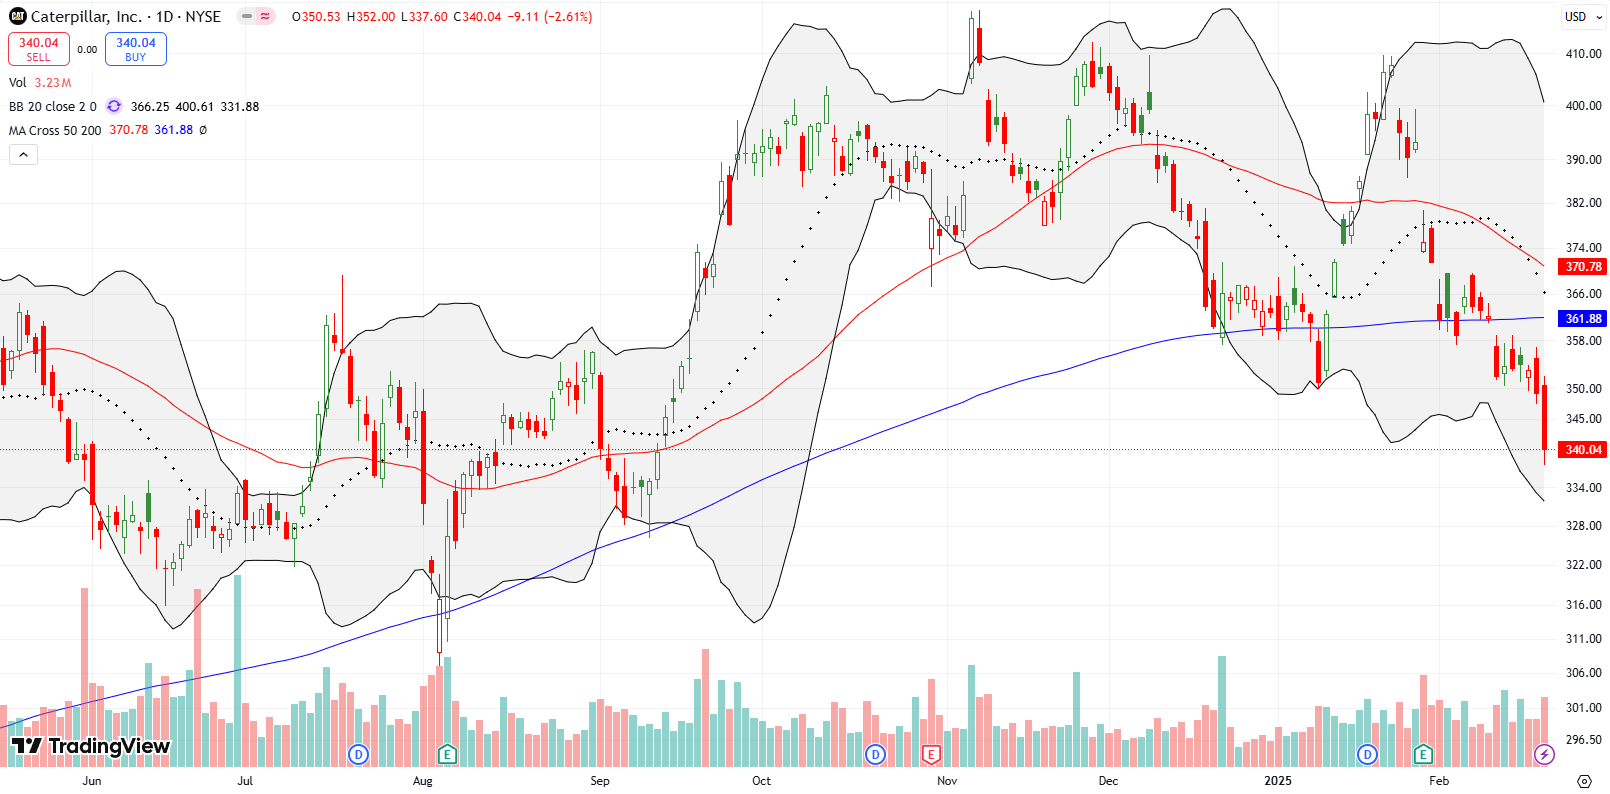
My favorite hedge against bullishness, Caterpillar, Inc (CAT), delivered as it should during a red flag pullback. I actually held until Thursday before taking profits on an earlier put spread. With a follow-through breakdown unfolding on Friday I rushed into a new put spread. The weekly $340/$330 put spread quickly became profitable going into the close of trading. With a 200DMA breakdown fully confirmed, CAT looks topped out.
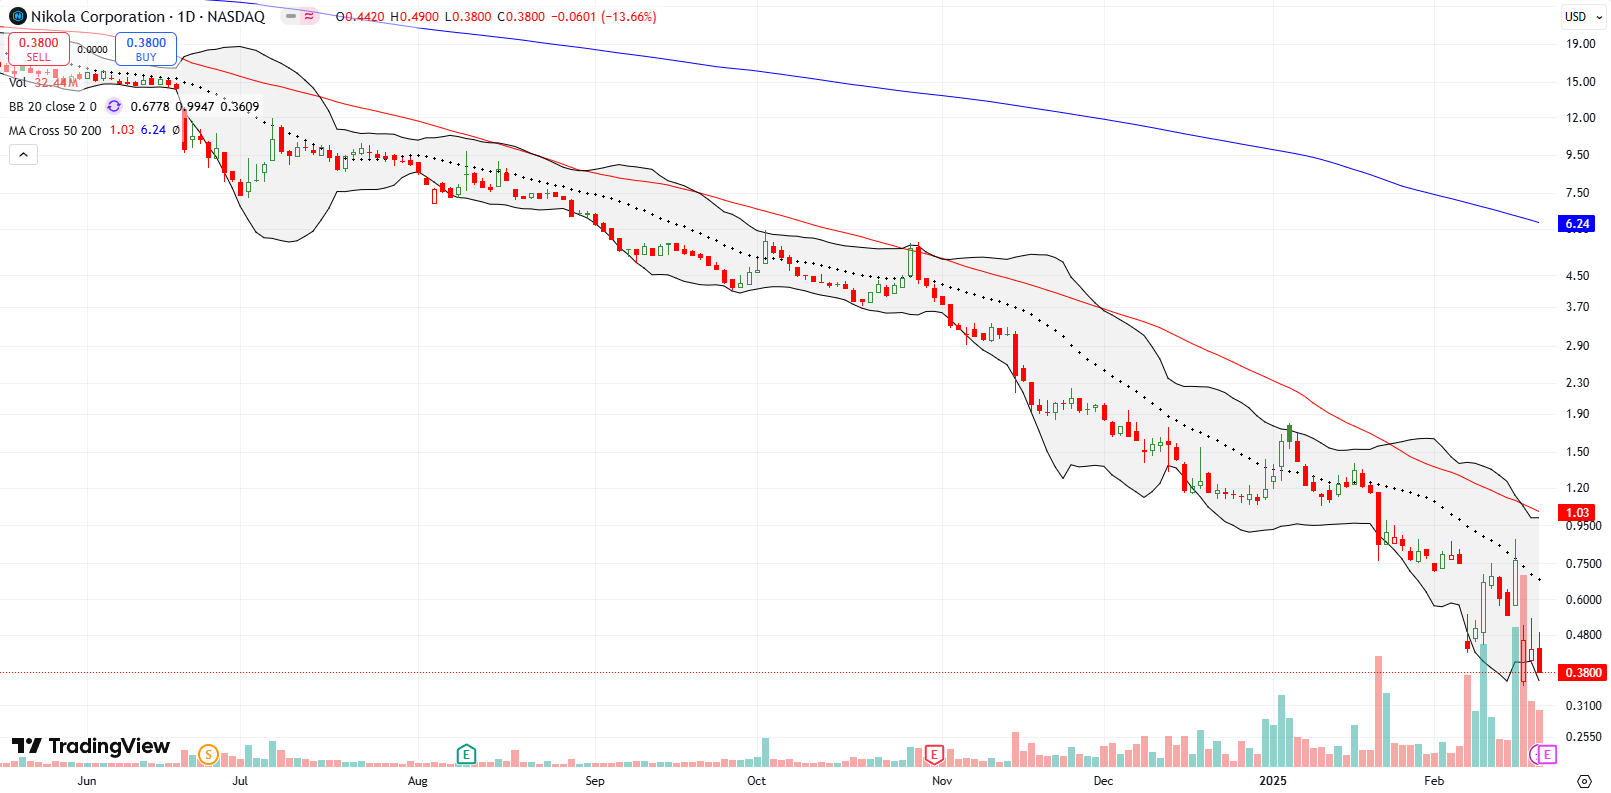
Nearly 5 years ago, I smugly thought I could deftly trade around a stock that was full of hype: hydrogen truck maker Nikola Corporation (NKLA). The stock kept trading down from there and only stopped for the periodic relief rally. I gave up well ahead of the CEO being exposed as a fraud. I am not sure how or why this company was able to continue operating or at least trading after that. The steady descent into last week’s bankruptcy news was practically inevitable. Now I look back and wish I could have figured out a way to get short and survive the inevitable squeezes. Short interest is STILL 24% of float!
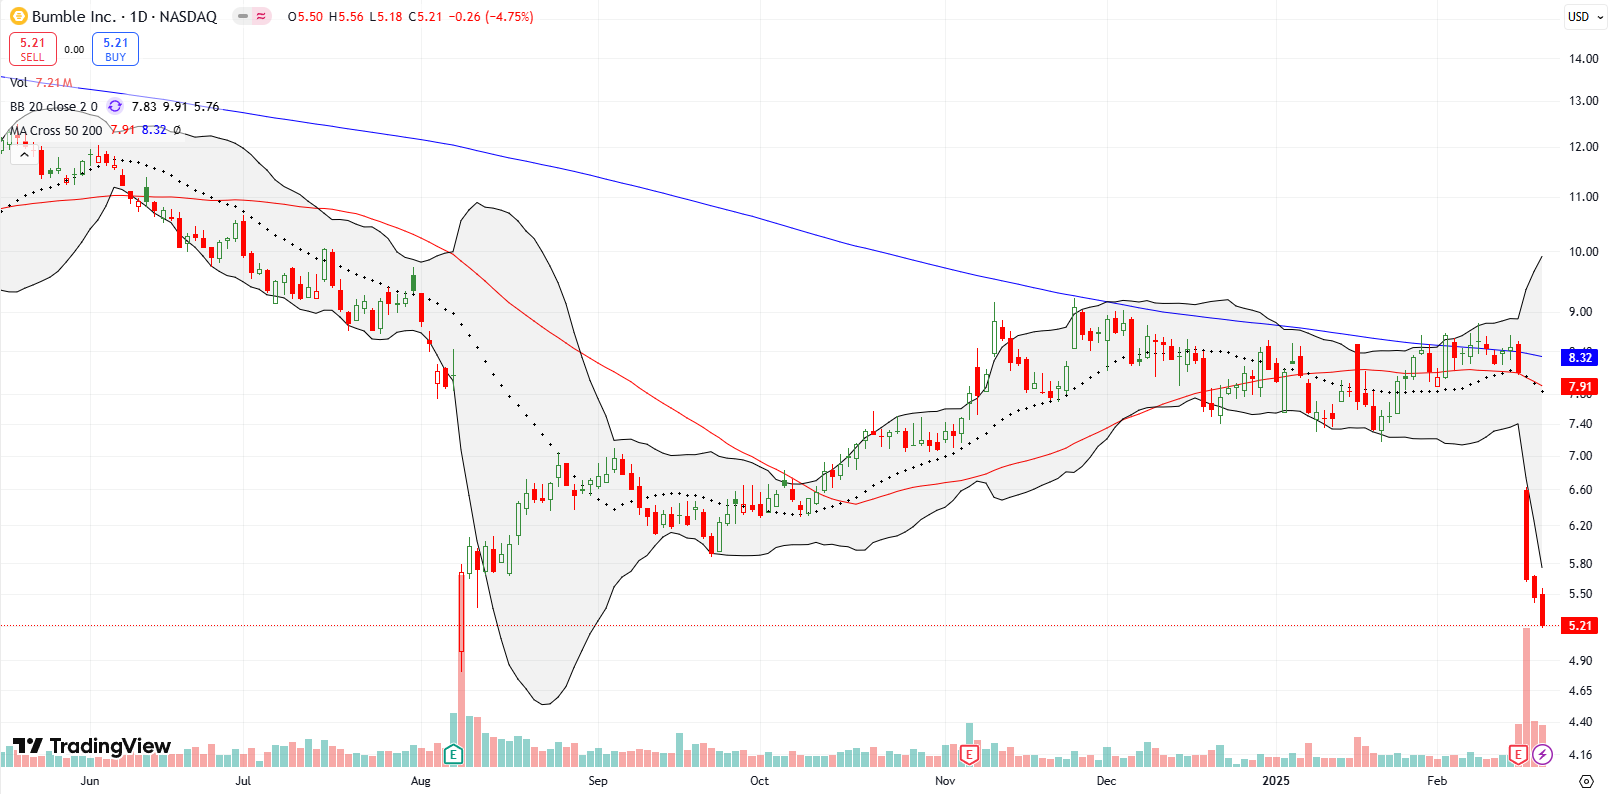
I had hopes for Bumble Inc (BMBL) as a novel kind of dating app, a community where women take charge of their dating experiences. The company and CEO received a lot of press. When I last wrote about BMBL three years ago the stock was already looking bearish. Shortly after it pulled off one last rally before returning to a long-term downtrend. The company has tried to remake itself, but it looks like another good idea that is inevitably doomed. Meanwhile, the stock just keeps losing money for investors. Last week, BMBL confirmed 200DMA resistance with a 30.3% post-earnings loss. The stock ended the week at an all-time closing low. At this pace, BMBL will become a “zombie” stock within the next 2 to 3 years.
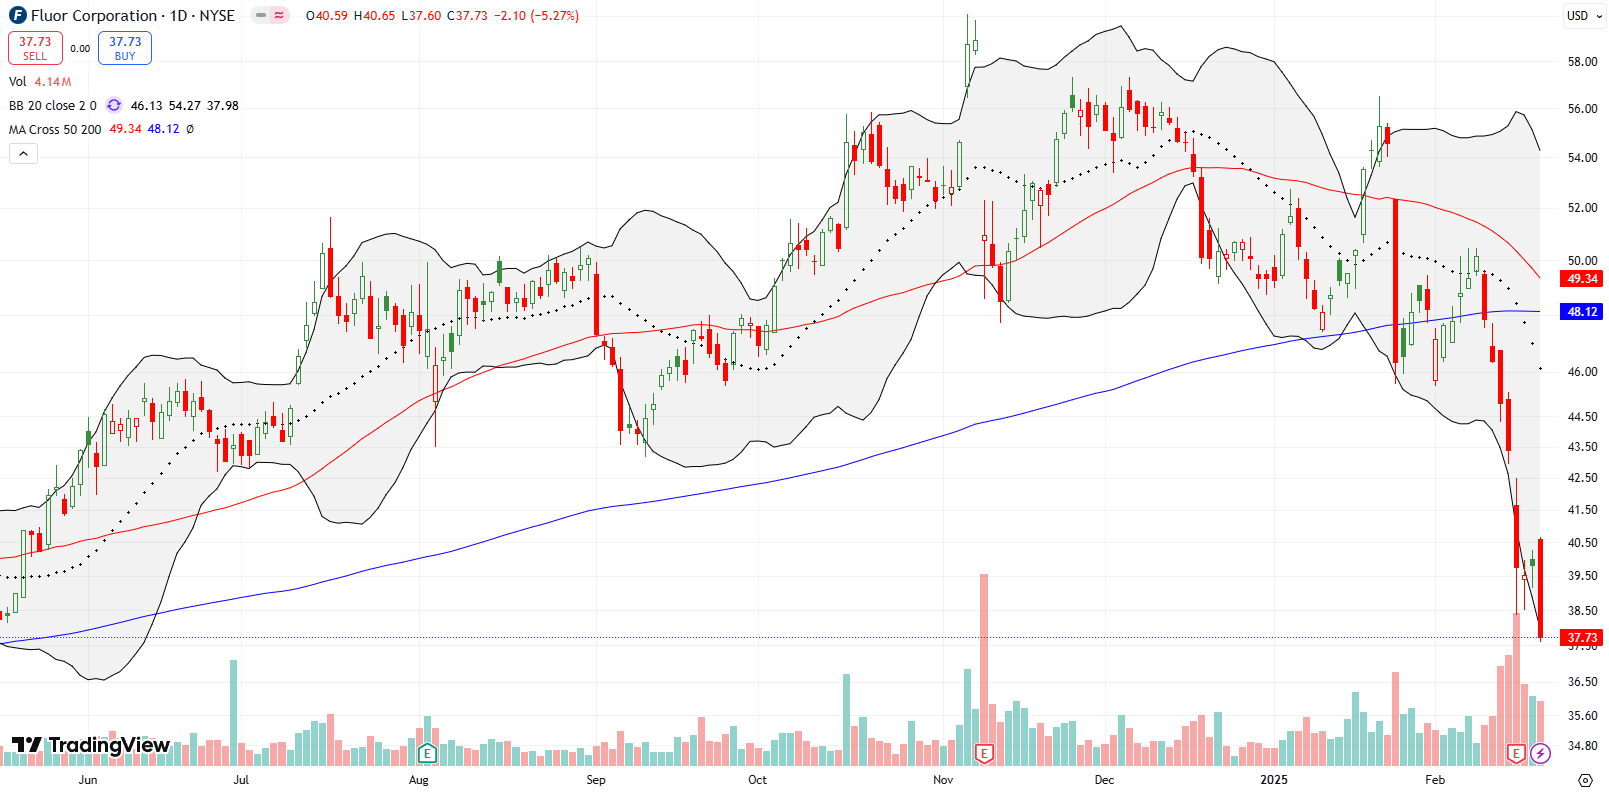
In October, 2023, Fluor Corporation (FLR) made me nervous with a 50DMA breakdown. The stock soon recovered and rallied in choppy fashion from there. Late last year I had the bright idea to jump back into FLR based on all the infrastructure talk for building and powering data centers. FLR seemed poised to grab some of the pie. That bet soon soured, and this month’s 200DMA breakdown ended the short-term thesis. Still, I added shares after last week’s 8.4% post-earnings loss after what looked like some stabilization. Friday’s resumption of selling with a 5.3% loss revived the prospect of further losses.
I quickly scanned FLR’s earnings call transcript just to make sure I understand the longer term story correctly. Sure enough, here are the claims from the CEO:
“Considering the underlying themes of pro domestic energy, key minerals production and AI infrastructure development in the executive orders, we see these directives as favorable to nuclear and thermal sources of energy, favorable to LNG exports and expedited permitting, favorable to increasing domestic mineral production and favorable to significant data center buildouts. Therefore, we see positive elements across all of Fluor’s business segments and stand ready as we always have to support our clients.”
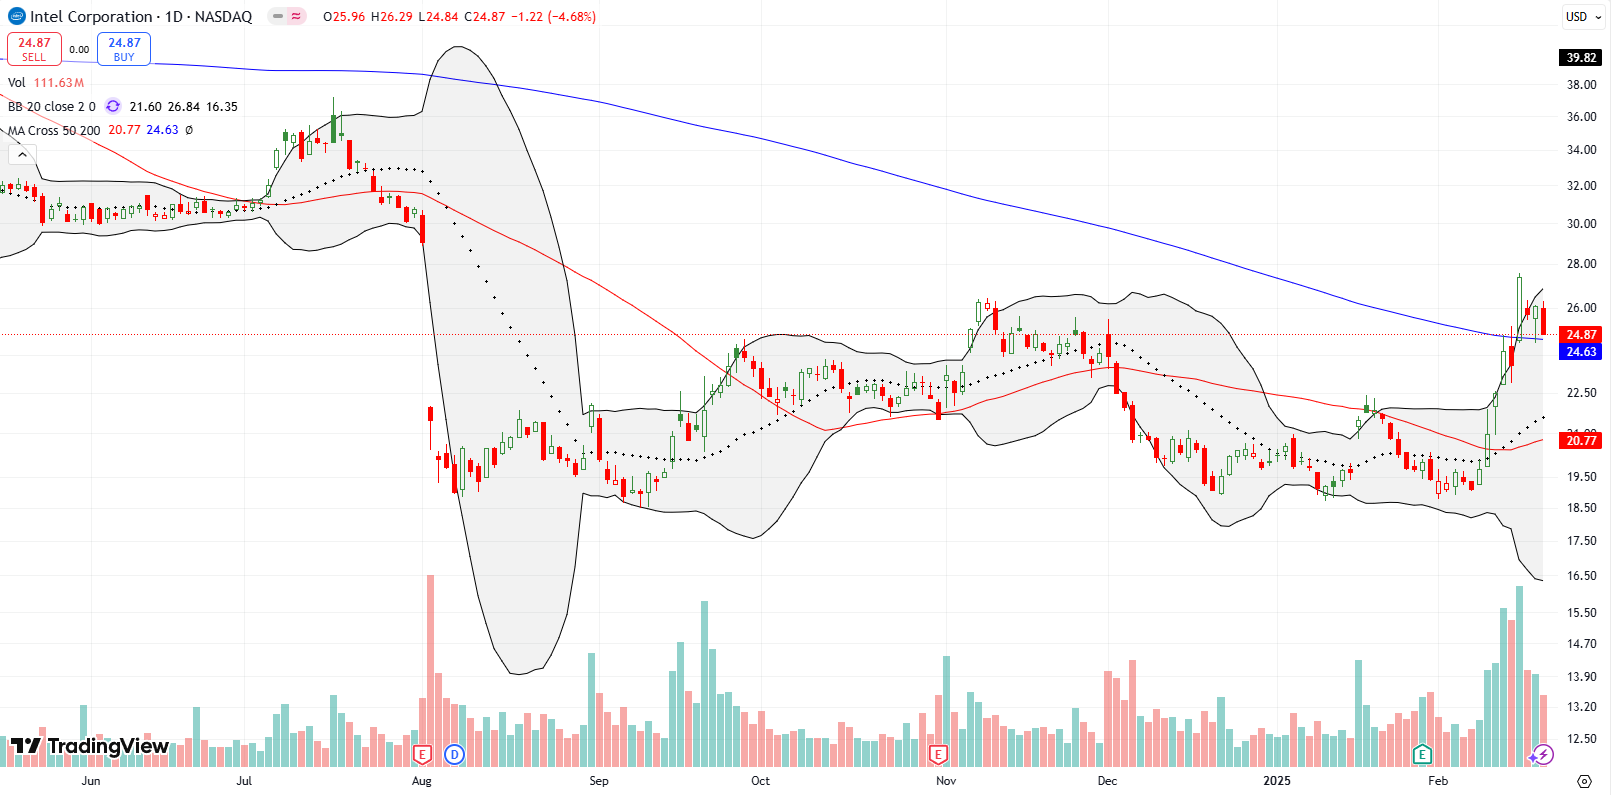
So far I am relieved I stuck with Intel Corporation (INTC). I even bought more shares soon after its epic collapse last summer (I bought the first tranche of shares right before the calamity). Thanks to those added shares, last week’s 16.1% surge on acquisition rumors almost got me back to breakeven. When INTC fell the next day 6.1%, I jumped back into a between earnings trade with a calendar call spread..now if INTC can just hold 200DMA support. Either way, something seems to be brewing, so I definitely want to hold my shares even tighter and see whether in the meantime I can continue to scrape fortuitous profits from occasional call option trades.
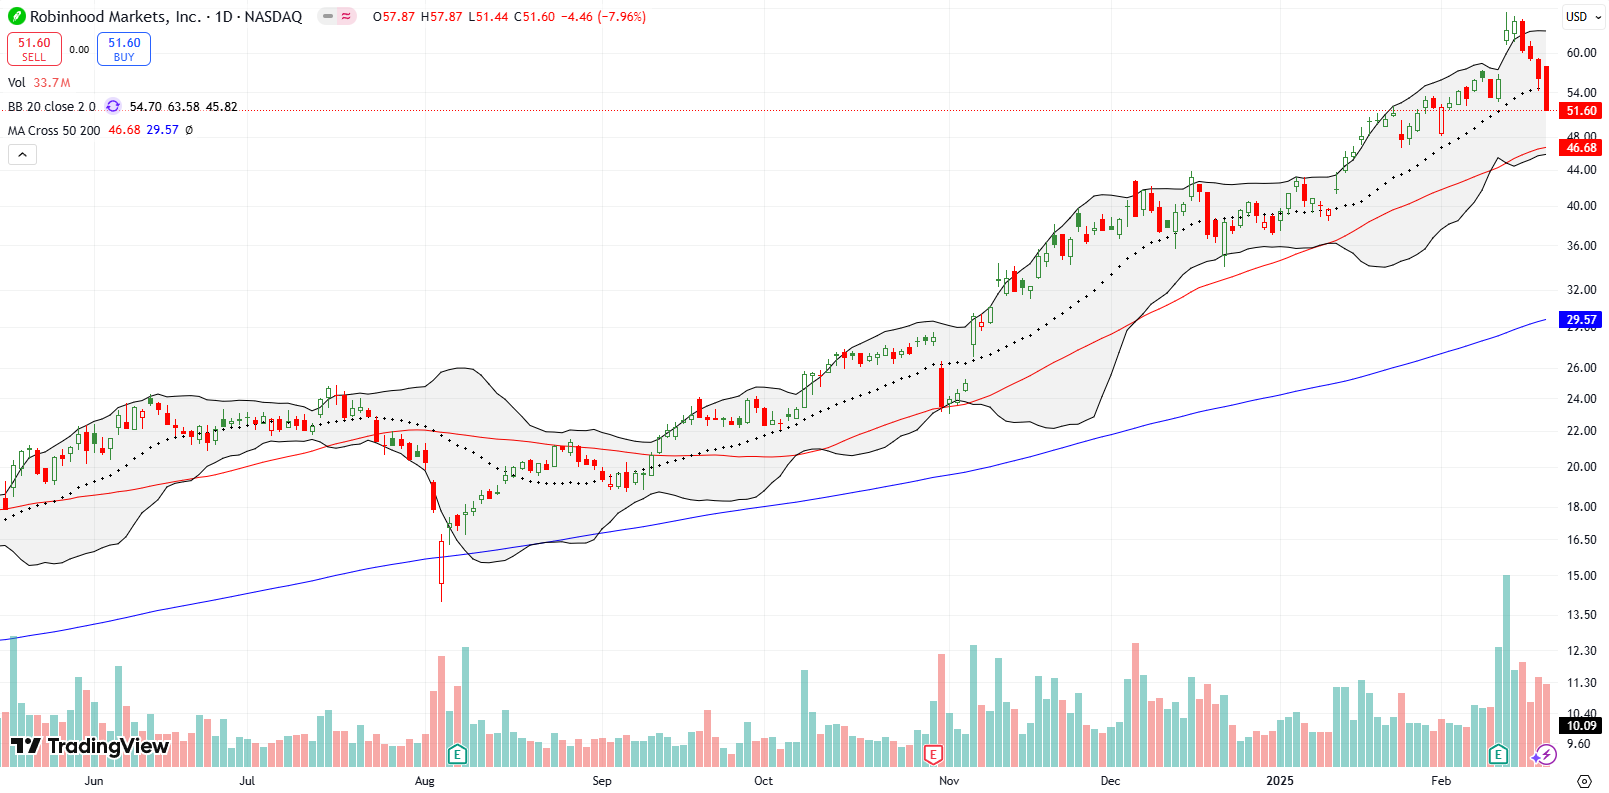
In early November, I made the case to buy and hold Robinhood Markets, Inc (HOOD) after a 16.7% post-earnings drop that stopped right at 50DMA support. HOOD ran up so fast from that point that less than 2 weeks later I placed a stop loss order on my position in order to protect profits. The market saw fit to take me out of my position the very next day. After HOOD ran up again, I chased the stock in early December and accumulated another large position. The steep run-up in January compelled me to take profits (I did not bother with a stop loss this time). So imagine my dismay when HOOD jumped 14.1% post-earnings earlier this month. And next imagine my anticipation as HOOD drops toward a fresh test of 50DMA support.
If you want to open a Robinhood account, please use my referral code!
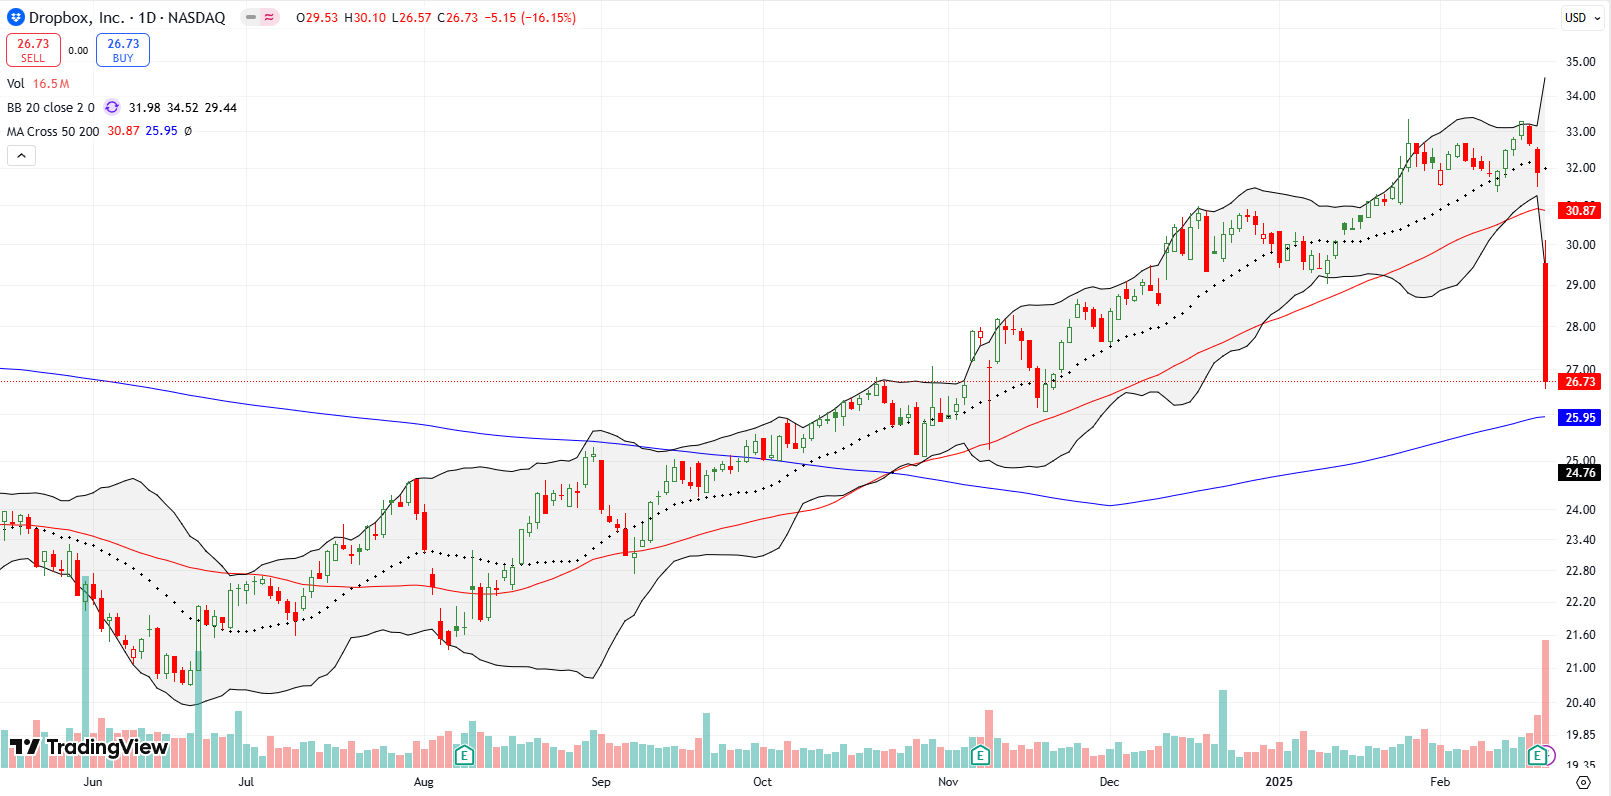
Dropbox, Inc (DBX) was enjoying a a nice, steady uptrend until last week’s earnings. The file storage platform plunged 16.2% post-earnings and almost tested 200DMA support. This calamity is another example of how sometimes the market does not sufficiently understand what is going on with a business. In just one day DBX round-tripped back to its November earnings level. If DDBX holds and confirms 200DMA support, I will jump in for a speculative swing trade.
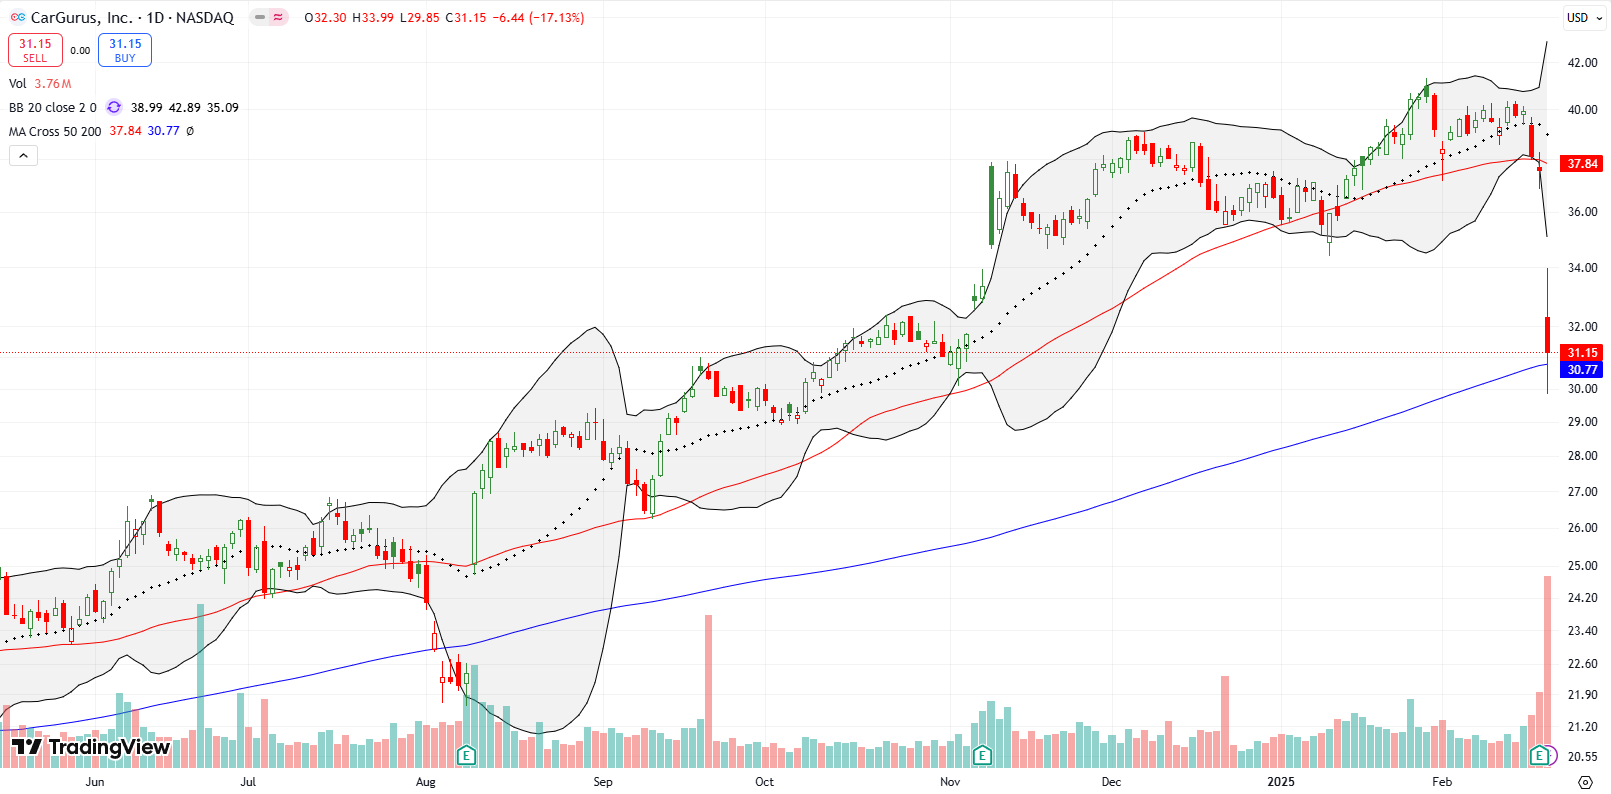
My last trade on CarGurus, Inc (CARG) worked out pretty well. Now the stock finds itself at even more critical support after a 17.1% post-earnings plunge pushed the stock into a test of the 200DMA. Just like that, CARG reversed all its gains from the previous earnings report. The trade on CARG is “easy” because a buy here has an obvious stop loss below the intraday low from Friday. A close below that low would all but seal the deal on a failure of 200DMA support.
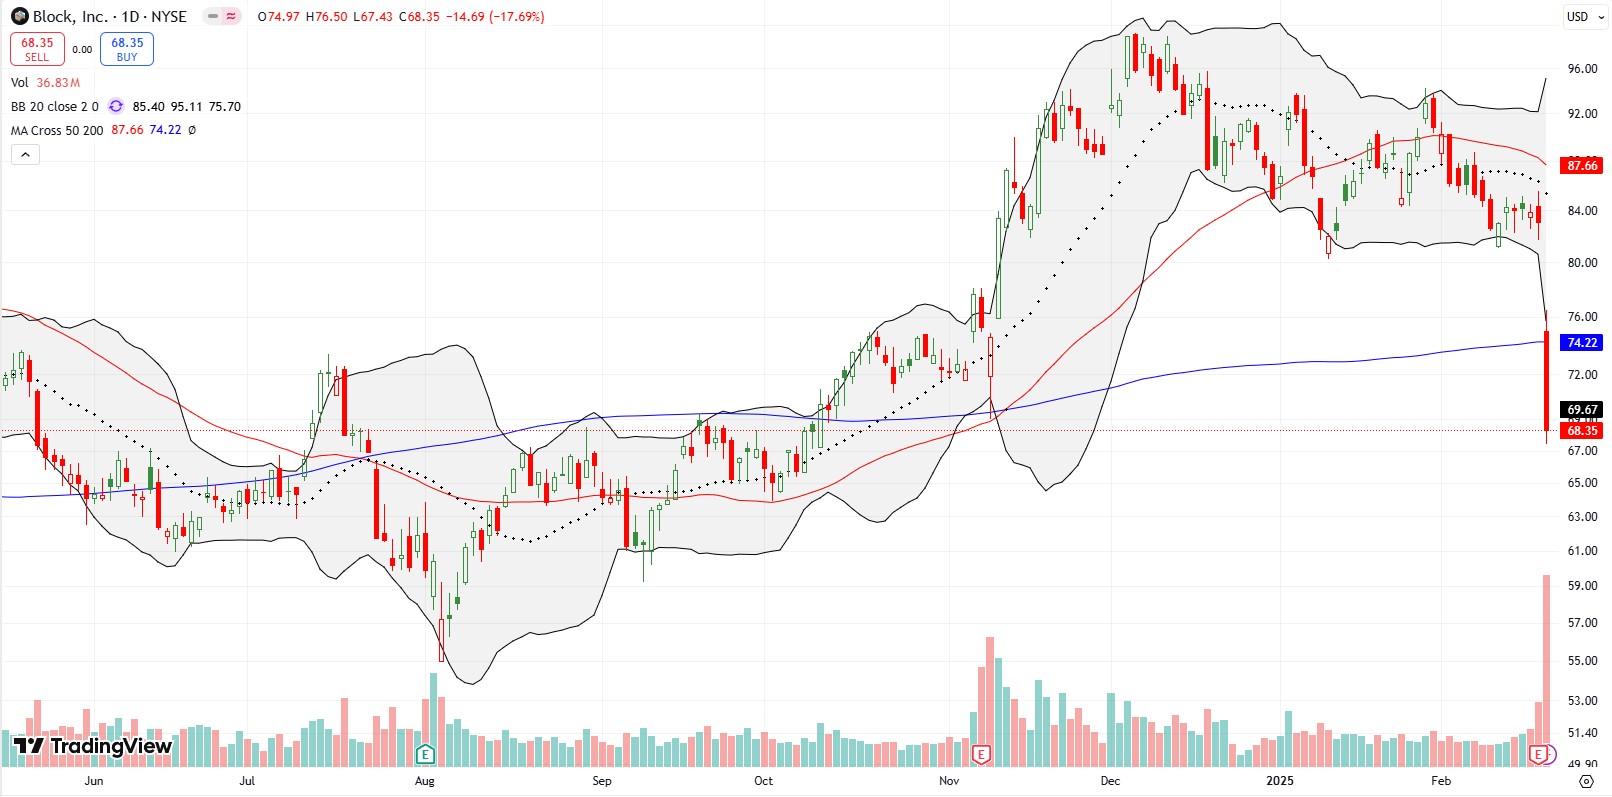
Payment platform Block, Inc (XYZ) finished reversing all its rebound gains from November earnings. A 17.1% post-earnings plunge sliced XYZ through 200DMA support and further confirmed 50DMA resistance. It will be hard for XYZ to recover from this blow, and I will be looking for an opportunity to fade the stock at 200DMA resistance.
Be careful out there!
Footnotes
Subscribe for free to get email notifications of future posts!
“Above the 50” (AT50) uses the percentage of stocks trading above their respective 50-day moving averages (DMAs) to measure breadth in the stock market. Breadth defines the distribution of participation in a rally or sell-off. As a result, AT50 identifies extremes in market sentiment that are likely to reverse. Above the 50 is my alternative name for “MMFI” which is a symbol TradingView.com and other chart vendors use for this breadth indicator. Learn more about AT50 on my Market Breadth Resource Page. AT200, or MMTH, measures the percentage of stocks trading above their respective 200DMAs.
Active AT50 (MMFI) periods: Day #297 over 20%, Day #18 over 30%, Day #24 over 40% (overperiod), Day #2 under 50% (underperiod), Day #34 under 60%, Day #135 under 70%
Source for charts unless otherwise noted: TradingView.com
Full disclosure: long SPY put spread, long IWM calls, long CAT put spread, long INTC shares and calls, short WIX, long EAT put options, long CMG, long CVNA put spread
FOLLOW Dr. Duru’s commentary on financial markets via StockTwits, BlueSky, and even Instagram!
*Charting notes: Stock prices are not adjusted for dividends. Candlestick charts use hollow bodies: open candles indicate a close higher than the open, filled candles indicate an open higher than the close.


