Stock Market Commentary
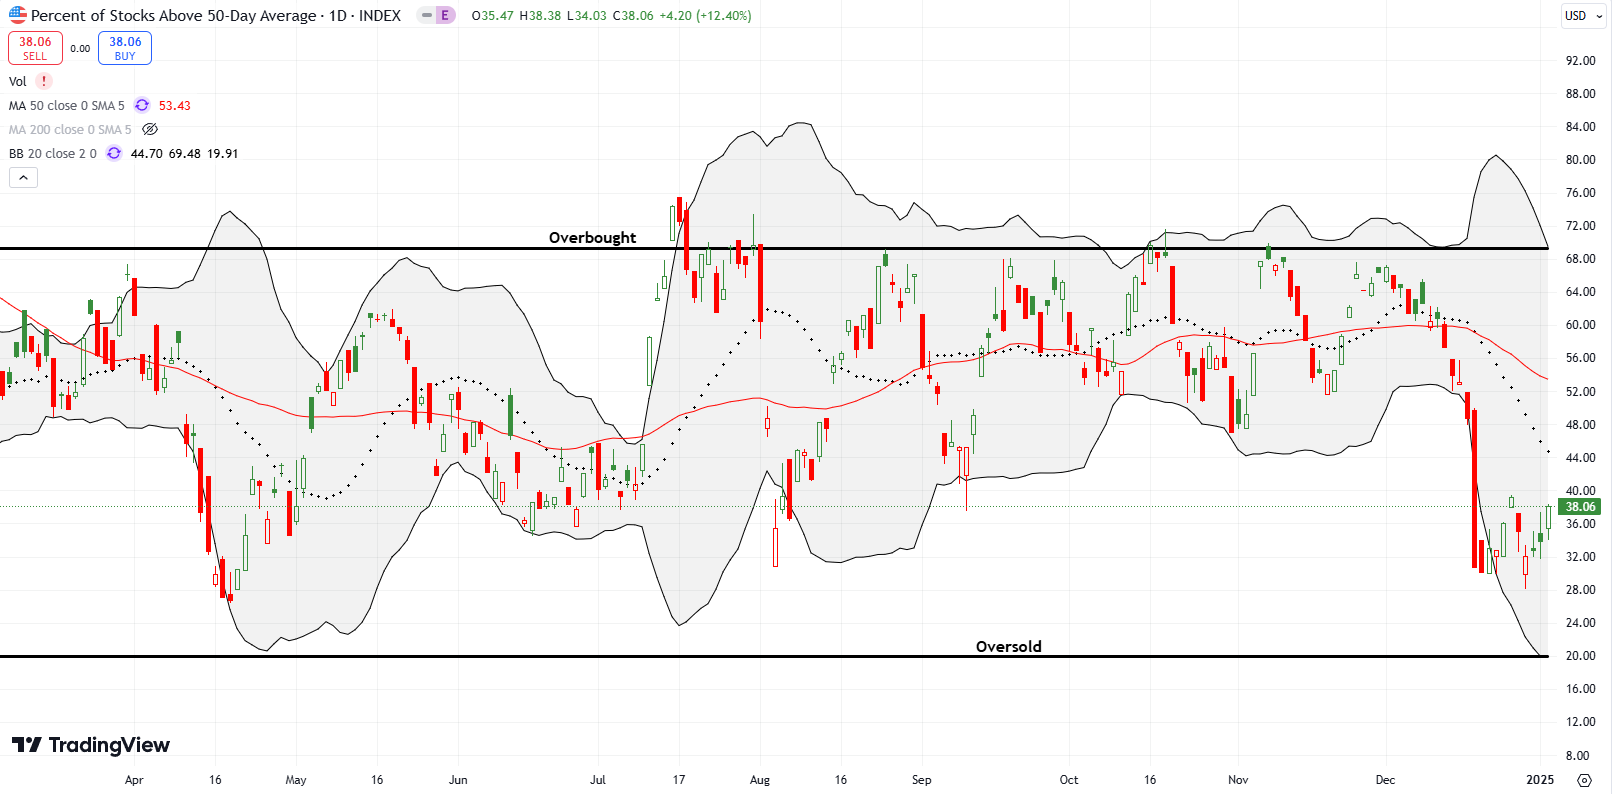
The new year of 2025 got off to a rocky start with the weight of the last Federal Reserve decision on monetary policy pushing fresh losses across the indices. I assumed this price action signaled the market’s readiness to cash in on the capital gains that it did not want to register in 2024. However, a minor bullish divergence in market breadth appeared as a small improvement in the percentage of stocks trading above their respective 50-day moving averages (DMAs). For day number two of 2025, the script read “market breadth firms.” A jump in market breadth close to the last high underscored a notable rebound in the major indices. The stock market is now one fresh breakout in the S&P 500 from resuming its resilient and stubbornly bullish behavior from 2024.
The Stock Market Indices
The S&P 500 (SPY) started the year looking ready for a confirmed breakdown. When the index briefly rallied toward its 50-day moving average (DMA) (the red line below), I jumped on a weekly SPY put option expiring the next week. In quick order, the put doubled. I dutifully took profits just as the trading rules dictate. Unlike the last time I snatched a quick double, this SPY put option collapsed the next day (and thus made me feel relieved I followed the rule). I bought a fresh put option as SPY rallied back to 50DMA resistance on Friday. This position is one hedge on bullishness given what I see as an incrementally more precarious stock market. (I know – we have all heard this song so many times over the past year).
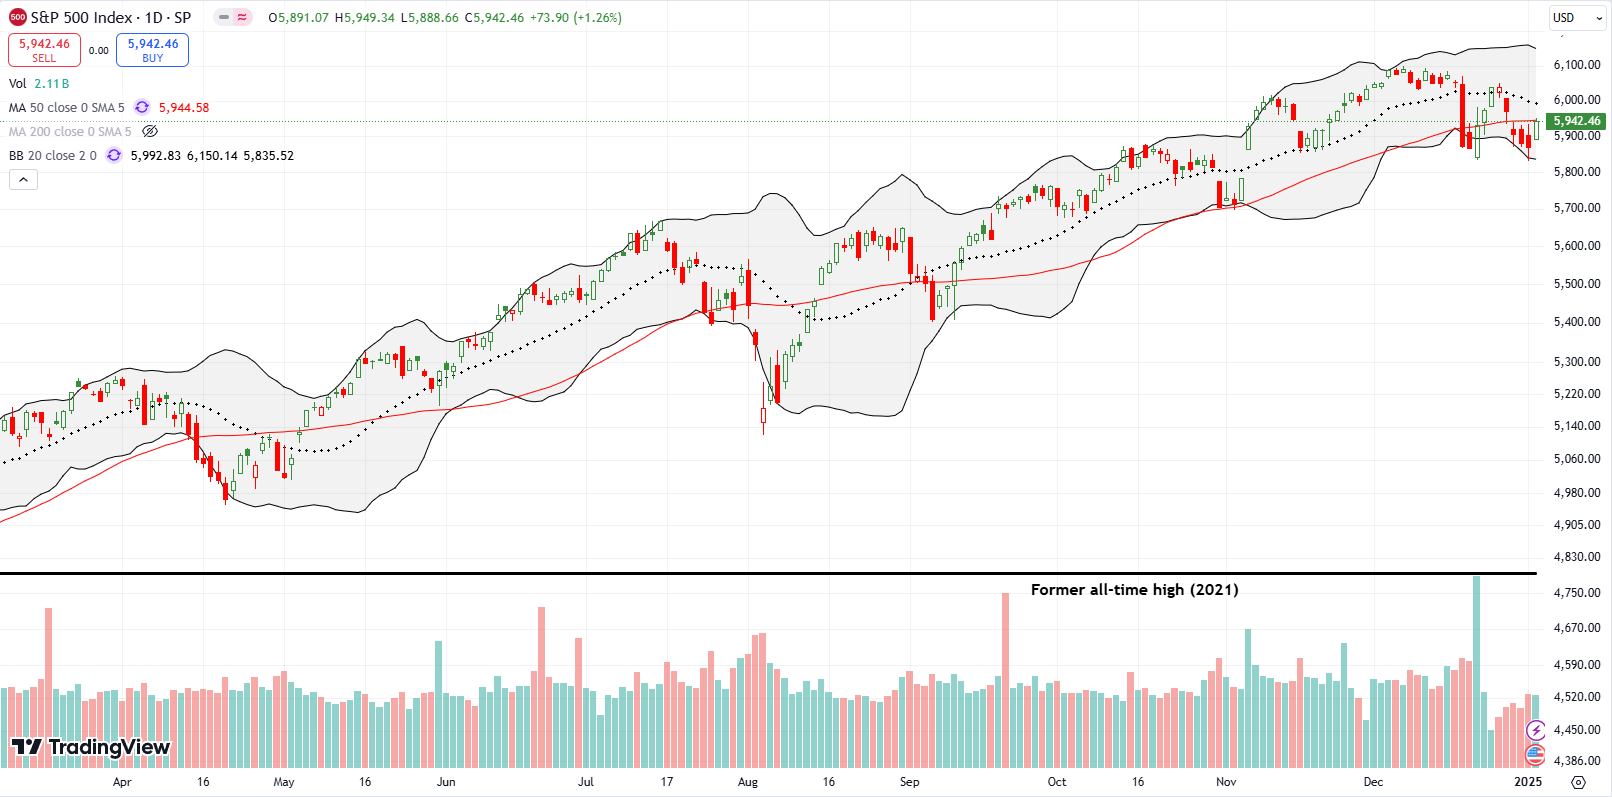
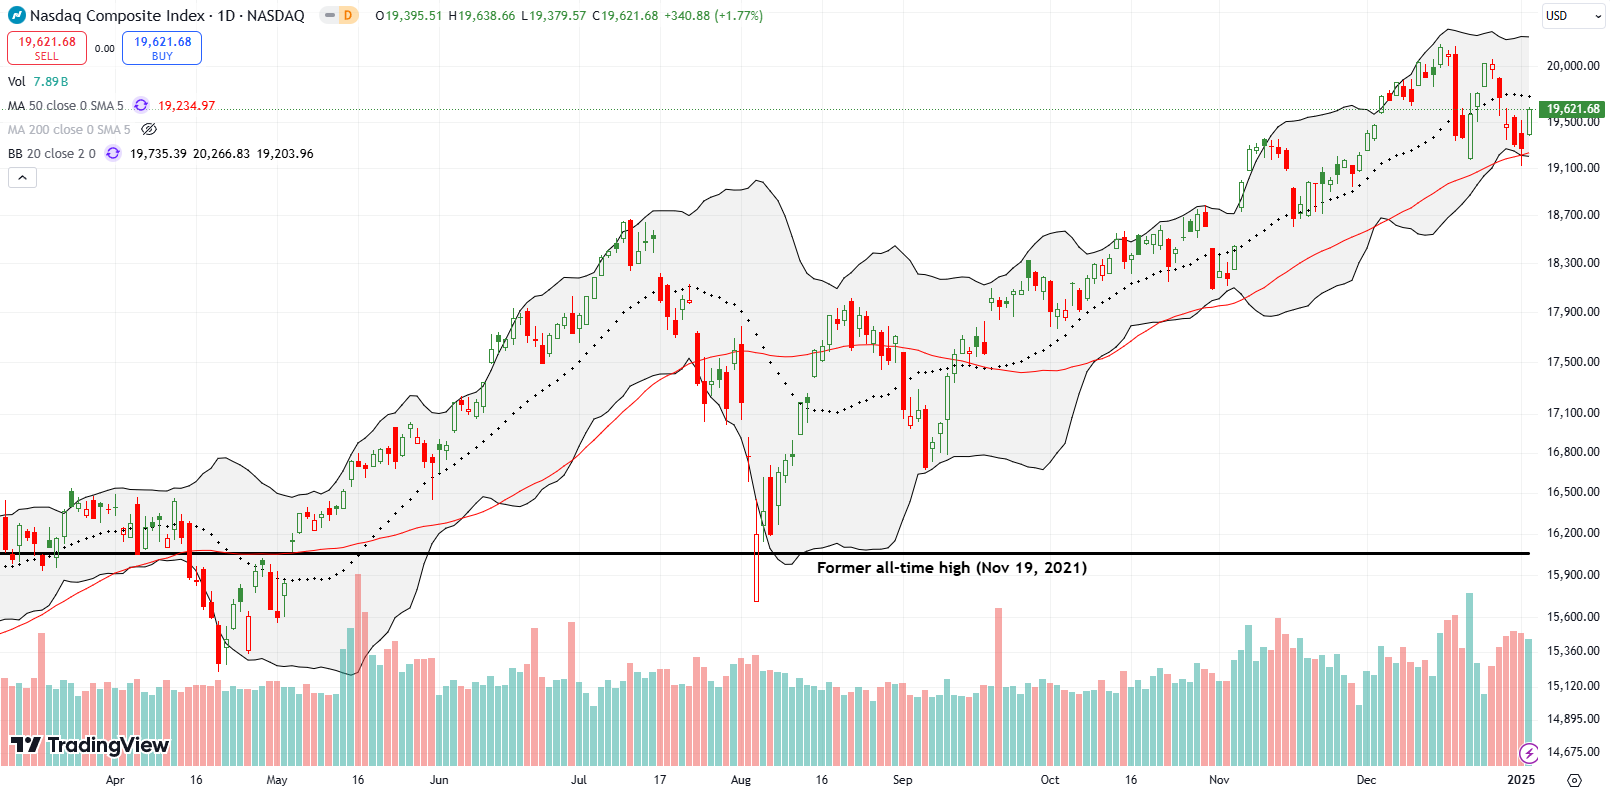
The NASDAQ (COMPQX) benefited from firming market breadth in the form of confirming 50DMA support. I maintain my cautiously bullish short-term trading call in the face of such resilience.
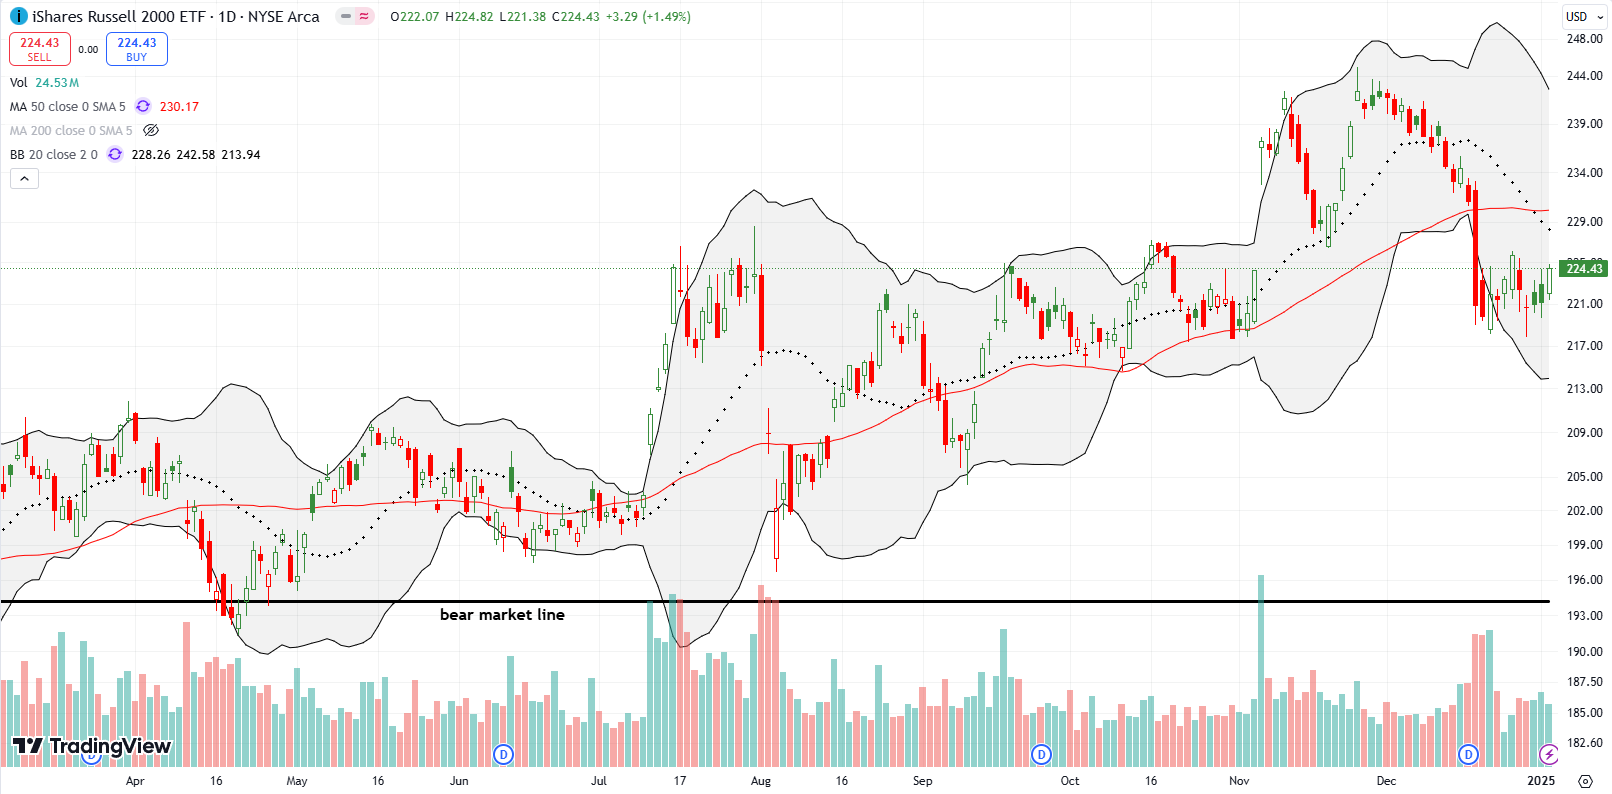
The iShares Russell 2000 ETF (IWM) looks like more of the same churn. Enough said for now. I flipped my last IWM call option by buying at the bottom of the churn and selling at the top the next day.
The Short-Term Trading Call As Market Breadth Firms
- AT50 (MMFI) = 38.1% of stocks are trading above their respective 50-day moving averages
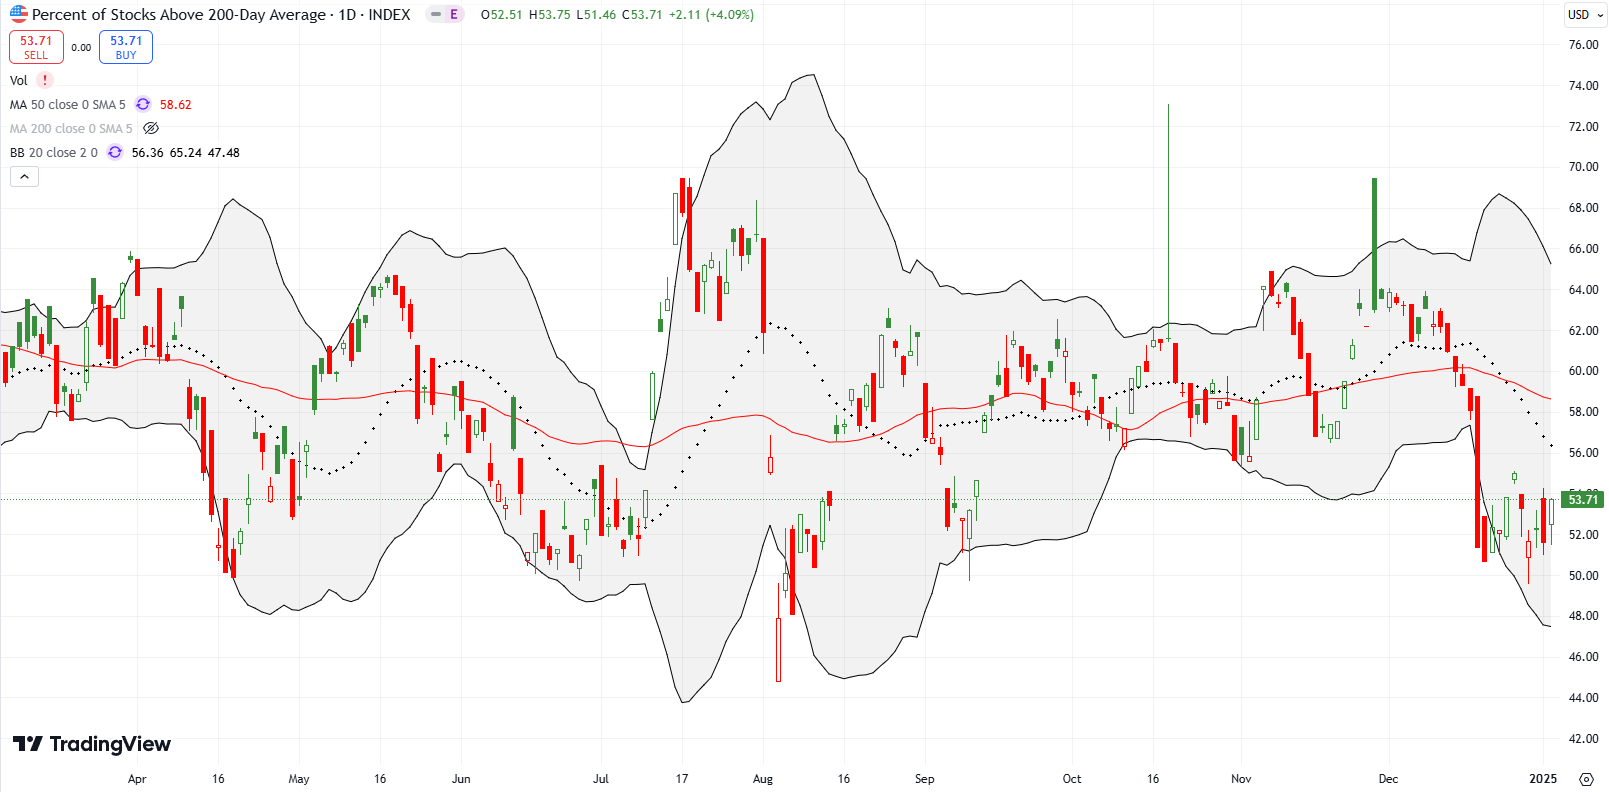
- AT200 (MMTH) = 53.7% of stocks are trading above their respective 200-day moving averages
- Short-term Trading Call: cautiously bullish
AT50 (MMFI), the percentage of stocks trading above their respective 50DMAs, closed the week at 38.1%. My favorite technical indicator stopped just short of the previous week’s high after a sharp rebound from recent lows. All together, AT50 signaled that market breadth firms for now. Thus, if the S&P 500 breaks out above its 50DMA, I will feel comfortable upgrading the short-term trading call from cautiously bullish to bullish.
After two consecutive years of 20%+ gains for the S&P 500, there is plenty of room for disappointment this year, especially given the racing euphoria that followed the presidential election. China is one of the global wildcards that could trip up bullish trading scenarios. The current story is quite a rapid turn-around from the initial excitement from China’s first round of fresh stimulus just over three months ago. The iShares China Large-Cap ETF (FXI) is down 5.5% since then although the ETF is still holding initial gains from the run-up into the stimulus news.
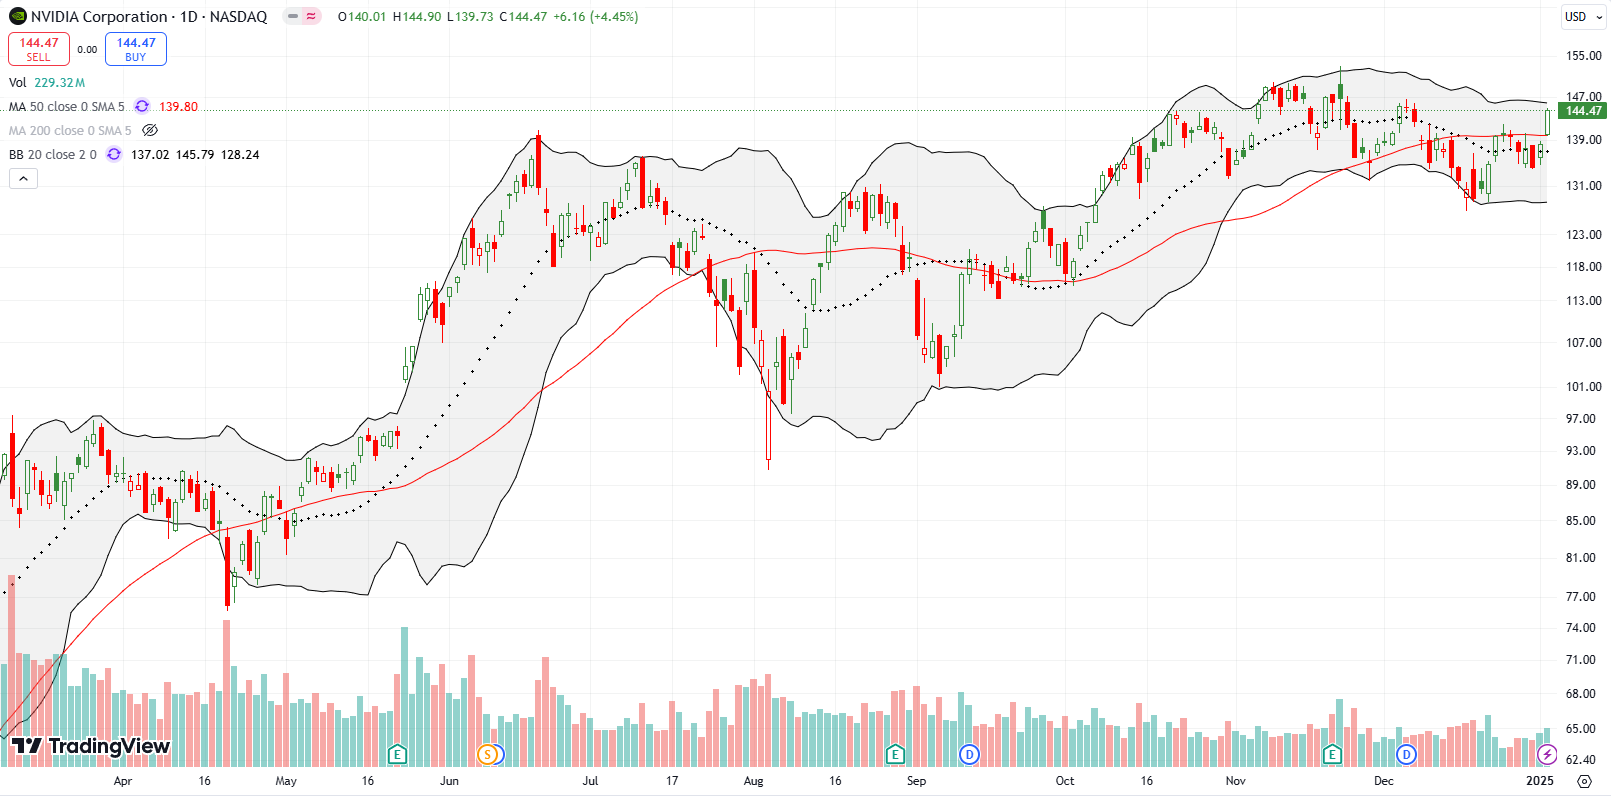
NVIDIA Corporation (NVDA) came into 2025 precariously trading just under 50DMA resistance. The hesitancy shattered in dramatic form with a 4.5% rally and 50DMA breakout on Friday. Combined with firming market breadth, NVDA’s surge paints the market with a stronger bullish hue. I saw no news that convincingly explains this move. Barron’s came out bullish on NVDA on December 31st and the stock responded with a 2.3% drop. So perhaps Friday’s move represents fresh pent-up demand for shares.
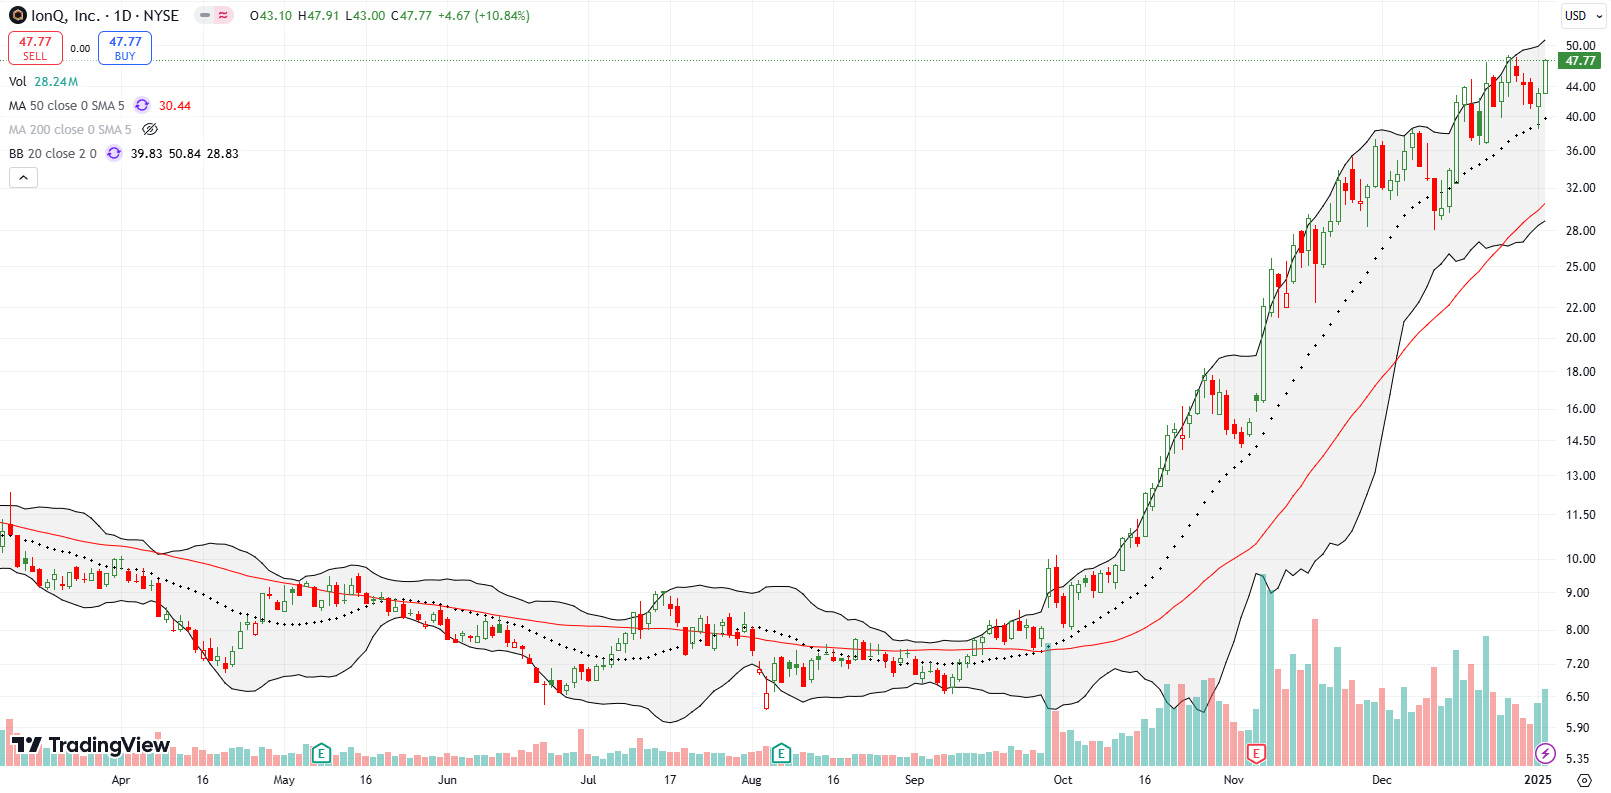
Quantum computing company IonQ, Inc (IONQ) pulled off a picture perfect test of uptrending 20DMA support (the dashed line below). The 10.8% surge stopped just short of an all-time high. I plan to feature one quantum computing stock (or at least stocks traders assume are quantum-related) every one or two weeks given their increasing importance as symbols of speculative fever in the stock market. Needless to say, speculation remains all systems go for now.
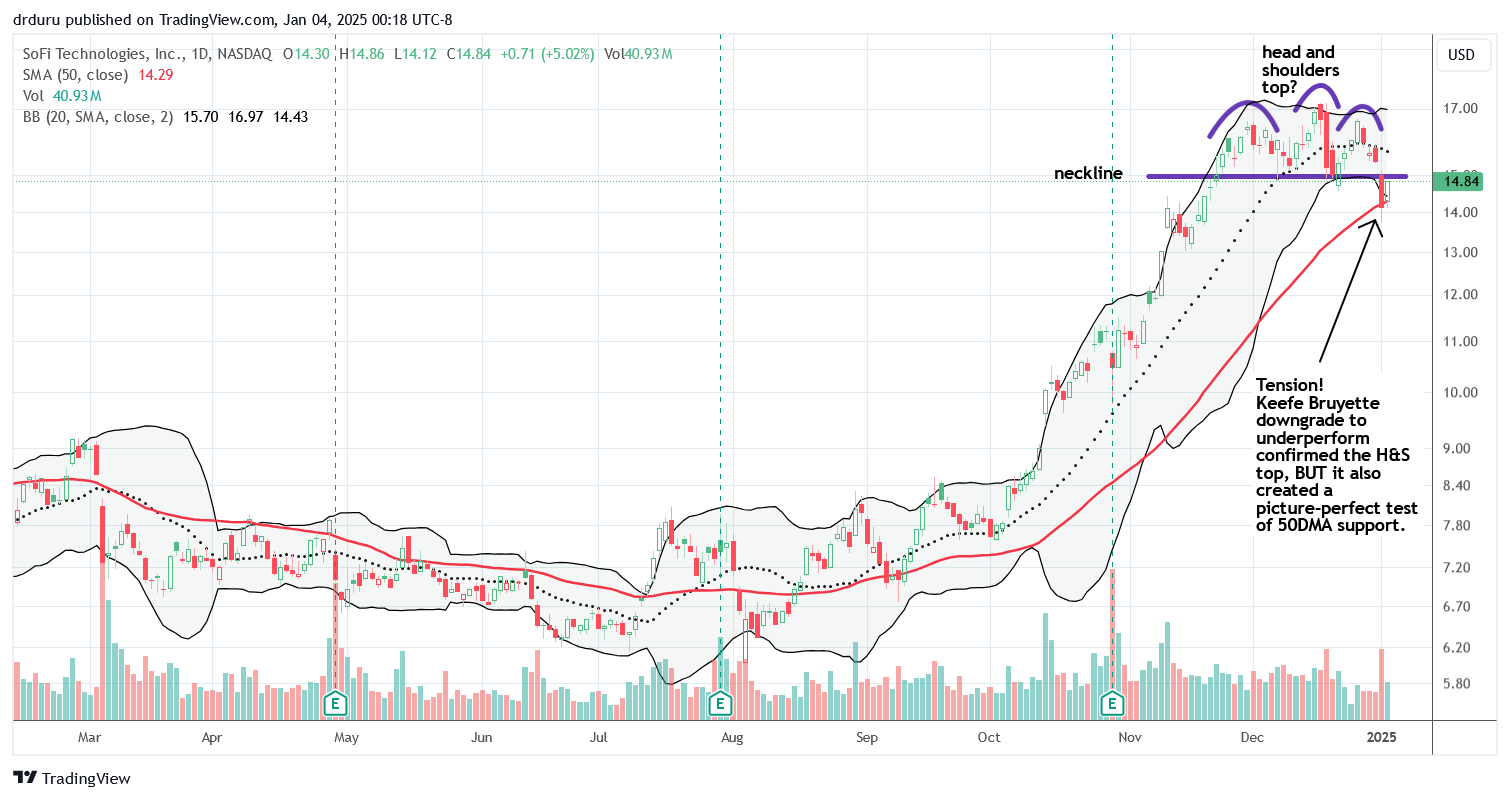
I last wrote about SoFi Technologies (SOFI) well over a year ago. There was a bear/bull battle going on at the single-digit price level. I completely lost track of SOFI in 2024, a year when the stock gained 54.8%. It was easy to lose track of SOFI as it traded in the red until a breakout and run-up into October earnings. SOFI has my attention again as it struggles to recover from a poor start to the year. The stock lost 8.3% on a major downgrade. Buyers defended SOFI at 50DMA support and returned the next day with a 5.0% gain. However, SOFI is still flirting with bearish territory with a potential (likely?) head and shoulders top. A close above the neckline begins a likely invalidation of the top; I am a buyer at that point. A close below the 50DMA makes me a seller (short).
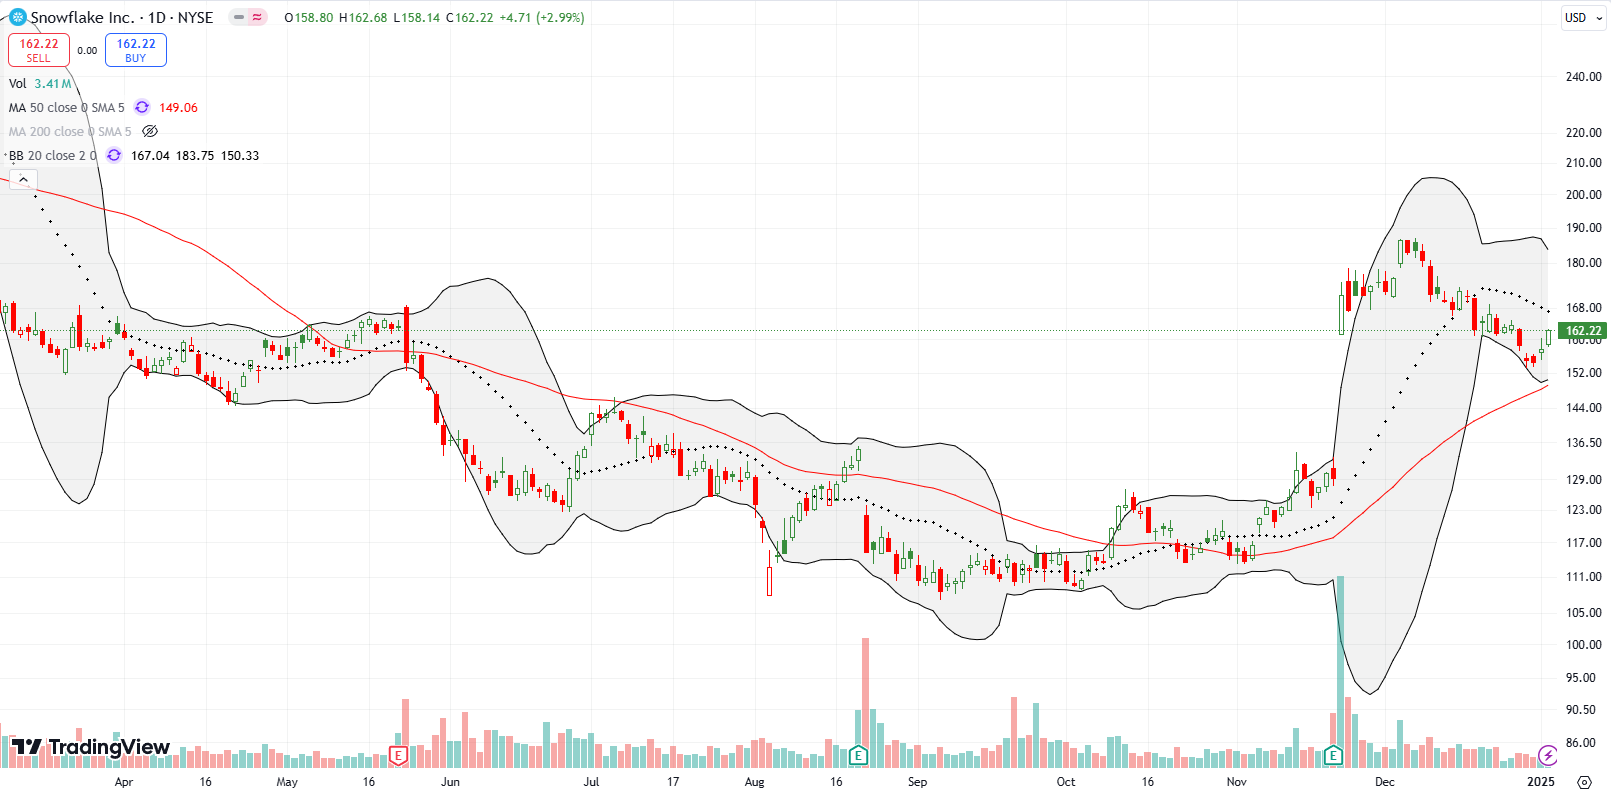
I made a great trade on database software company Snowflake Inc (SNOW) after the stock surged 32.7% post-earnings. SNOW is now losing momentum, and I am eyeing it for a new entry. Last week SNOW stopped short of testing 50DMA support, so I continue to wait. I think the downtrending 20DMA will hold sway on momentum until that 50DMA gets tested.
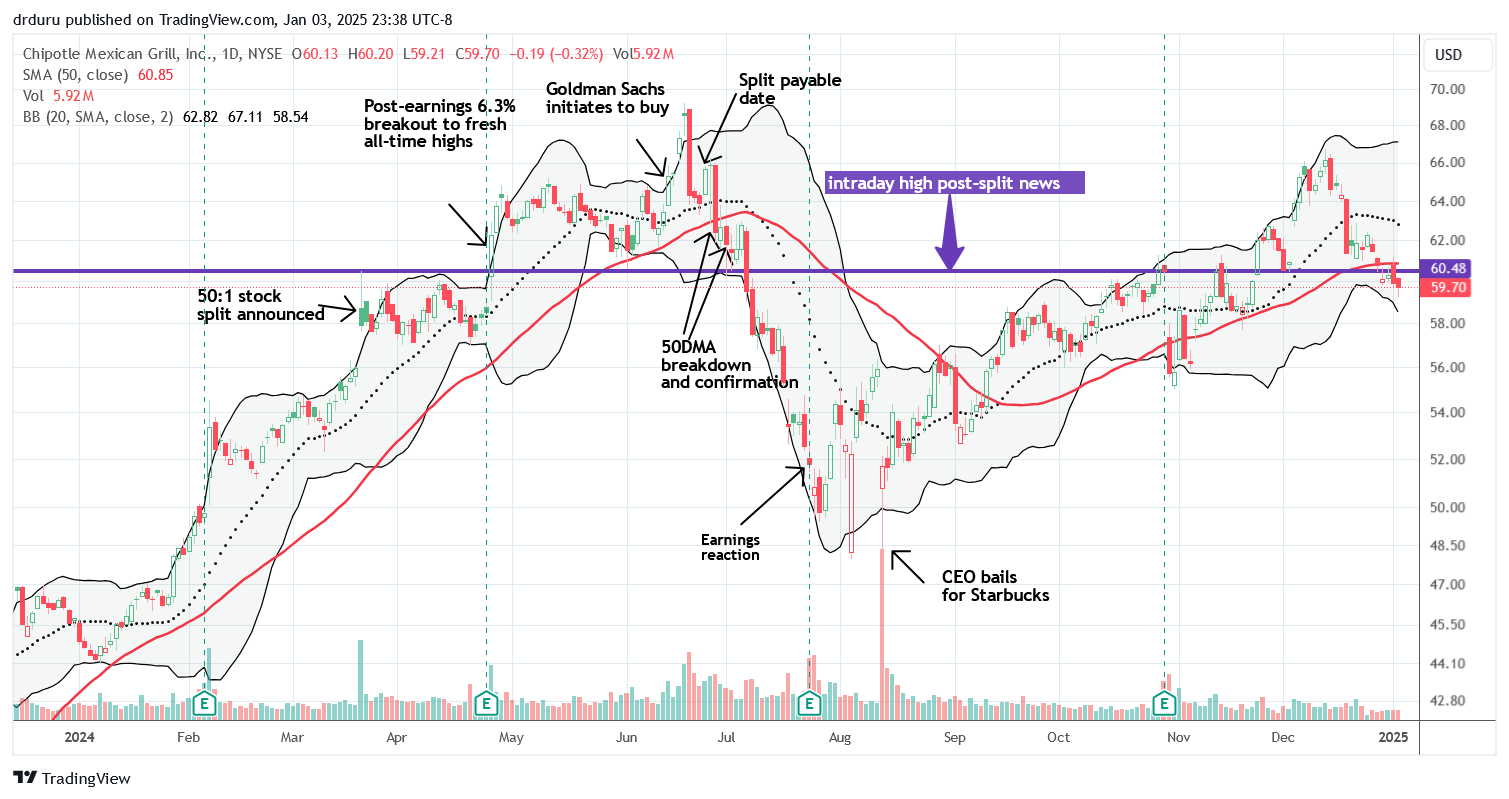
Last year was the year I finally paid attention to trading opportunities in Chipotle Mexican Grill, Inc (CMG). Like so many people, the news of a stock split caught my attention. I reluctantly took profits on my last position as CMG lost momentum from what was an impressive breakout in December.
The chart below summarizes key trading moments. Note how the intraday high from the day of the news about the split still holds sway over CMG technicals. While CMG is now in a bearish position, I will not chase the stock downward. Instead, I might next try a strangle position (a combination of puts and calls) in anticipation of the next big move perhaps in another month or so.
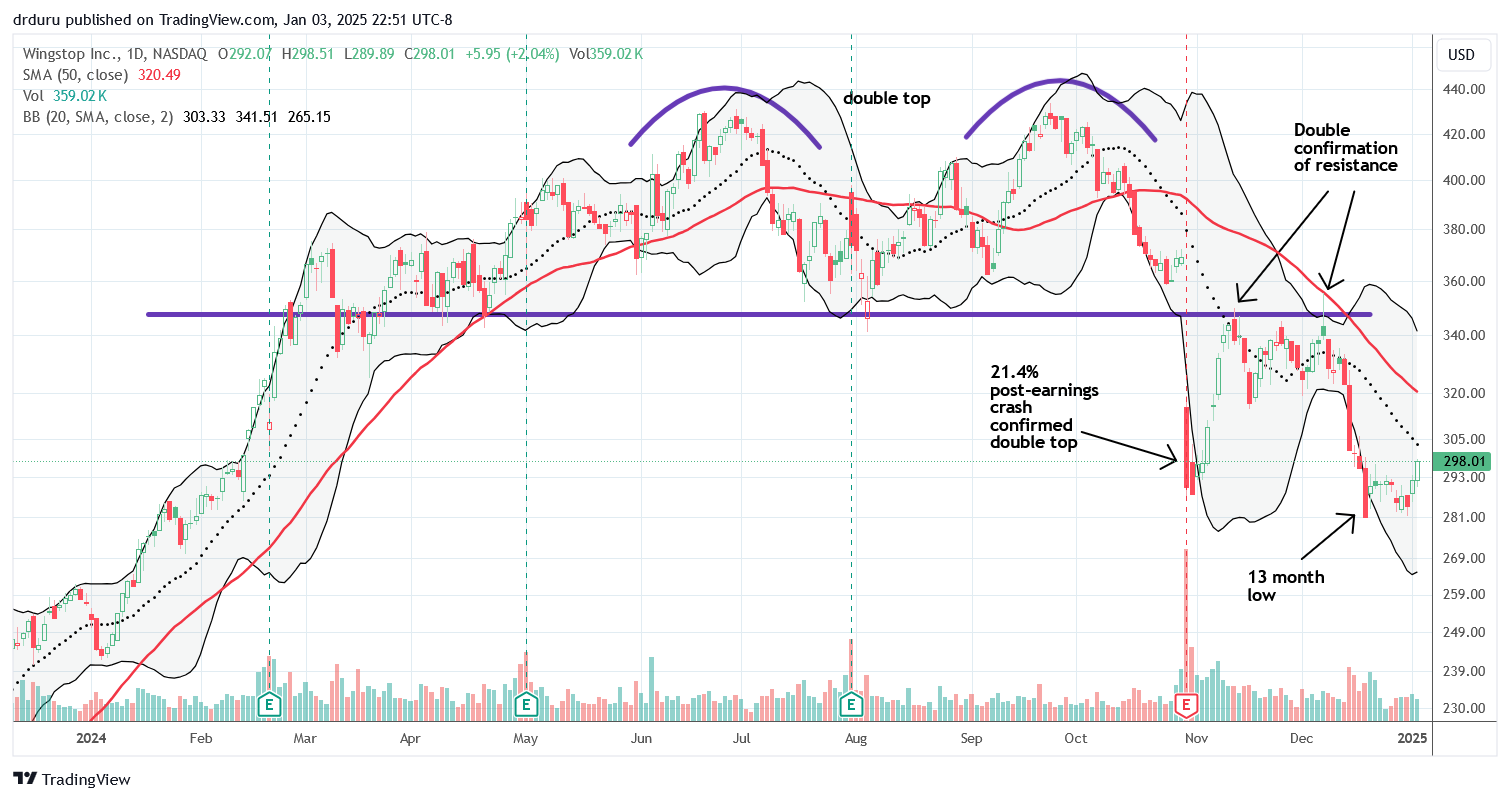
In December, 2023 I lamented how slow I was to pivot my bearish read on Wingstop Inc (WING). Now I am marveling at how I missed a major bearish signal in WING. The chart below summarizes the development and confirmation of a major double top, further emphasized by a 21.4% post-earnings loss. When I finally took note, WING was hitting a 13-month low. I chased it with a January $260 put option. I doubled down on Friday as WING rallied into downtrending 20DMA resistance. If WING breaks out, I will try one more time at 50DMA resistance.
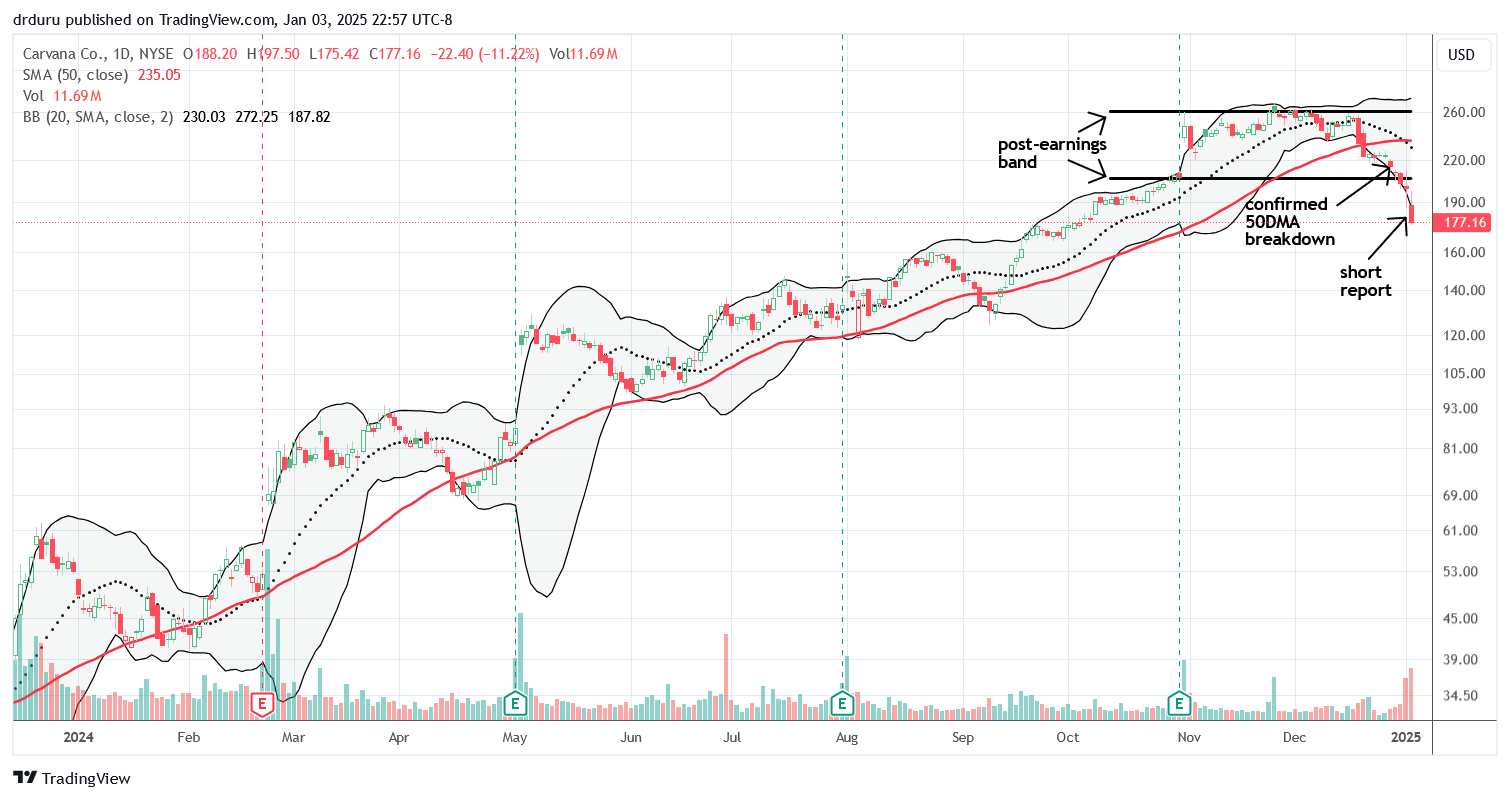
Carvana Co (CVNA) was quite the marvel last year. It is a classic case of an obvious uptrend that is hard for someone like me to buy. Every time I looked at this chart I conjured up visions of an overdue correction or even collapse. CVNA held a strong uptrend at 50DMA support all year long. Such a stubborn trend dulls the bearish senses. Accordingly, I hesitated at a confirmed 50DMA breakdown on December 27. To start the year, I next missed the break below the post-earnings trading band.
The release of a short report suddenly provided a potential explanation for CVNA’s recent weakness and sustained breakdown. After gapping down post release, CVNA surprisingly rallied back to the previous day’s close. I missed one more trading opportunity to fade CVNA. The stock closed the day with an 11.2% loss. I tried a strangle position, but wide bid/ask spreads did not allow me in at an attractive price. CVNA tops my trading list next week.
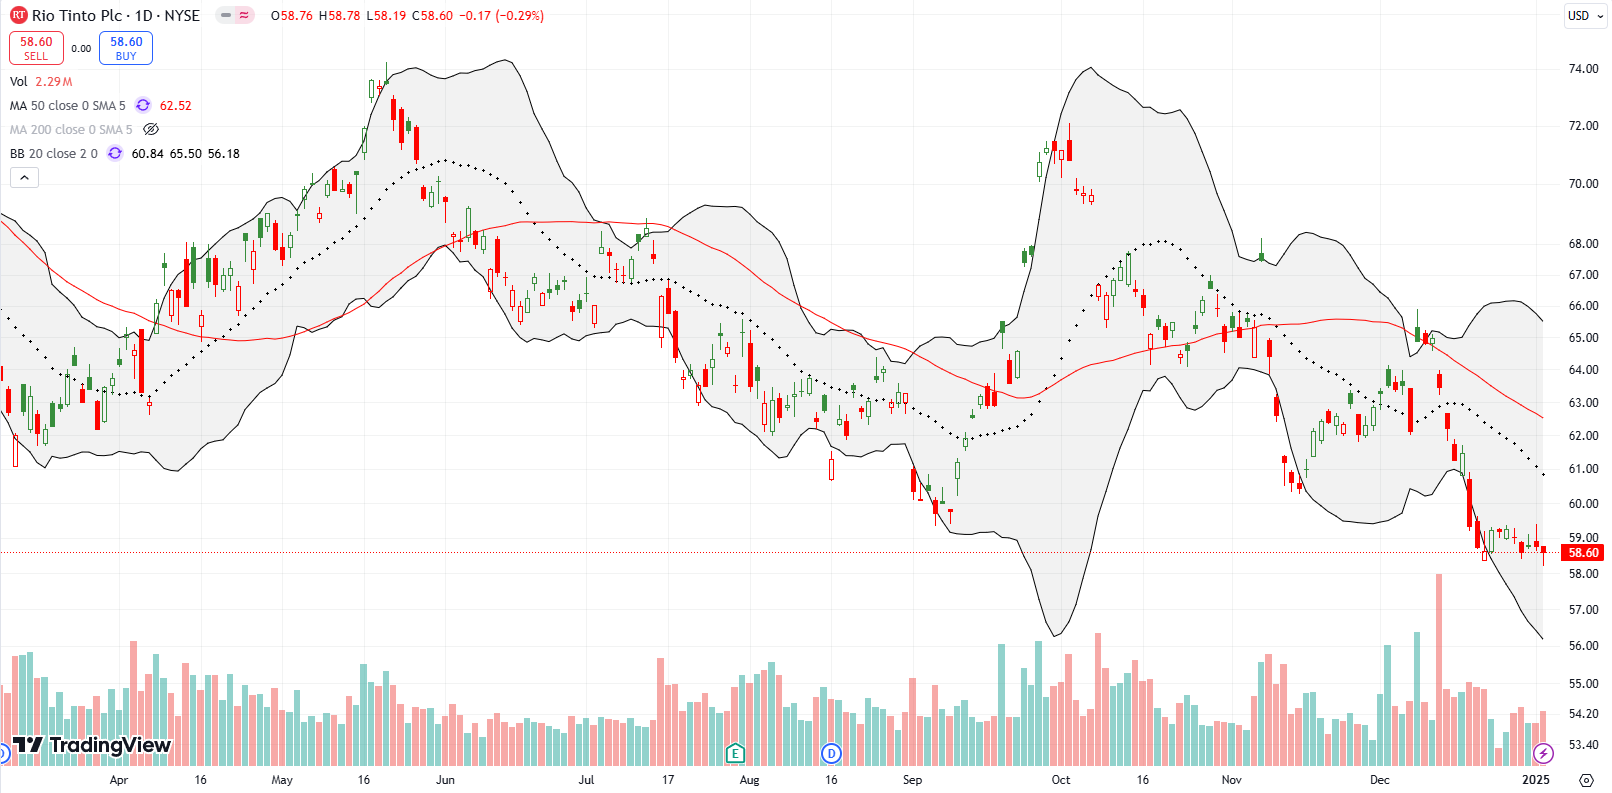
Iron ore producer Rio Tinto plc (RIO) is part of a failed trade on China since the government announced major stimulus programs. RIO now trades at 2-year lows and seems to be at a tempting extreme. I am looking to buy shares and call options on a breakout above the current trading range. To the downside, I am looking for a test of 2022 lows around $53.
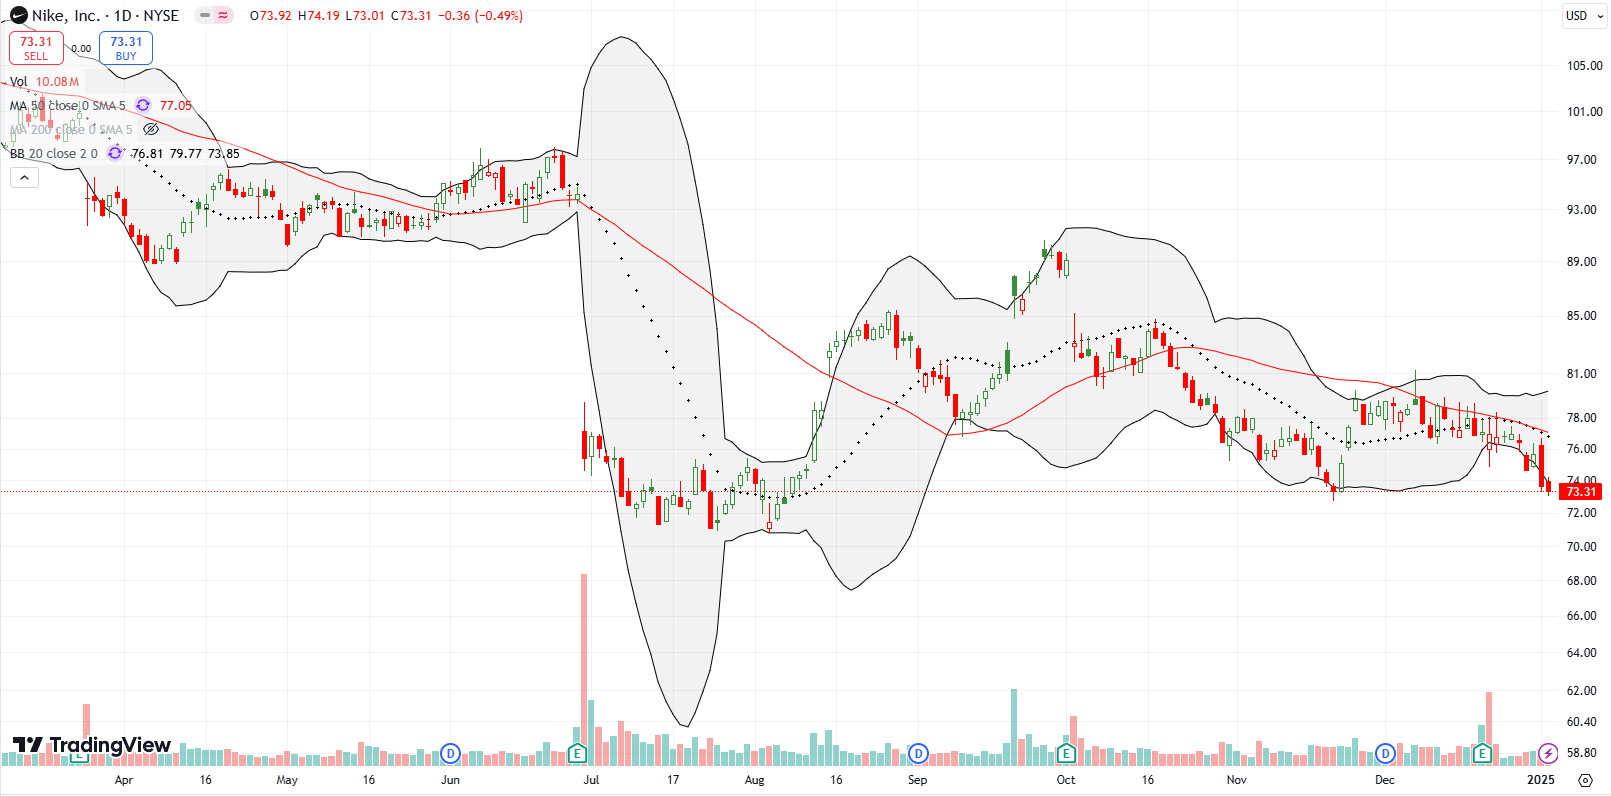
Last year, Nike, Inc (NKE) looked like another consumer-facing company with a stock that would benefit from shareholder activism and a change in CEO. A 6.7% post-earnings drop in October damaged those expectations and subsequent weakness fully erased those expectations. NKE has yet to recover from a 50DMA breakdown and spent most of December failing at 50DMA resistance over and over. NKE is now testing the November lows and looks precariously close to slicing through July lows.
Be careful out there!
Footnotes
Subscribe for free to get email notifications of future posts!
“Above the 50” (AT50) uses the percentage of stocks trading above their respective 50-day moving averages (DMAs) to measure breadth in the stock market. Breadth defines the distribution of participation in a rally or sell-off. As a result, AT50 identifies extremes in market sentiment that are likely to reverse. Above the 50 is my alternative name for “MMFI” which is a symbol TradingView.com and other chart vendors use for this breadth indicator. Learn more about AT50 on my Market Breadth Resource Page. AT200, or MMTH, measures the percentage of stocks trading above their respective 200DMAs.
Active AT50 (MMFI) periods: Day #274 over 20%, Day #173 over 30% (overperiod), Day #7 under 40% (underperiod), Day #7 under 50%, Day #11 under 60%, Day #112 under 70%
Source for charts unless otherwise noted: TradingView.com
Full disclosure: long SPY put spread, long IWM shares, long WING puts
FOLLOW Dr. Duru’s commentary on financial markets via StockTwits, BlueSky, and even Instagram!
*Charting notes: Stock prices are not adjusted for dividends. Candlestick charts use hollow bodies: open candles indicate a close higher than the open, filled candles indicate an open higher than the close.

