Housing Market Intro and Summary
What happened in the housing market in December, 2024? Suddenly, the housing market is mired in a broken narrative after a brief drop in bond yields created a (fake) boost in November. The weakness showed up in stubbornly high mortgage rates and the dour commentary from earnings reports. The data from November and December paint a mixed picture but some signs of potential future weakness exist underneath the aggregated data.
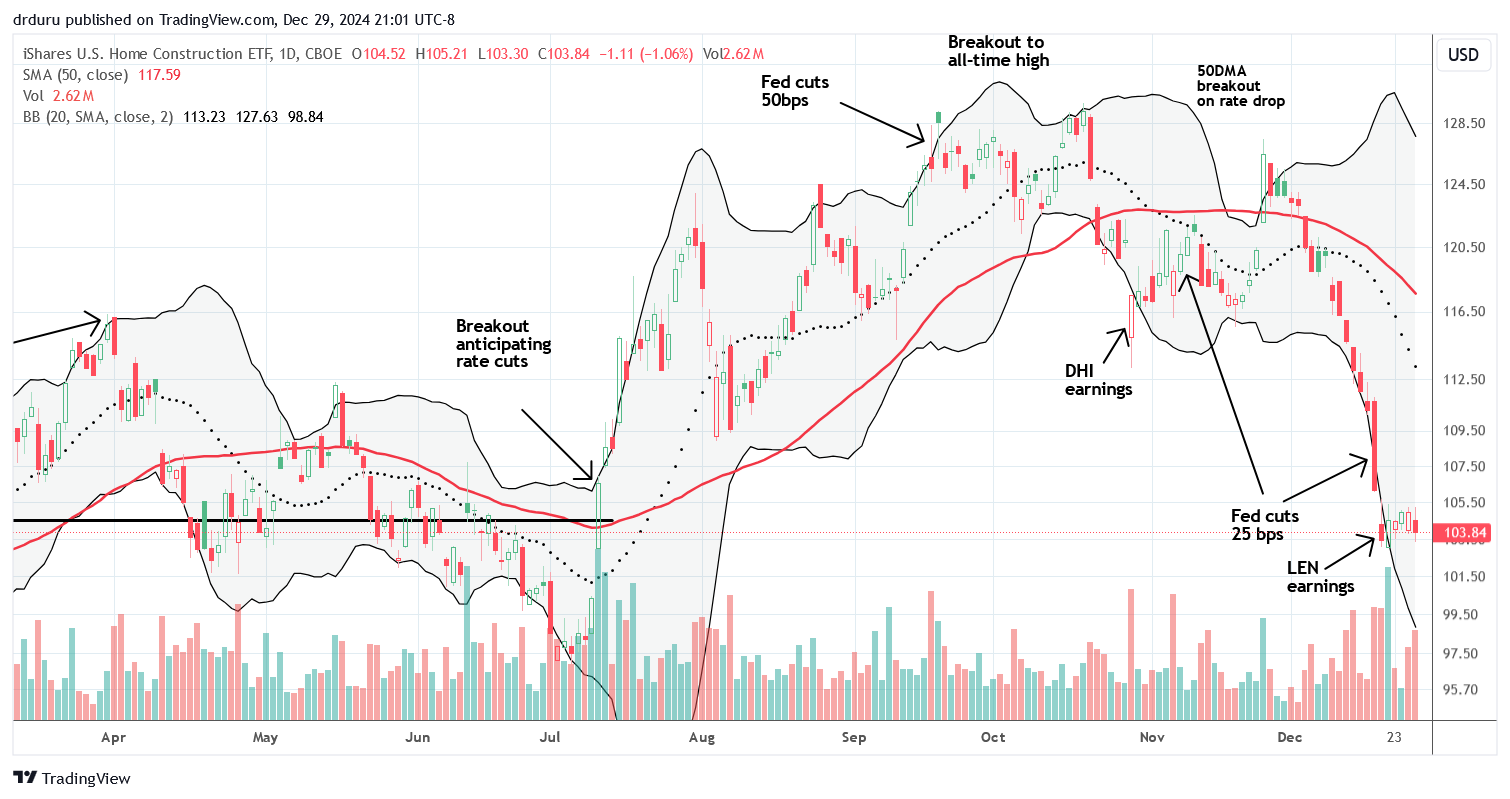
- The seasonally strong period for the stocks of home builders plunged into historic under-performance after November’s strong start.
- Home builder sentiment may be topping out as expected with a continued surge in 6-month sales expectations providing a contrary sign.
- Regional declines in single-family housing starts reveal underlying weakness and belie the rebound in builder sentiment.
- Sales of new single-family homes only partially recovered from October’s hurricane-impacted numbers. Median pricing continued a year-long weakening trend, mostly from mix effects.
- Sales of existing homes continued a sharp rebound off a 14-year low. However, there are signs suggesting this rebound will soon exhaust itself.
- America’s homelessness reached new record heights.
- Mortgage rates stabilized just under 7%.
Housing Stocks
The iShares US Home Construction ETF (ITB) followed a major pullback in October with a 5.6% rebound in November. December is shaping up to be the worst month of the year with a 16.1% loss month-to-date. In fact, this month is ITB’s worst since the onset of the pandemic. This terrible performance means that the seasonal trade on home builders has had one of its worst starts since ITB’s inception. Stubbornly high interest rates and a “tighter for longer” monetary policy are pressuring investor interest in home builders even as builder sentiment has rebounded. The Fed’s “hawkish” rate cut was particularly damaging for ITB. The ETF plunged 4.1% that day as the market absorbed the reality of the current rate environment. ITB is now clinging to a mere 2.1% year-to-date gain while the S&P 500 is up 25.2% year-to-date.
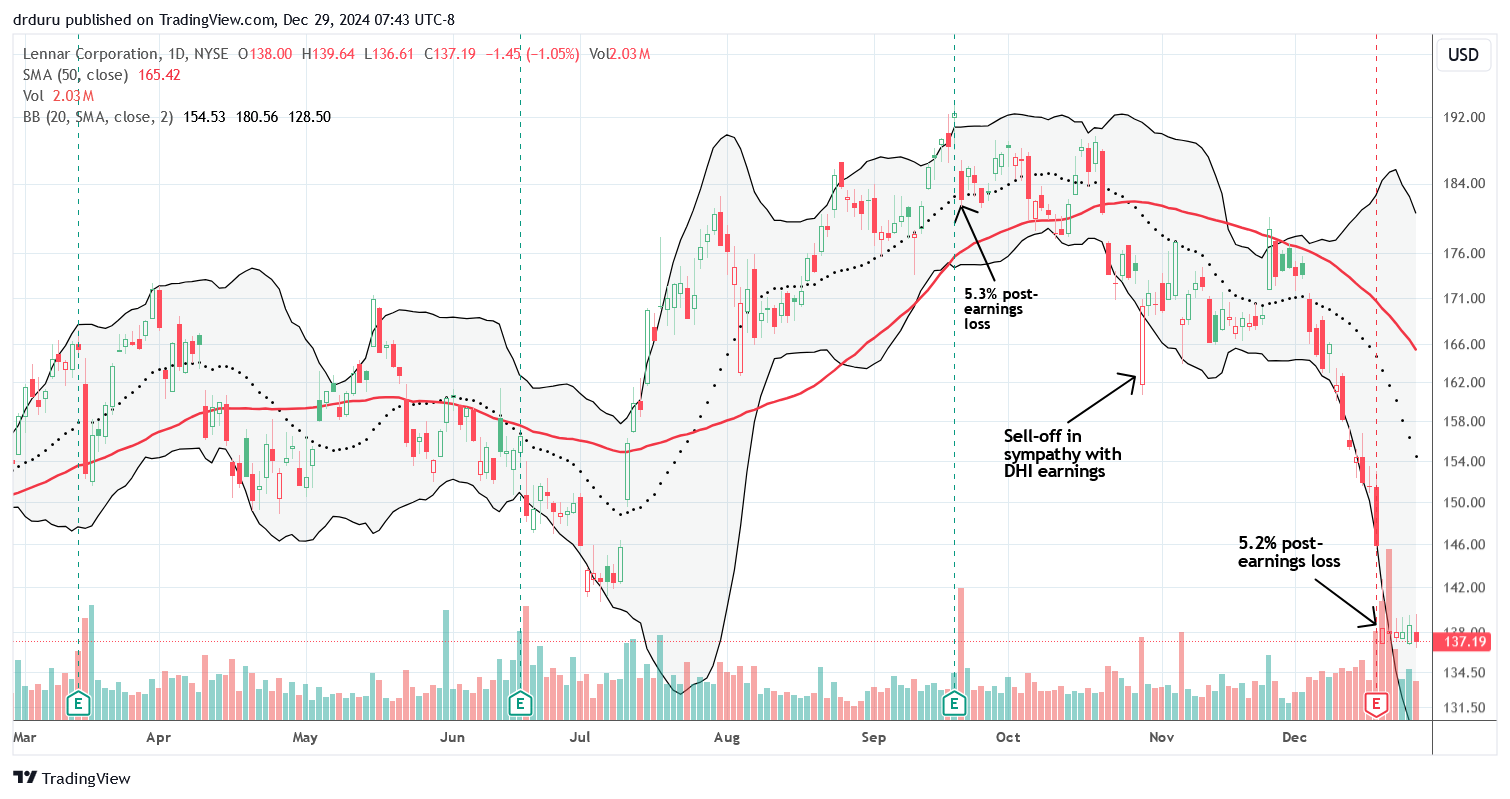
Lennar Corporation (LEN) reported earnings right after the Fed decision. So with investors already in a jittery mood, LEN’s disappointing report deepened worries in the sector. LEN fell 5.2% to a 52-week low. LEN is now down 8.0% for the year and is a major weight on ITB. This quote from the transcript of the earnings conference call sums up a lot of investor worries for lagging demand and sinking margins:
“While our execution in the fourth quarter was challenged by the rapid and unexpected change in the direction of interest rates, we did adjust and adapt to new market conditions and we adjusted incentives and pricing and we did not enable our inventory levels to spike. We are currently focused on keeping sales volume up as we accelerate in order to catch-up pace and correct the sales miss that we had in the fourth quarter. Of course, the catch-up in sales pace comes at a cost, and that cost is additional pressure on margin.”
Housing Data
Home Builder Confidence: The Housing Market Index – December, 2024
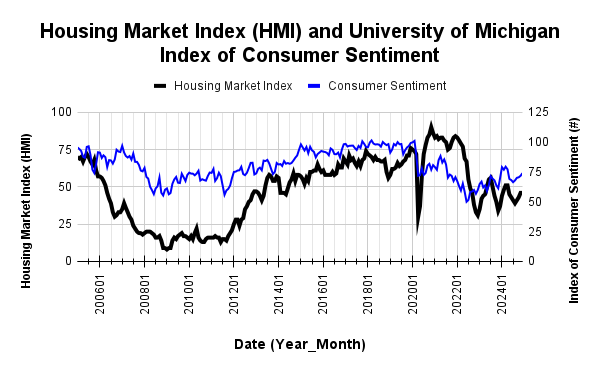
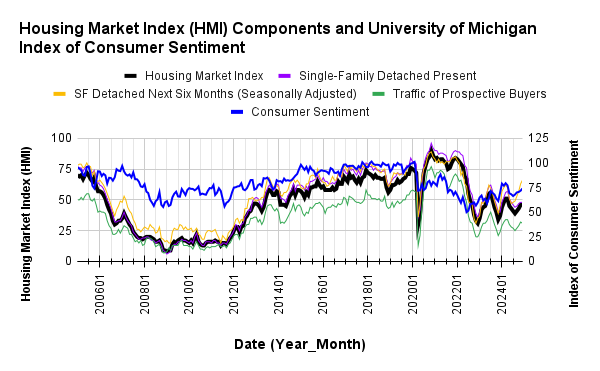
December was a month of stasis for the National Association of Home Builders (NAHB)/Wells Fargo Housing Market Index (HMI). The HMI remained flat at 46. Under the covers, the HMI components were quite divergent. The HMI index for current sales conditions, “Single-Family: Present”, kept the stasis theme by staying flat at 48. However, the other two components sharply diverged. The HMI index “Traffic of Prospective Buyers” declined a point to 31. Meanwhile, the HMI for sales expectations in the next six months, “SF Detached Next Six Months (Seasonally Adjusted)”, continued its sharp rebound from lows by tacking on another 3 points to levels last seen in April, 2022. The NAHB pointed to this component as a sign of underlying builder optimism. This on-going surge prevents me from declaring (just yet) confirmation of my prediction for a (short-term) top in the HMI.
Source for data: NAHB and the University of Michigan
Consumer sentiment continues to rise even as home builder sentiment may have stalled out in aggregate.
All the builder pricing metrics maintained the stasis theme. The 31% share of builders cutting prices is flat with November’s 31%. The share of builders providing incentives stayed flat month-over-month at 60%. The average price discount was also flat at 5%.
November’s HMI gains hid some surprisingly sharp regional divergences which made me think the HMI is in the process of topping out. December’s regional data did not quite dissuade me because it looks like a surge in builder optimism in the South drove a lot of HMI’s underlying optimism. This surge could be a natural rebound from the hurricane-impacted results of the last two months. At the same time the West retreated by a point and remains well off its October high of 44. The Northeast surged by 5 points for the second straight month and is now at 62, a level last seen in June. The Midwest stayed static at 48, just two points below its high of the year.
New Residential Construction (Single-Family Housing Starts) – November, 2024
Single-family housing starts bounced back across the 1M mark. The 1,011,000 starts were 6.4% above October’s hurricane-impacted 950K (revised downward) but down 10.2% year-over-year. Note that a year ago housing starts hit a major peak for this cycle so the comparables improve going forward.
![Housing starts US. Bureau of the Census, Privately Owned Housing Starts: 1-Unit Structures [HOUST1F], first retrieved from FRED, Federal Reserve Bank of St. Louis, December 18, 2024](https://drduru.com/onetwentytwo/wp-content/uploads/2024/12/20241218_Housing-starts-November-2024.png)
After apparently bottoming out over the summer, building permits continue to remain flat. Permits are still down 5.7% from January’s high of the year.
The South led all regions in sequential gains as a result of October numbers likely suppressed by hurricanes. Yet they still fell minimally year-over-year. All other regions plunged double-digits and declined month-over-month as well. The Northeast, Midwest, South, and West each changed -36.1%, -21.4%, -1.6%, -16.9% respectively year-over-year. Taken together, November starts looks weak and augur poorly for the spring 2025 selling season.
New Residential Sales (Single-Family) – November, 2024
In October, new home sales plunged to levels last seen November, 2023. The hope that this drop was exaggerated by hurricane-related impacts was dashed by a meager rebound in sales for November. November sales increased 5.9% from October to 664,000, a 8.7% year-over-year increase. The uptrend from the 2022 and 2023 lows is officially over and is making way for the potential of range-bound sales at best.
![new home sales US. Bureau of the Census, New One Family Houses Sold: United States [HSN1F], first retrieved from FRED, Federal Reserve Bank of St. Louis, December 24, 2024](https://drduru.com/onetwentytwo/wp-content/uploads/2024/12/20241224_New-home-sales-November-2024.png)
The median price for new homes has been on a very slight downtrend. There have only been three year-over-year price increases this year. For November, the median price dropped to 402,600, a near 3-year low, a 6.3% year-over-year plunge and even a 5.4% sequential decline.
While there have been no definitive trends in the distribution of sales across the price ranges, a very strong shift in sales to the lowest price tier clearly skewed November’s median price. For November, the under $300,000 price tier was the only range to increase its share. All others but the highest tier dropped in share. The under $300,000 price tier surged from October’s share of 13% to November’s 25% share; the share was 17% a year ago. The second highest share this year for this price tier was 20% in September. For context, October’s 13% was the lowest share of the year. While this volatility could be related to the hurricanes which hit lower-priced housing markets in the South, I am looking for the overall downtrend in price to continue as it is consistent with the affordability crisis.
November’s inventory dropped from October’s 9.5 to 8.9 months of sales. For comparison, a year ago inventory sat at 9.2 months of sales. Absolute inventory is continuing to rise sharply after remaining flat for most of the year. Absolute inventory was last this high almost 17 years ago. Note that overall inventory, new plus existing homes, remains below historical norms at 4.9 while sitting at near 7-year highs. Inventory could be a key story in 2025 as the housing market enters what looks like its next slowdown in activity.
The distribution in regional sales are aligned with the significant skew toward the under $300,000 price tier. The South and the Midwest experienced large jumps in sales both sequentially and year-over-year, while the West and the Northeast both dropped over these timeframes. The Northeast, Midwest, South, and the West changed -11.5%, +10.0%, +13.6%, and -1.4% respectively.
Existing Home Sales – November, 2024
(The National Association of Realtors (NAR) has finally made publicly available a wide range of current and historic data – supplemental data and a statistics summary)
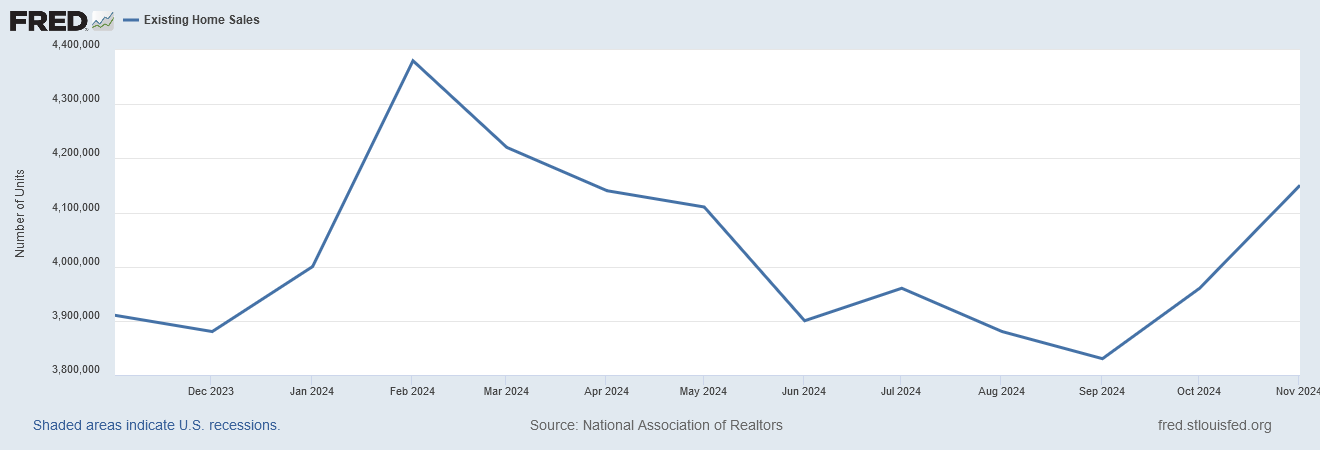
In October, existing home sales jumped sharply off 14-year lows for a 3.4% sequential gain for the first year-over-year gain in over 3 years. In November, sales jumped 4.8% month-over-month with a 6.1% year-over-year surge. On the surface, a kind of pent-up demand is seemingly being released. I doubt this surprising surge will be sustained given stubbornly high mortgage rates. For now, the on-going slowdown in existing home sales has taken a pause.
The NAR is much more optimistic: “Home sales momentum is building…More buyers have entered the market as the economy continues to add jobs, housing inventory grows compared to a year ago, and consumers get used to a new normal of mortgage rates between 6% and 7%.” Job growth and increased (year-over-year) inventory were not helping prior to the current 2-month spurt. I am particularly skeptical that consumers are getting used to the new normal of higher mortgage rates per the commentary from Lennar Corporation: “Fourth quarter was a challenge operating environment. As mortgage rates moved higher home buyers needed more help to achieve a monthly payment they can afford.” Will existing home owners finally drop prices?
(For historical data from 1999 to 2014, click here. For historical data from 2014 to 2018, click here) Source for chart: National Association of Realtors, Existing Home Sales© [EXHOSLUSM495S], retrieved from FRED, Federal Reserve Bank of St. Louis, December 20, 2024

While inventory increased year-over-year, it dropped sharply sequentially. Thus, inventory conditions have technically not improved and did not likely contribute to November’s surge in sales. The NAR reported November inventory at 1.33M, a 2.9% decrease month-over-month and up 17.7% year-over-year. According to the NAR, “Unsold inventory sits at a 3.8-month supply at the current sales pace, down from 4.2 months in October but up from 3.5 months in November 2023.” The months of supply and absolute inventory declined for a second month in a row. Thus, the jump in sales is actually putting a relative strain on already limited inventories.
Fortunately, the inventory drawdown did not put sequential upward pressure on prices. However, it is telling that year-over-year pricing jumped despite the surge in year-over-year inventories. The median sales price of an existing home hit an all-time high at $426,900 in June. November’s median price decreased marginally from October by 0.2% to $406,100, a healthy 4.7% year-over-year increase. Once again, the NAR chose to spin this now 16th consecutive year-over-year gain in a positive way: “Existing homeowners are capitalizing on the collective $15 trillion rise in housing equity over the past four years to look for homes better suited to their changing life circumstances.”
The average time on the market for an existing home increased to 32 days in November, up from 29 days in October and up significantly from the 25 days in November 2023.
In an encouraging sign, the share of sales to first-time home buyers jumped from 27% in October to 30% in November, yet still down slightly from 31% in November 2023. The NAR’s 2017 Profile of Home Buyers and Sellers reported an average of 34% for 2017, 33% for 2018, 33% for 2019, 31% for 2020, 34% for 2021, 26% for 2022, 32% for 2023, and a plunge to an all-time low of 24% in 2024.
Each region enjoyed a year-over-year jump in existing home sales with the West outright surging. The regional year-over-year changes were: Northeast +6.3%, Midwest +5.3%, South +3.3%, West +14.9%.
Every region also continued to experience year-over-year price increases. November was particularly strong for some regions. The regional year-over-year changes were: Northeast +9.9%, Midwest +7.3%, South +2.8%, West +4.0%.
Single-family existing home sales increased by 5.0% from October to 3.76M in November and jumped by 7.4% year-over-year. The median price of a single-family home was $410,900, up 4.8% year-over-year and nudged lower 0.2% month-over-month.
California Existing Home Sales – November, 2024
{There was no update as of the time of writing. I will update as soon as the CAR releases its report for November}
Home closing thoughts
America’s Homelessness Worsens
The U.S. Department of Housing and Urban Development (HUD) reported an 18% increase in America’s homeless in its Annual Homelessness Assessment Report. At the same time, the number of homeless military veterans fell to a record low. HUD also reported on numerous efforts across the country attempting to address this crisis including the following successes:
- Dallas – In 2021, Dallas transformed its homelessness response system with a focus on connecting individuals and families experiencing homelessness to housing. To do this they created the Street to Home Initiative – a $30 million public-private initiative which strives to cut unsheltered homelessness in half by 2026. The initiative led to a 16 percent decrease in homelessness between 2022 and 2024.
- Los Angeles – Struggling with a high-cost rental market, Los Angeles increased the availability of housing for individuals and families experiencing homelessness, combining Federal, City, and County funds. This led to a decline in homelessness for the first time in 7 years. Unsheltered homelessness throughout all of Los Angeles County declined by 5% since 2023.
- Chester County, PA – Chester County has taken several steps to address homelessness that have led to a nearly 60 percent decrease in homelessness since 2019. These efforts include eviction prevention case resolution, the expansion of housing first training programs, an increase in affordable housing groups, and fair housing education and prevention efforts specifically for migrant workers.
Spotlight on Mortgage Rates
The Mortgage Bankers Association (MBA) reported two weekly increases in mortgage applications in December versus one decrease as mortgage rates bounced in a tight range. New home mortgage purchase applications continued a strong year-over-year performance with a 7.2% jump in November. In July, new home mortgage purchase applications soared 9.5% year-over-year, increased 4.5% in August, soared again 10.8% in September and yet again 8.2% in October. November’s year-over-year increase was the 22nd consecutive month of such gains which is surprising given new home sales have been relatively range bound for almost two years.
After creeping higher in November, mortgage rates stopped short of the 7% level and kept a tight range in December.
![Freddie Mac, 30-Year Fixed Rate Mortgage Average in the United States [MORTGAGE30US], retrieved from FRED, Federal Reserve Bank of St. Louis; December 28, 2024](https://drduru.com/onetwentytwo/wp-content/uploads/2024/12/20241228_30-Year-Fixed-Rate-Mortgage-Average-in-the-United-States.png)
Be careful out there!
Full disclosure: long ITB shares and call options


