Housing Market Intro and Summary
What happened in the housing market in November, 2024? October’s reckoning transformed into a rebound with a boost from a sharp drop in long-term interest rates. The partial recovery came just in time for the seasonal strength in the stocks of home builders. The housing data for October showed mixed results with mixed messages for prospects in the coming months.
- The seasonally strong period for the stocks of home builders got off to a strong start.
- Home builder sentiment showed sharp regional and component divergences that suggest recent overall gains will soon top out even as builders take back pricing power.
- Single-family housing dropped sharply, led by the hurricane-impacted South.
- Sales of new single-family homes plunged, led by the hurricane-impact South, with inventories reaching 16-year highs.
- Sales of existing homes rebounded sharply off a 14-year low with the South apparently managing to avoid hurricane impacts.
- California existing home sales again followed the national rebound. Total active listings continue to surge higher.
- An historic gap has opened between the cost of renting and buying a home.
- Mortgage rates steadily rose for the second straight month but a plateau at 7% is likely.
Housing Stocks
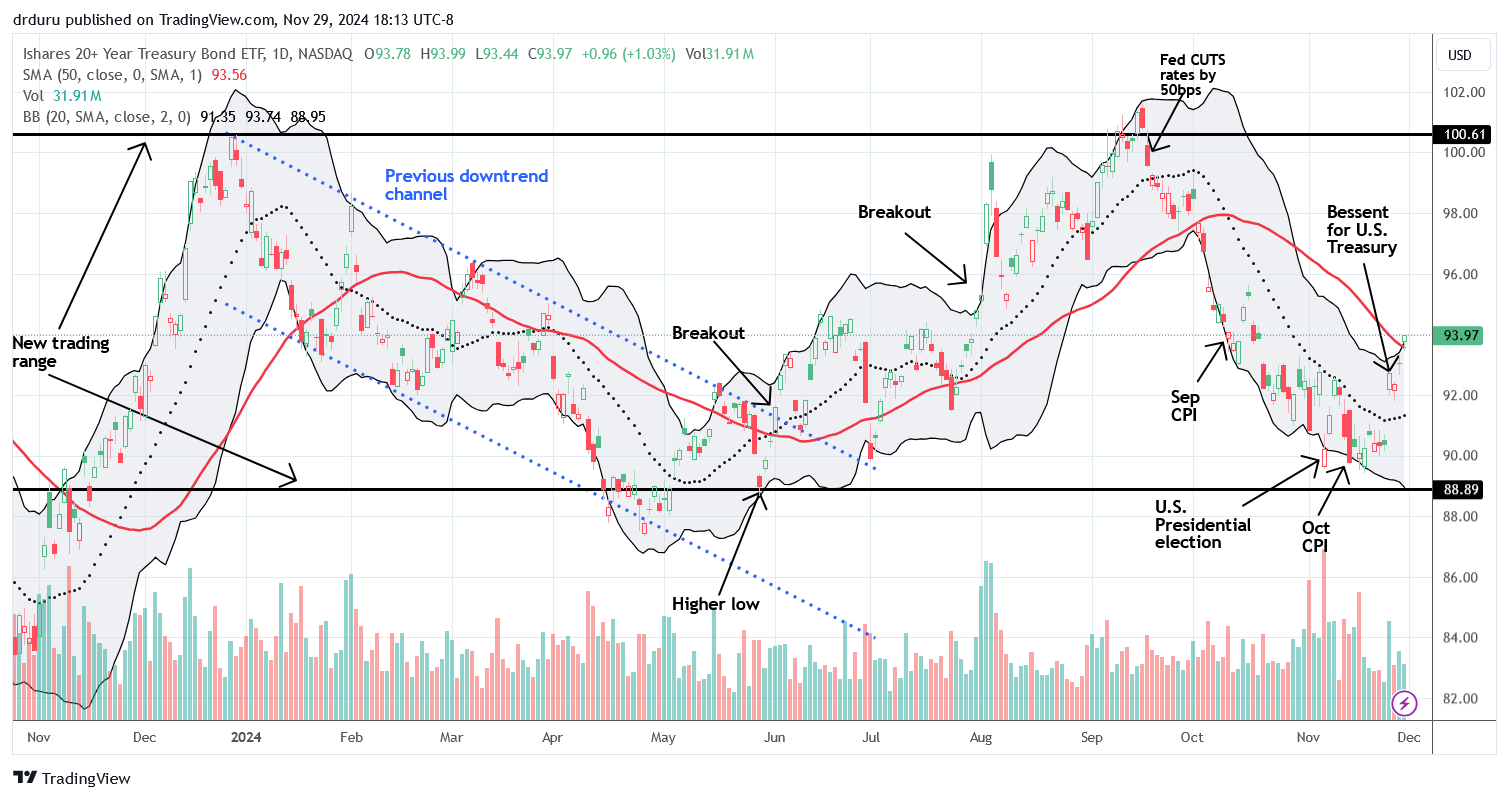
The iShares US Home Construction ETF (ITB) followed its second worst month of the year with a 5.6% rebound in November. That gain made for a great start to the seasonally strong period for home builders which kept pace with the S&P 500’s (SPY) gain of 5.7% for the month. However, I was slow to get on board with short-term trades because ITB traded just below its 50-day moving average (DMA) for most of the month. When long-term interest rates suddenly plunged after president-elect Trump picked Scott Bessent to lead the U.S. Treasury, ITB soared in sympathy. The 5.1% surge that day generated a 50DMA breakout. Perhaps in telling fashion, the momentum stopped there. Still, I finally made my first seasonal trades the following day after ITB fell back 2.1% (presumably on weak new home sales reported for October).
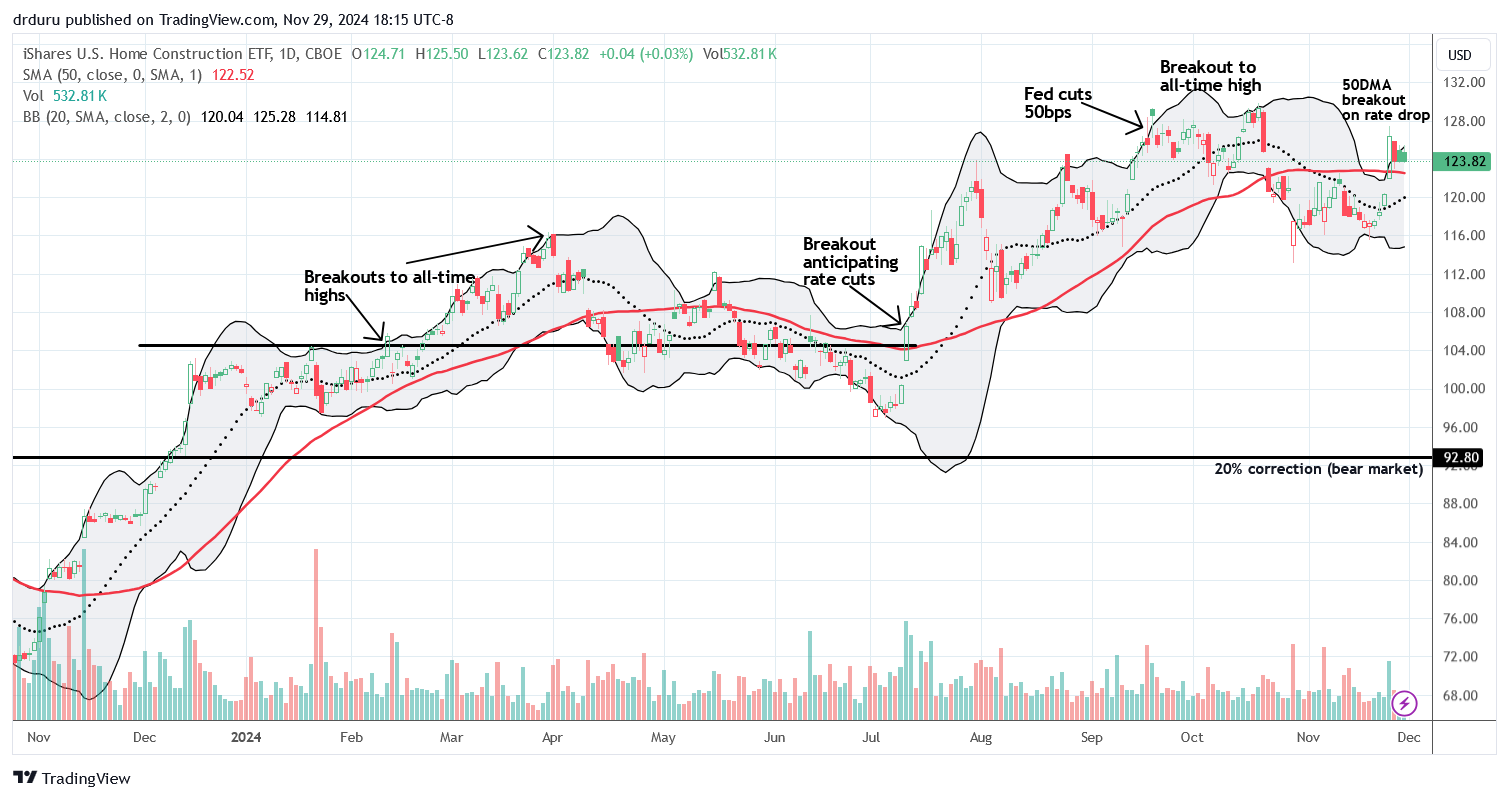
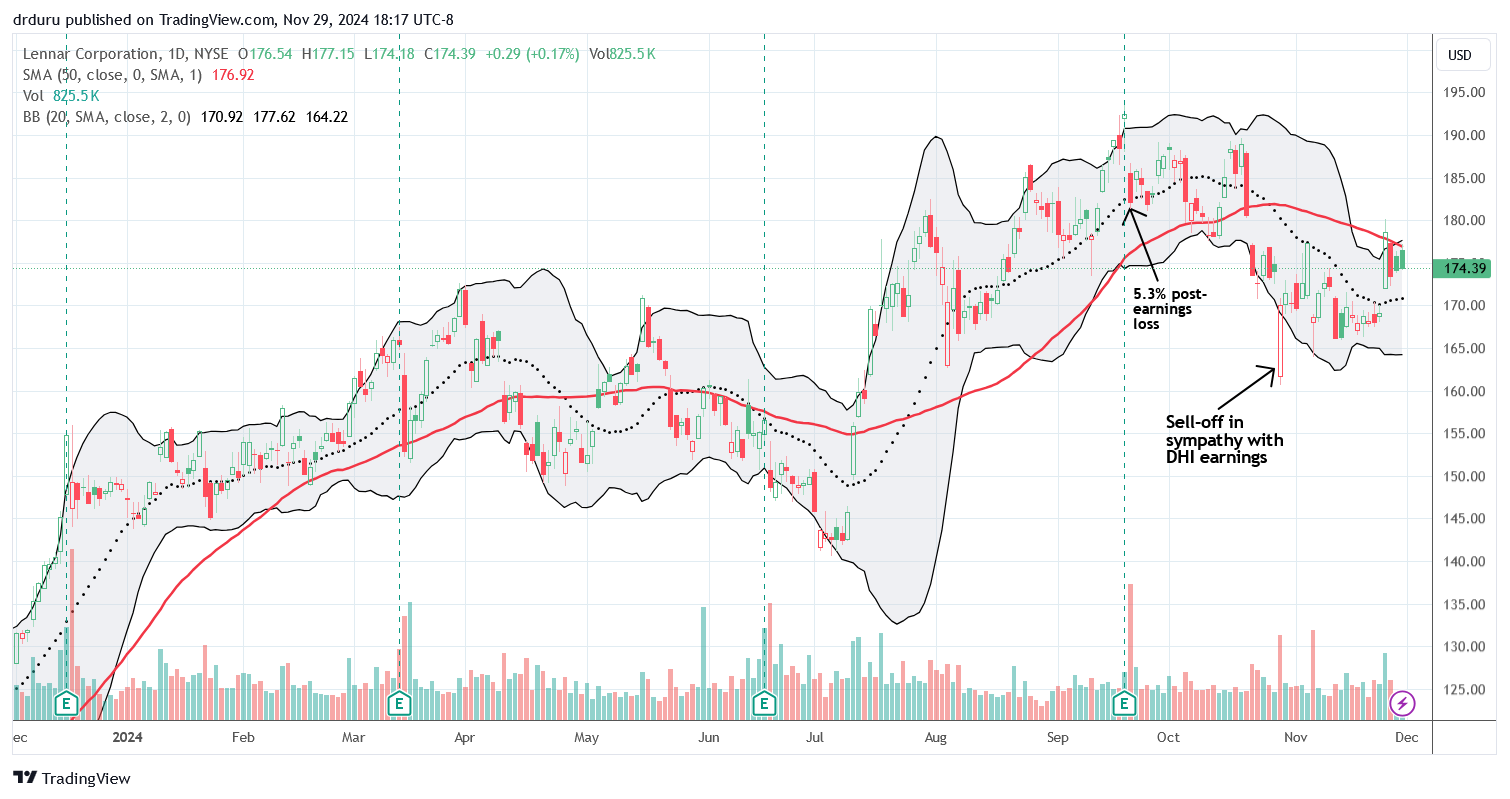
While ITB is back in bullish position, the fallout from DR Horton’s (DHI) last earnings report continues to weigh on the sector. Lennar Corporation (LEN) fell as much as 7.7% before ending that day with a 2.3% loss. LEN went on to recover all its losses, but the stock failed to break out above 50DMA resistance last week. LEN also remains weighed down by its own earnings letdown in September.
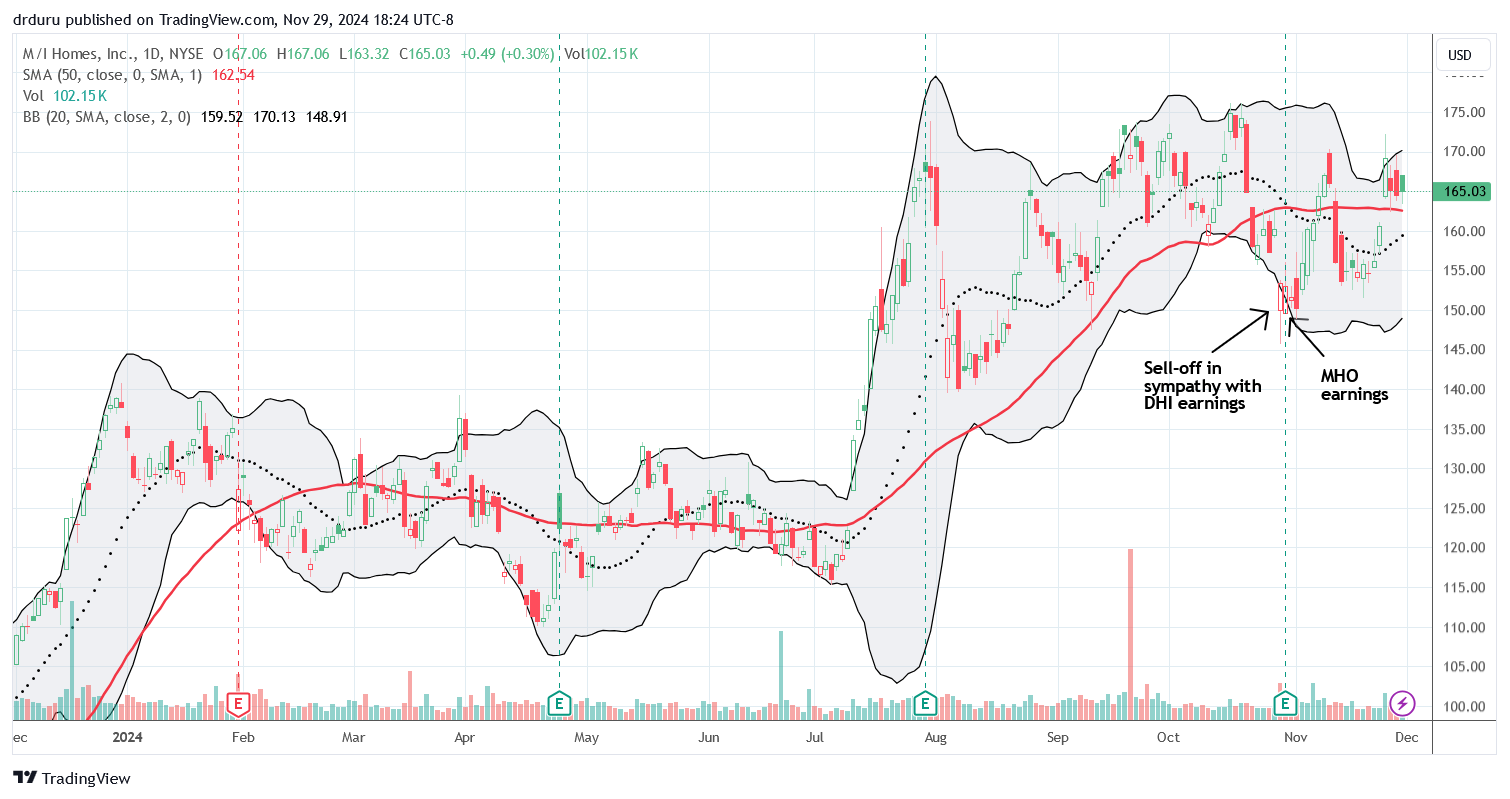
M/I Homes, Inc (MHI) made an impressive post-DHI, post-earnings rebound after the company issued reassurances to investors. MHI is essentially pivoting around its 50DMA while remaining stuck in a 4-month trading range. My best guess is that this trading range will hold firm for at least the next several months.
Housing Data
Home Builder Confidence: The Housing Market Index – November, 2024
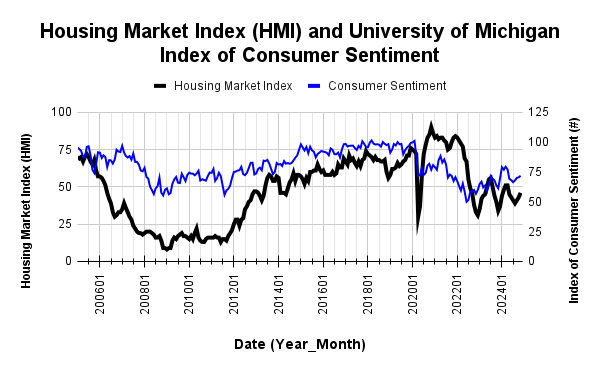
The National Association of Home Builders (NAHB)/Wells Fargo Housing Market Index (HMI) continued its rebound with a third straight monthly gain. The three point increase from October’s 43 HMI outpaced the previous 2-point increase. As always, the NAHB has on-going worries about “headwinds such as an ongoing shortage of labor and buildable lots along with elevated building material prices.” The NAHB is also warily watching the steady rise in long-term interest rates.
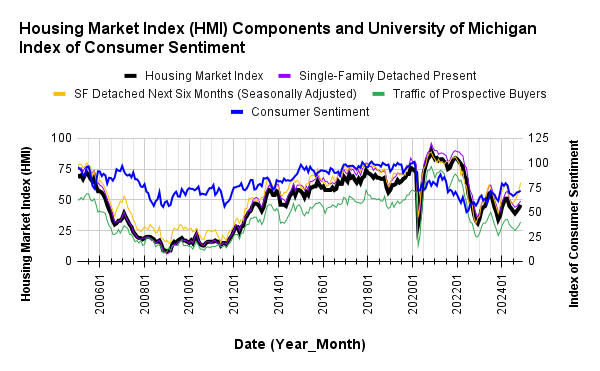
The HMI component for the next 6 months (Single-Family: Next Six Months) started increasing in July and jumped 4 points for October and surged 7 points for November. At 64 this component is at its highest point since April, 2022 right when the Federal Reserve start hiking rates. However, with the component for the Traffic of Prospective Buyers failing to keep pace, I suspect the optimism for future sales will soon slow if not top out altogether.
Source for data: NAHB and the University of Michigan
While consumer sentiment makes a steady but slow rebound from the summer lows, the SF Detached Next Six Months sharply diverged from the other two components.
The 31% share of builders cutting prices is down from October and September’s 32%, down from 33% in August, flat with the 31% in July. The share of builders providing incentives decreased from 61% in October to 60% in November. The average price discount fell from 6% to 5%. Clearly, builders are feeling more confident about their pricing power even as affordability remains a large challenge for buyers.
November’s HMI gains hid some surprisingly sharp divergences which make me think HMI is already topping out for the short-term (perhaps a top of 50 by the spring selling season?). While the Northeast and Midwest each surged 7 and 6 points respectively, the bigger markets in the South and West retreated 1 and 5 points respectively. The Midwest is now just one point off its high for the year. The West is just two points off its low. The South, a source of on-going concern, is just 3 points off its low for the year set in August.
New Residential Construction (Single-Family Housing Starts) – October, 2024
Single-family housing starts fell below the 1M mark for the first time in 3 months. The 970K starts were 6.9% below September’s 1,042K (revised upward) and down 0.5% year-over-year. Starts looked like they were rebounding alongside sentiment, so October’s drop broke the pattern. However, it is very likely that hurricanes pressured the start numbers downward. (As usual, the U.S. Bureau of the Census provided no explanations for the numbers).
![Housing starts US. Bureau of the Census, Privately Owned Housing Starts: 1-Unit Structures [HOUST1F], first retrieved from FRED, Federal Reserve Bank of St. Louis, November 20, 2024](https://drduru.com/onetwentytwo/wp-content/uploads/2024/11/20241024_Housing-starts-October-2024.png)
After apparently bottoming out over the summer, building permits have now flattened out. Permits are still down 6.1% from January’s high of the year.
Likely due to hurricanes, starts in the South plunged from the previous month. Yet they fell minimally year-over-year. The Northeast fell even further on a percentage basis, but the region was still up year-over-year. The region surged large double digits in the two prior months. The Northeast, Midwest, South, and West each changed +9.8%, +19.1%, -1.8%, and -9.1% respectively year-over-year. The West was up 4.6% sequentially.
New Residential Sales (Single-Family) – October, 2024
New home sales plunged to levels last seen November, 2023. The regional mix in sales changes suggests the impact was hurricane-related. Surprisingly, the NAHB only called out a driver of the big sales drop in the title of a related article; and that driver was limited to higher rates. Thus, the accompanying pullback in the shares of homebuilders was likely overdone. October sales decreased 17.3% from September to 610,000, a 9.4% year-over-year decrease. The uptrend from the 2022 and 2023 lows came to an abrupt end, reinforced by languishing existing home sales.
![new home sales US. Bureau of the Census, New One Family Houses Sold: United States [HSN1F], first retrieved from FRED, Federal Reserve Bank of St. Louis, October, 2024](https://drduru.com/onetwentytwo/wp-content/uploads/2024/11/20241126_New-home-sales-October-2024.png)
The median price jumped to $437,300, right to the top of the recent range. The 4.7% year-over-year increase was the second highest of the year. There have only been three year-over-year price increases this year. This news is bad for prospective buyers after a year mostly filled with year-over-year declines.
There are still no definitive trends in the distribution of sales across the price ranges despite what I have assumed is an on-going scramble for affordable homes. For October, homes sold below the $400,000 level significantly dropped in share year-over-year. The six percentage point drop likely explains the majority of the change.
October’s inventory surged from 7.7 (revised up) to 9.5 months of sales. For comparison, a year ago inventory sat at 7.9 months of sales. While the relative surge is from the likely one-off plunge in demand, absolute inventory is now rising after remaining flat for most of the year. Absolute inventory was last this high in early 2008. I thought a breakout to the upside would accompany lower prices, but a price rebound looks too strong. Note that overall inventory, new plus existing homes, remains below historical norms at 4.9.
Regional sales in October experienced another wide range given the big change in the South. The Northeast, Midwest, South, and the West changed +35.3%, +15.9%, -19.7%, and -1.3% respectively.
Existing Home Sales – October, 2024
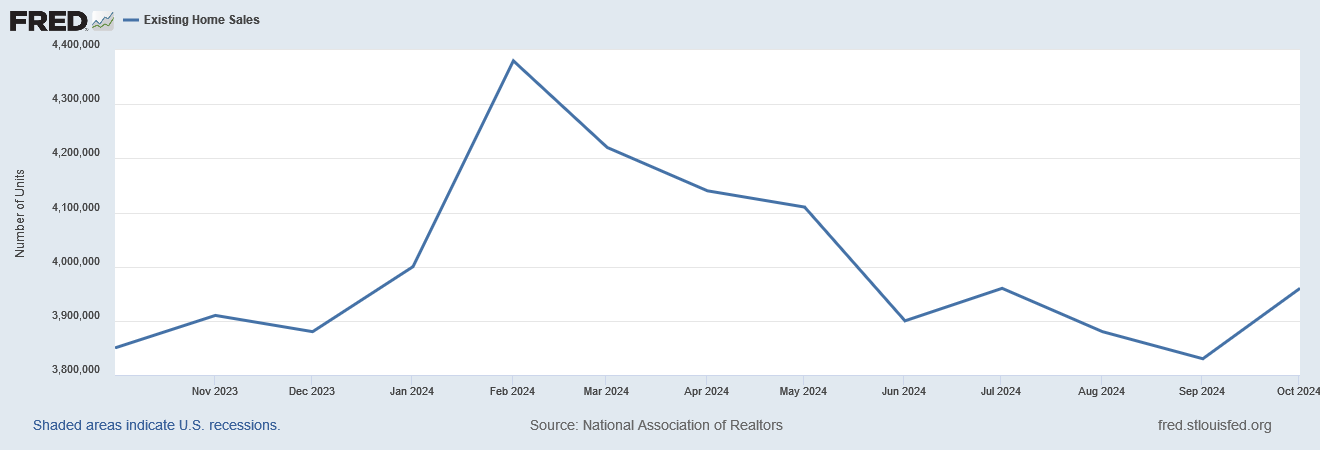
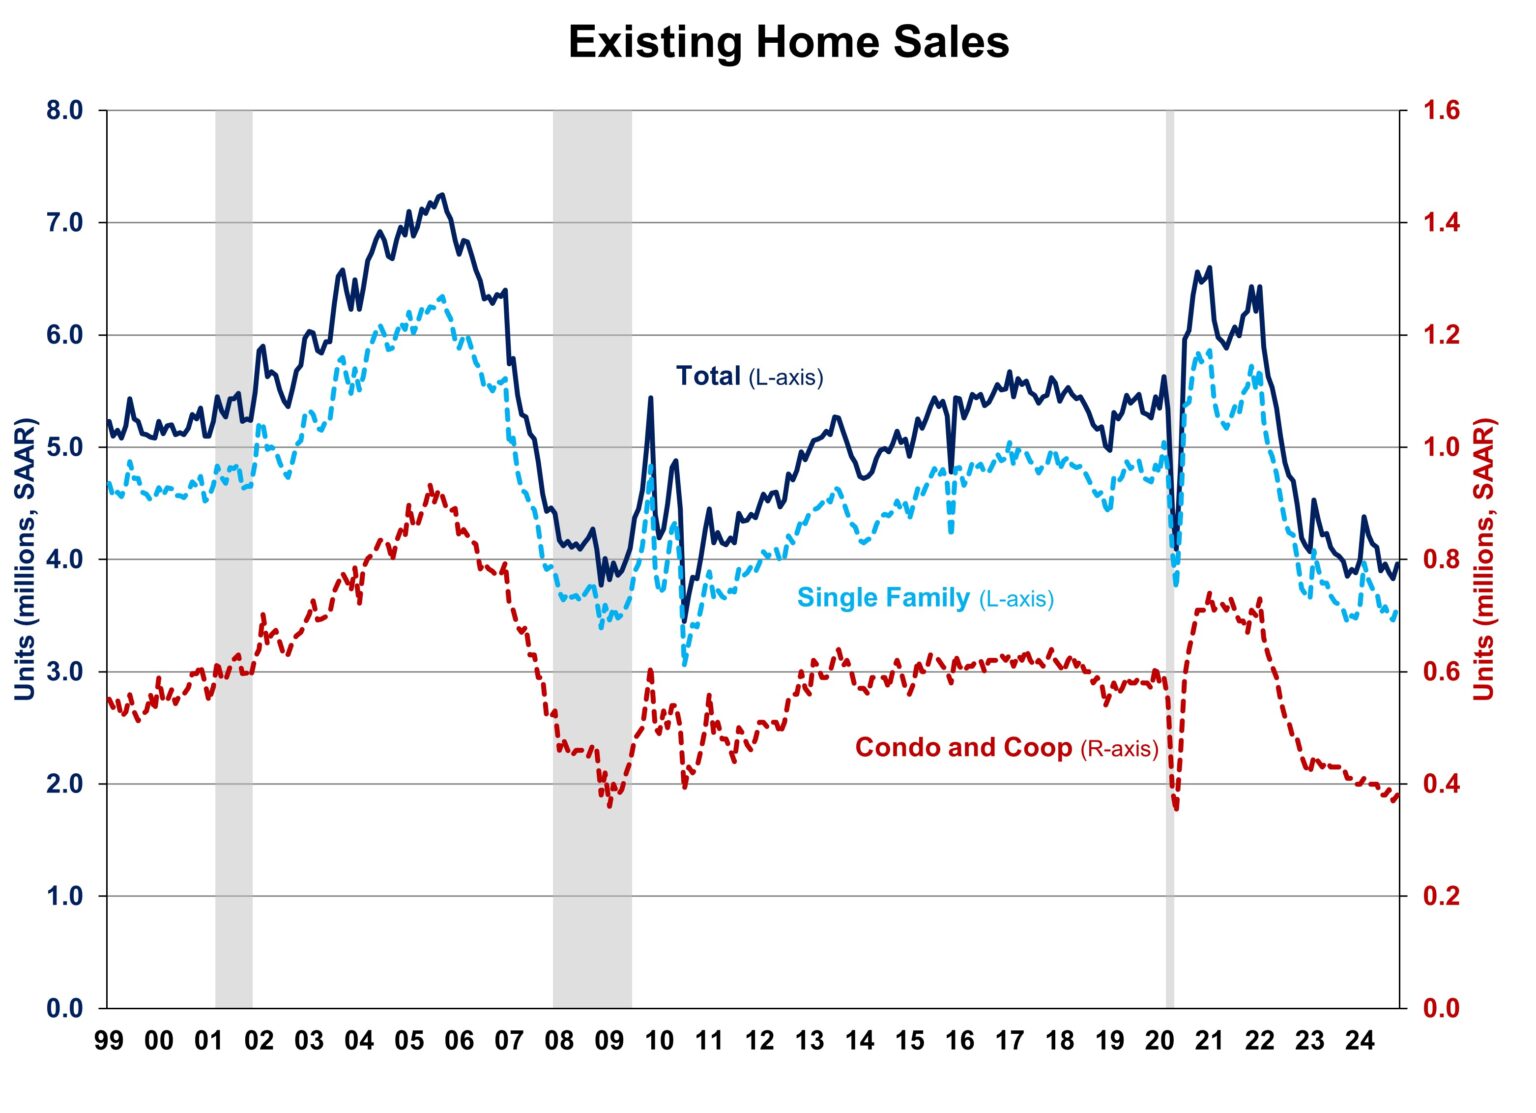
Existing home sales jumped sharply off 14-year lows for a 3.4% sequential gain and a 2.9% year-over-year gain. The monthly gain from 3.83M (revised downward) to 3.96M units sold delivered the first year-over-year gain in existing home sales in over 3 years. For now, the on-going slowdown in existing home sales has taken a pause. The sudden jump encouraged the National Association of Realtors: “The worst of the downturn in home sales could be over, with increasing inventory leading to more transactions.” Of course, October becomes that rare month where increasing inventories actually accompanied increasing sales.
(For historical data from 1999 to 2014, click here. For historical data from 2014 to 2018, click here) Source for chart: National Association of Realtors, Existing Home Sales© [EXHOSLUSM495S], retrieved from FRED, Federal Reserve Bank of St. Louis, November 21, 2024
October’s inventory increase came as a result of adjusting September’s absolute inventory downward from 1.39M. The NAR reported October inventory at 1.37M, a 0.7% gain month-over-month and up 19.1% year-over-year. According to the NAR, “Unsold inventory sits at a 4.2-month supply at the current sales pace, down from 4.3 months in September but up from 3.6 months in October 2023.” With the months of supply going down, it is not quite clear that sales were boosted by a supply increase.
The median sales price of an existing home hit an all-time high at $426,900 in September. October’s median price increased marginally by 0.1% to $407,200, a 4.0% year-over-year increase. Given the month’s sales gains, the NAR chose to spin this 15th consecutive year-over-year gain in a positive way: “The ongoing price gains mean increasing wealth for homeowners nationwide…Additional inventory and more home building activity will help price increases moderate next year.” In other words, somehow everyone wins, owners and buyers.
The average time on the market for an existing home increased to 29 days in October, up from 28 days in September and up significantly from the 23 days in October 2023.
The share of sales to first-time home buyers increased from 26% to 27% in October, nudging off the all-time low from August 2024 and November 2021, and down slightly from 28% in October 2023. The NAR’s 2017 Profile of Home Buyers and Sellers reported an average of 34% for 2017, 33% for 2018, 33% for 2019, 31% for 2020, 34% for 2021, 26% for 2022, 32% for 2023, and a plunge to an all-time low of 24% in 2024. Affordability challenges helped to drive this plunge.
Existing home sales in the South seemed to suffer little to no impact from the hurricane including month-over-month sales increasing 2.9%. Three of four regions gained in sales. The regional year-over-year changes were: Northeast 0%, Midwest +1.1%, South +2.3%, West +4.4%.
Every region continued to experience a year-over-year price increase. Weakening price trends in the South still persist: Northeast +7.6%, Midwest +7.2%, South +0.9%, West +4.4%.
Single-family existing home sales increased by 3.5% from September to 3.58M in October and jumped by 4.1% year-over-year. The median price of a single-family home was $412,200, up 4.1% year-over-year and nudged higher 0.2% month-over-month, ending three straight months of declines.
California Existing Home Sales – October, 2024
The wait-and-see attitude that the California Association of Realtors (C.A.R.) blamed for slow sales in September gave way to a flood of interest in October. However, per the C.A.R.’s explanation, October was aided by the (belated?) close of sales from August and September. If so, then the proof of stronger sales may have to wait until the onset of the 2025 spring selling season.
According to the latest report from the California Association of Realtors, existing single-family home sales totaled 264,870 in October, marking a 4.7% increase from September’s (unrevised) 253,010 and a 9.5% year-over-year increase. The outsized year-over-year jump came from a very low base in October, 2023.
The C.A.R. continues to observe significant differences in sales above and below the $1M price threshold. Unfortunately, for October, it seems the organization forgot to update the numbers in their (presumed) template: “While the sales pace for the $1 million-and-higher price segment remained moderately low in October at 3.9 percent, sales in the sub-$500,000 market continued to underperform, dropping 8.6 percent from a year ago.” While the month was updated, the percentages are the same as September. Moreover, they are inconsistent with the headline gains.
The median home price in October increased 2.4% month-over-month to $888,740 and jumped year-over-year by 5.8%. This year-over-year increase marked the 16th consecutive month of gains.
The median time it took to sell a home in California rose to 25 days in October, up from 24 days in September and from 20 days a year ago.
The statewide sales-price-to-list-price ratio fell slightly to 99.9% after 8 straight months at 100.0%. The ratio was 100.0% in October, 2023. The price per square foot for an existing single-family home in California was $442 in October, a 5.5% increase from a year ago.
New active listings increased for the tenth straight month, while the Unsold Inventory Index (UII) also rose but just year-over-year. The UII decreased from 3.6 months in September to 3.1 months in October and was up from 2.8 months a year ago. Total active listings grew 31.5% year-over-year, marking the ninth consecutive month of annual gains and the eighth straight month of double-digit increases in total active listings.
Home closing thoughts
Housing Solutions
Marketplace interviewed various experts for different solutions to the shortage in housing (which in turn should alleviate the affordability problems). The moratorium on capital gains tax on sales to first-time home buyers is the most intriguing (and one I have never heard of before).
An Epic Example of California’s Inability to Boldly Solve Its housing Problems
In Season 3, Episode 9 of SOLD OUT: Rethinking Housing in America, “Forever Dreaming, California”, KQED tells the current story, and failures, of the ambitious California Forever housing development project proposed for Solano County. The compelling narrative is a classic example of the difficulties and challenges facing anyone and everyone with big ideas to help address California’s housing shortages and lack of affordability. The podcast covers the pros and cons of the development and interviews California Forever’s founder Jan Sramek.
Sramek’s failure to-date to get approval for this development has sent him and his real estate venture Flannery Associates back to the drawing board for the next two years. After this time, Sramek hopes to present a proposal that addresses the concerns of locals while still offering the benefits of the additional housing in a walkable community: “The East Solano Plan brings at least 53,000 good paying jobs, $44 million in net tax surplus, 22,000 affordable homes, and clean energy to Solano County – all by 2040.”
Stay tuned.
An Historic Gap Between the Cost of Owning and Renting A Home
In “Owning a home has rarely been this much more expensive than renting” Yahoo Finance reported on the findings of CBRE that “pegs the premium to buy versus own at about 35% earlier this year, with the dip in mortgage rates in the fall helping bring that level down from a record high of 52%.” Given owners are not in a rush to sell homes, this premium looks likely to persist unless mortgage rates fall further. According to the article, it will take 3.5% mortgage rates to even things out again.
Spotlight on Mortgage Rates
The Mortgage Bankers Association (MBA) reported three weekly increases in mortgage applications in November versus one decrease despite a continued rise in mortgage rates. New home mortgage purchase applications continued a strong year-over-year performance with an 8.2% jump in October. In July, new home mortgage purchase applications soared 9.5% year-over-year, increased 4.5% in August and soared again 10.8% in September. October’s year-over-year increase was the 21st consecutive month of such gains which is surprising given new home sales have been relatively range bound for almost two years.
Mortgage rates continued to creep higher in November. The 7% level is a likely top as long-term rates are finally coming down again.
![Freddie Mac, 30-Year Fixed Rate Mortgage Average in the United States [MORTGAGE30US], retrieved from FRED, Federal Reserve Bank of St. Louis; November 29, 2024](https://drduru.com/onetwentytwo/wp-content/uploads/2024/11/20241129_30-Year-Fixed-Rate-Mortgage-Average-in-the-United-States.png)
Be careful out there!
Full disclosure: long ITB shares and call options, long TLT puts


