

Housing Market Intro and Summary
What happened in the housing market in September, 2024? Existing home sales fell into a deeper downturn while new home sales maintained an uptrend from recent troughs. Rate cuts are helping to bottom out sentiment for builders. However, great anticipation of a rate cut from the Federal Reserve gave way to the disappointing earnings results of two major home builders. While lower mortgage rates are helping to boost sentiment in the market, the lack of relief in sticker prices promises to keep a lid on sales and buyer enthusiasm, especially for first-time home buyers. Thus, I remain wary of the lofty levels of the stocks for home builders, and I see the potential for downside surprises in the housing data in coming months.
The key messages from the housing data reported in September showed new weaknesses in sales but sentiment is pointing toward better markets ahead.
- The stocks of home builders have stalled since an initial jump after the Federal Reserve cut interest rates by 50 basis points. Earnings for builders since then also disappointed investors.
- Home builder sentiment gained 2 points and ended a 4-month losing streak. A strengthening outlook on future sales is supporting a bottoming in sentiment.
- Single-family housing starts rebounded sharply and recovered all of the drop from July’s hurricane impacted numbers. Building permits appear to be bottoming.
- Sales of new single-family homes pulled back slightly but continue a slow and steady uptrend from the 2022 and 2023 troughs.
- Sales of existing homes resumed their weakness by falling close to 2023 lows. The market for existing homes seems locked in a worsening downturn as rising inventories fail to stoke demand or dampen prices.
- California existing home sales followed the national trend downward. Homes priced both above and below $1M fell in sales.
- The share of new home sales going to first-time home buyers fell slightly for the second year in a row.
- The recent vice presidential debate generated two very different visions for achieving housing affordability.
- Rent control is in the spotlight again in California. A proposition seeks to return control of price-fixing mechanisms to local governments.
- The Mortgage Bankers Association (MBA) applauded the ROAD to Housing Act which is working its way through the legislative process.
- Mortgage rates continue to fall even as long-term interest rates have risen since the Fed cut rates.
Housing Stocks
After an astounding 19.3% gain in July, the iShares US Home Construction ETF (ITB) gained just 0.3% in August and found a 5.1% revival in September in anticipation of Fed rate cuts. The ETF full of home builders continues to outpace the S&P 500 this year with a 24.9% to 20.8% performance advantage through the end of September. The chart below shows how ITB rebounded first from the August calamity and then the September pullback to meet the highly anticipated Fed rate cut with a healthy gain from the July breakout. That rate cut was so highly anticipated that ITB has made no more progress since the rate cut besides the brief jump the next day to an all-time high.
")
Part of ITB’s problem is that one of its largest components, Lennar Corporation (LEN), disappointed investors in its last earnings report. LEN dropped from an all-time high with a 5.3% post-earnings loss. LEN has held steady since then with support at the 20-day moving average (DMA) (the dotted line below) holding firm for now.
")
KB Home (KBH) also suffered a small post-earnings setback. KBH lost 5.4% post-earnings but held support at its 50DMA (the red line below).
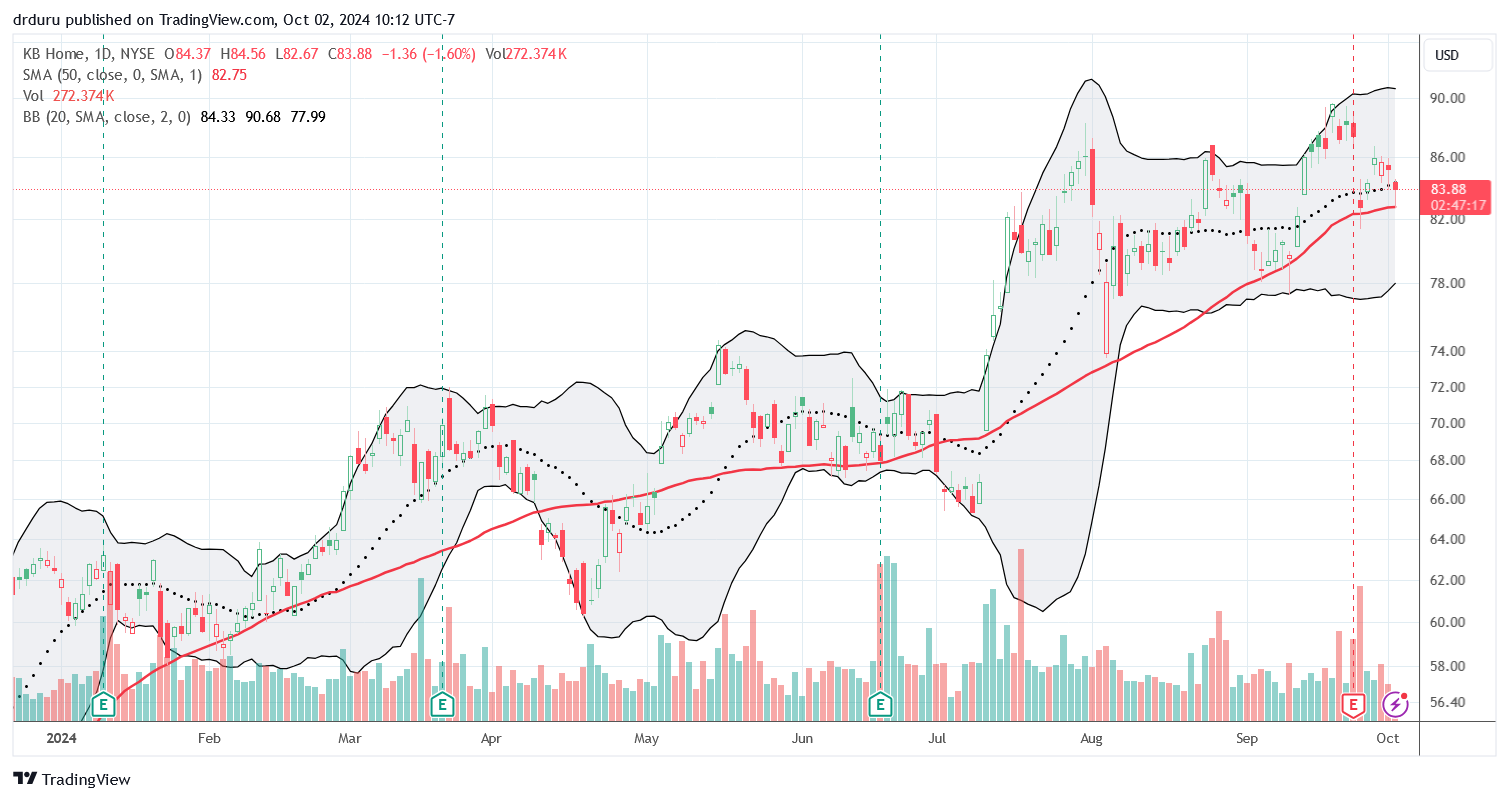
Given the high level of expectations going into last month’s Fed rate cut, I do not expect much more upside for home builders in the short-term (and yes, I have expressed on-going surprise at investor enthusiasm for these stocks at this economic juncture). I also expect lofty prices on individual home builders to soften a bit after earnings reports, similar to the experiences with LEN and KBH. The increased spotlight on housing affordability adds an interesting twist to the price action for builders given greater affordability will not (should not) mean increased profitability for builders.
Housing Data
Home Builder Confidence: The Housing Market Index – September, 2024
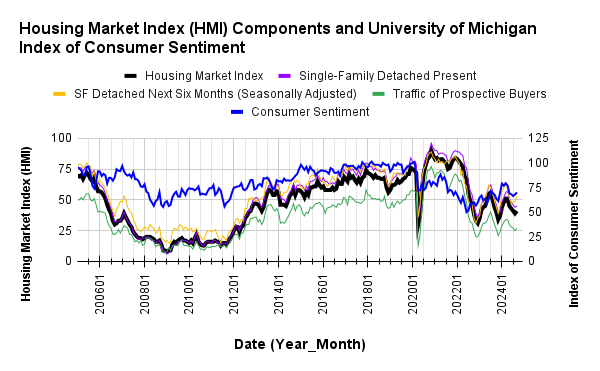
The National Association of Home Builders (NAHB)/Wells Fargo Housing Market Index (HMI) finally logged a gain. The two point increase from August’s 39 HMI ended a 4-month losing streak. The NAHB celebrated an improved outlook on future sales, but noted that lower interest rates would also bring more inventory to the market from existing home owners. The HMI component for the next 6 months (Single-Family: Next Six Months) started increasing in July, so the underlying dynamics point toward a bottom in the aggregate HMI.
/Wells Fargo Housing Market Index (HMI) and the University of Michigan Index of Consumer Sentiment")
Source for data: NAHB and the University of Michigan
I earlier expected that better sentiment from consumers could eventually drag builder sentiment higher. That expectation seems to be playing out now.
Builders finally felt less pressure to reduce prices, probably a result of declining mortgage rates. The 32% share of builders cutting prices is down from 33% in August but still higher than the 31% in July. The share of builders providing incentives decreased from 64% (adjusted) in August to 61% in September, taking the share from its highest point since April, 2019 to its lowest point since April 2019. Moreover, the average price discount fell from 6% to 5%, ending a streak of 14 months at 6%. These reduced pricing pressures are bad news for home buyers as builders are clearly getting ready to “eat” into the savings buyers are receiving from lower mortgage rates. (Duly note this response as a likely dynamic as various government entities push affordability initiatives).
The HMI in each region increased with the Northeast soaring by 9 points into “positive” territory at 55. The Northeast is the only region back in positive territory. The South was a laggard again. The region’s HMI increased by just 1 point off its low for the year. I continue to watch the South with concern. The Midwest increased by 4 points and the West surged by 5 points.
New Residential Construction (Single-Family Housing Starts) – August, 2024
In July, single-family housing starts fell to a new low of the year and looked set to match the lows from 2023. August’s 15.8% month-over-month surge took starts right back to the previous low of the year. Starts in August hit 992,000, a 5.2% year-over-year gain. Starts fell with builder sentiment and are now rebounding sharply as the sentiment improves about future demand. Some analysts blamed July’s weak starts on Hurricane Beryl which hit Texas in July. The sharp rebound in August seems to reinforce that conclusion. Hurricane Helene may have a lesser short-term impact on start activity.
![US. Bureau of the Census, Privately Owned Housing Starts: 1-Unit Structures [HOUST1F], first retrieved from FRED, Federal Reserve Bank of St. Louis, September 29, 2024](https://drduru.com/onetwentytwo/wp-content/uploads/2024/09/20240929_Housing-starts-August-2024.png "Housing starts")
Revisions changed July’s continued decline in building permits to a slight increase. So August’s 2.8% sequential increase seems to have carved out the bottom in permits that I anticipated with the deceleration in declines. The year-over-year change turned negative in June for the first time since May, 2023. The year-over-year declines have slightly improved since then (although still negative), and thus reinforce a likely bottoming in permits.
The South was the only region with a year-over-year decline in starts (thus increasing my worries about the region!). The Northeast and the Midwest each surged large double digits. The Northeast, Midwest, South, and West each changed +52.7%, +33.3%, -6.3%, and +10.7% respectively year-over-year.
New Residential Sales (Single-Family) – August, 2024
July’s new home sales were revised higher to a new high of the year of 751,000; this level also surpassed the 2023 high and was last matched in February, 2022 (the month before the Fed started hiking interest rates). August sales fell 4.7% from July to 716,000, a 9.8% year-over-year increase. July’s jump in sales may have helped motivate the recovery in August starts. Moreover, an uptrend from the 2022 and 2023 lows continues…even as sales in existing homes languish.
![US. Bureau of the Census, New One Family Houses Sold: United States [HSN1F], first retrieved from FRED, Federal Reserve Bank of St. Louis, September 29, 2024.](https://drduru.com/onetwentytwo/wp-content/uploads/2024/09/20240929_New-home-sales-August-2024.png "new home sales")
The median price drifted to $420,600, right in the middle of the year’s range and a 4.6% year-over-year decline. The year-over-year changes are declining again. This news is good for prospective buyers.
July new home sales shifted sharply to the $500,000 to $599,999 price range relative to June. In August, they shifted sharply downward and returned to June’s distribution. There no longer seem to be any particular trends in the distribution of sales across the price ranges despite what I have assumed is an on-going scramble for affordable homes.
August’s inventory jumped to 7.8 from 7.3 (revised down) months of sales. For comparison, a year ago inventory sat at 7.9 months of sales. Absolute inventory has remained flat for most of the year, but it is just below the peak from 2022. I expect a breakout to the upside will accompany lower prices…and a peaking in the shares of home builders.
Regional sales in August returned to a wide range. The Northeast, Midwest, South, and the West changed -33.3%, +26.6%, +18.0%, and -6.7% respectively.
Existing Home Sales – August, 2024
Existing home sales are right back to a close call with last year’s low. Almost everything about the data for existing home sales screams of an on-going, persistent slowdown. Declining mortgage rates and increasing inventory have failed to arrest the overall downtrend in sales from the peak in February, 2024. The National Association of Realtors remains hopeful contrary to the trends: “Home sales were disappointing again in August, but the recent development of lower mortgage rates coupled with increasing inventory is a powerful combination that will provide the environment for sales to move higher in future months.”
The seasonally adjusted annualized sales in August of 3.86M declined 2.5% from July’s 3.96M (revised slightly upward). A 4-month slide in existing home sales resumed in August.

(For historical data from 1999 to 2014, click here. For historical data from 2014 to 2018, click here) Source for chart: National Association of Realtors, Existing Home Sales© [EXHOSLUSM495S], retrieved from FRED, Federal Reserve Bank of St. Louis, September 30, 2024

August’s absolute inventory of 1.35M homes was up 1.5% month-over-month and up 22.7% year-over-year. According to the NAR, “Unsold inventory sits at a 4.2-month supply at the current sales pace, up from 4.1 months in July and 3.3 months in August 2023.” Note again that the surge in inventory from last year’s levels did not produce a boost in sales as NAR expected. This on-going divergence is another sign of a slowing market amid rising prices.
The median sales price of an existing home fell 1.1% from $421,400 to $416,700. The market set an all-time high two months ago at $426,900. An increase of 3.1% year-over-year created the 14th straight year-over-year gain. This on-going uptrend in price weighs on the market for existing homes.
The average time on market for an existing home increased to 26 days, up from 24 days in June but significantly down from the 38 days in February. The average time was 20 days a year ago.
The share of sales to first-time home buyers dropped to 26% from July’s 29% and 29% a year ago. I was surprised that the share of first-time home buyers remained so resilient despite the pricing pressures and limited inventories. Now the share is at the all-time low set in November, 2021. The NAR’s 2017 Profile of Home Buyers and Sellers reported an average of 34% for 2017, 33% for 2018, 33% for 2019, 31% for 2020, 34% for 2021, 26% for 2022, and 32% for 2023.
The South continues to be a region of notable weakness. It was one of two regions to experience a decline in year-over-year sales in July. Three regions declined year-over-year in August. The South was the weakest region in June and in August. The regional year-over-year changes were: Northeast 0%, Midwest -5.2%, South -6.0%, West -1.4%.
As usual, every region experienced a year-over-year price increase. The regional year-over-year price changes were yet again substantial for the Northeast. The South is notable for its weakening price trends: Northeast +7.7%, Midwest +3.8%, South +1.6%, West +2.2%.
Single-family existing home sales decreased 2.8% from July and declined on a yearly basis by 3.3%. The median price of $422,100 was up 2.9% year-over-year and down 1.2% month-over-month, a second decline in a row after 5 straight months of sequential increases.
California Existing Home Sales – August, 2024
The California Association of Realtors (C.A.R.) pointed to a wait-and-see attitude with buyers as a driver of poor existing home sales in California: “closed home sales pulled back in August as buyers evaluated whether to wait for the Federal Reserve to cut rates before entering the market.” This explanation is plausible but is not consistent with the upward movement in new home sales (which perhaps are a little less reliant on mortgage financing). At least recent data from Redfin suggests that buyers did increase their activity after the Fed rate cut.
According to the latest report from the California Association of Realtors (C.A.R.), existing single-family home sales totaled 262,050 in August, marking a 6.3% decrease from July and a 2.8% year-over-year increase.
The $1M price threshold marks a definitive dividing line for the market narrative in California. According to CAR, “While the sales pace for the $1 million-and-higher price segment decelerated in August to 3.6 percent, sales in the sub-$500,000 market had a lackluster performance as well, dropping 9.0 percent below the year-ago level.” Despite the sale slides in both segments, aggregate pricing still went up. The median home price in August increased 0.2% to $888,740 and increased year-over-year by 3.4% to $859,670. The year-over-year price change increased a fourteenth consecutive month.
The median time it took to sell a home in California increased to 22 days from 20 days in July and 17.5 days a year ago.
The statewide sales-price-to-list-price ratio was 100.0% for the seventh month in a row, also unchanged from 100.0% in August 2023. The price per square foot for an existing single-family home in California was $427 in August, a 2.6% increase from a year ago.
New active listings increased for the 8th straight month, and the Unsold Inventory Index (UII) increased as well. The UII increased from 2.9 months in July to 3.2 months in June and 2.4 months a year ago. Active listings increased 39.0% year-over year (for the second month in a row), a seventh straight month of year-over-year gains.

Home closing thoughts
A Slight Slump in First-Timer Share of New Home Sales
Most publicly traded home builders have touted their interest in building affordable homes, especially for first-time home buyers. Unfortunately, according to the NAHB, the share of new home sales going to 1st-time home buyers has slightly declined since a peak in 2021 and 2022. The share has dropped from 43% to 42% in 2023 and 40% this year. Larger builders tend to sell a higher share of homes to first-time home buyers: “…builders with 1 to 5 single-family starts a year reported that only about 18% of their sales so far in 2024 have gone to first-time buyers. That average increases to 21% among builders with 6 to 24 starts, to 34% among those with 25 to 99 starts, and reaches 44% among builders who start at least 100 homes a year.”
Larger builders have greater scale and more financial flexibility for accommodating the lower price points needed by first-time home buyers.
The Vice Presidential Debate on Housing
Housing policy has been prominent in the 2024 presidential race. Housing policy was a core issue in the Vice Presidential debate on October 1st. I used ChatGPT to create a tidy summary of the positions of the two competitors. I used the transcript from the NBC News stream to ask ChatGPT “Summarize what the two VP candidates said about housing in America. Clearly state what each man thinks are the problems and the solutions.” I purposely did not ask for or want to include accusations from one camp about the other camp.
From ChatGPT….
In the debate, both vice presidential candidates highlighted housing issues in America, focusing on the root causes and potential solutions.
Governor Tim Walls (Democratic):
Problems Identified:
- Lack of affordable housing, exacerbated by speculation in housing markets, where houses are treated as commodities for profit.
- Rising housing costs make it difficult for families to secure stable homes, which in turn affects their economic stability and overall well-being.
Solutions Proposed:
- Building 3 million new homes: A key part of his campaign’s housing proposal, coupled with down payment assistance to help first-time homebuyers.
- Local initiatives: Citing success in Minnesota, Walls mentioned reducing rent prices by increasing housing stock and cutting red tape at the local level.
- Support for middle-class families: Walls emphasized programs that support the middle class, such as providing tax credits and making housing affordable.
Senator JD Vance (Republican):
Problems Identified:
- High housing prices driven in part by illegal immigration, which increases demand for housing.
- Regulations and government intervention that prevent efficient housing development.
Solutions Proposed:
- Seizing Federal lands: Using unused federal lands to build homes and increase housing supply.
- Reducing regulations: Vance argued for cutting regulatory red tape, which he believes increases construction costs.
- Addressing immigration: He argued that reducing illegal immigration would lower competition for housing, thus helping to stabilize or lower prices.
Each candidate took a different stance on the causes of the housing crisis, with Walls focusing on government intervention and investment, while Vance emphasized deregulation and immigration control.
Spotlight on Rent Control
Californians are being asked for a third time in 6 years to vote on a proposition to change California’s state restrictions on rent control. KQED’s Bay Curious provided an analysis of the proposition including a compare and contrast of the yes and no camps. Incredibly, a total of $105M has been raised and/or spent so far on the collective campaigning efforts.
Here is Bay Curious’s overall summary of the proposition: “It aims to give local governments more power to regulate rents. They do this via rent control laws. So these are policies that cap annual rent increases. At the moment, there’s a state law that sets some parameters on how far rent control Laws can go in California. But if Prop 33 passes, those limits would be removed.”
The analysis included a fascinating history of rent control efforts in California, including the claim that California’s proposition 13 was supposed to lower property tax bills which in turn would generate savings for renters. After the trickle-down economics failed, activists turned to rent control to address affordability issues which in turn generated a backlash that brought about the current state limits on rent control. If Californians were struggling to pay rent in the 1970s and 1980s, then rent struggle is a stubbornly persistent Californian theme!
The analysis concludes by looking at what various economists say about rent control. Apparently, there is a small minority of economists who claim they have empirical evidence that rent control does not generate the harms conventional economics predicts. The National Multi-Family Housing Council produced a detailed “fact check” breakdown of the letter these economists sent to the Federal Housing Finance Agency in “Fact Check: 32 Economists Distort the Record on Rent Regulations.” In the Bay Curious piece one of the signatories claimed that potential harms from rent control could be regulated (or legislated away). A complex and restrictive regulatory framework is already a huge issue in California that has helped to twist and distort so many markets into their current unaffordable conditions. I strongly suspect less would be more in California (with an emphasis on promoting greater supply, especially in denser, well-supported developments).
America will clearly deal with the affordability crisis for quite some time because the simple solution of increasing the housing supply to bring prices down will work too slowly for a myriad of structural, legal, environmental, and social issues.
ROAD to Housing Act
As further evidence of the increasing spotlight on housing in legislative efforts, a bill called the ROAD to Housing Act is making its way through Congress. The Mortgage Bankers Association (MBA) had this to say about the proposal:
“We are particularly pleased by the introduction of Senator Scott’s comprehensive bill that contains provisions MBA believes will help to make housing more affordable and available. This includes enhanced housing counseling and financial literacy measures as well as beneficial reforms designed to increase manufactured housing construction, small-dollar mortgage lending, construction grants, building or preservation of housing in Opportunity Zones, and to promote regular, sustainable dialogue between federal agencies and Congress.”
The acronym ROAD stands for “Renewing Opportunity in the American Dream”.
BPC Action included the following commentary in its 2023 statement on the proposal:
“Sen. Scott’s framework aligns with several key, bipartisan priorities articulated in the American Housing Act, a legislative package developed by BPC and BPC Action to improve housing affordability. It similarly calls for a focus on competition and innovation in the housing sector, investments in solutions that deconcentrate poverty and help families be self-sufficient, and the removal of restrictive regulatory burdens that limit the production and preservation of more affordable housing.”
BPC Action describes itself as “committed to seeing bipartisan policy solutions enacted into law, and we work closely with our 501(c)(3) partner, the Bipartisan Policy Center, to advance smart policies through the legislative process.”
Spotlight on Mortgage Rates
The Mortgage Bankers Association (MBA) reported four weekly increases in mortgage applications in September. Coming after an August where mortgage applications increased 3 of 4 weeks is a hopeful sign that housing data for September and beyond will show a rebound in sales. In July, new home mortgage purchase applications soared 9.5% year-over-year and increased 4.5% in August. The year-over-year increase was the 19th consecutive month of such gains.
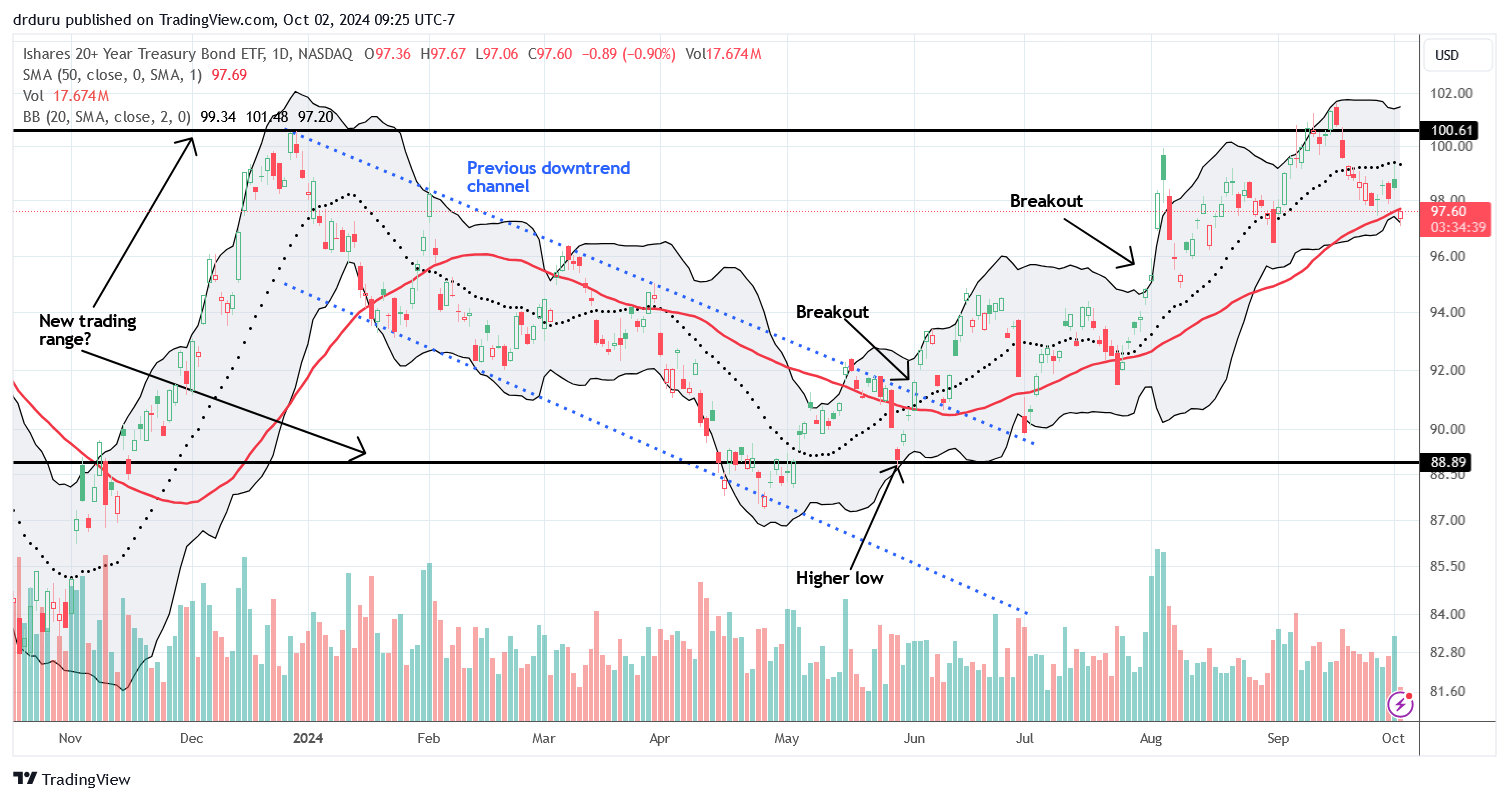
Mortgage rates continued a steep descent off the May peak. These rates are now back to the 2023 low set in January. The descent may come to an end soon as long-term interest rates have been increasing as seen in the recent decline in TLT since the Fed rate cut. With Fed Chair Jerome Powell signalling a desire to go slow on further rate cuts, the housing market may take a while to benefit from lower mortgage rates as some buyers continue to wait out the rate easing cycle.
![Freddie Mac, 30-Year Fixed Rate Mortgage Average in the United States [MORTGAGE30US], retrieved from FRED, Federal Reserve Bank of St. Louis; September 30, 2024.](https://drduru.com/onetwentytwo/wp-content/uploads/2024/09/20240930_30-Year-Fixed-Rate-Mortgage-Average-in-the-United-States.png)
Be careful out there!
Full disclosure: long ITB shares