Stock Market Commentary
Last week started with a calamity and ended with a restless calm. Critical trendlines held as support as buyers and bulls ground their way to a near full reversal of Monday’s loss. Ironically, the market even found relief in a “better than expected” weekly unemployment claims report. Claims fell 17,000 from the previous week to 233,000, below the projected 240,000. Each change is small, but they loom large for a market on edge. Every data point takes on exaggerated importance. Good economic news is suddenly good when sentiment sees a recession as a drag on corporate performance instead of the harbinger of gifts and riches from rate cuts. Accordingly, bulls held firm for the week as Thursday’s reaction to the claims number delivered a a large gap higher; buying even persisted into the close.
Next up, the CPI report for July. Recall that weaker than expected inflation for June sent the market soaring with the massive rotation out of big cap tech and into small caps and rate sensitive stocks. Imagine what could happen if inflation delivers a negative surprise. The current restless calm is palpable…
The Stock Market Indices
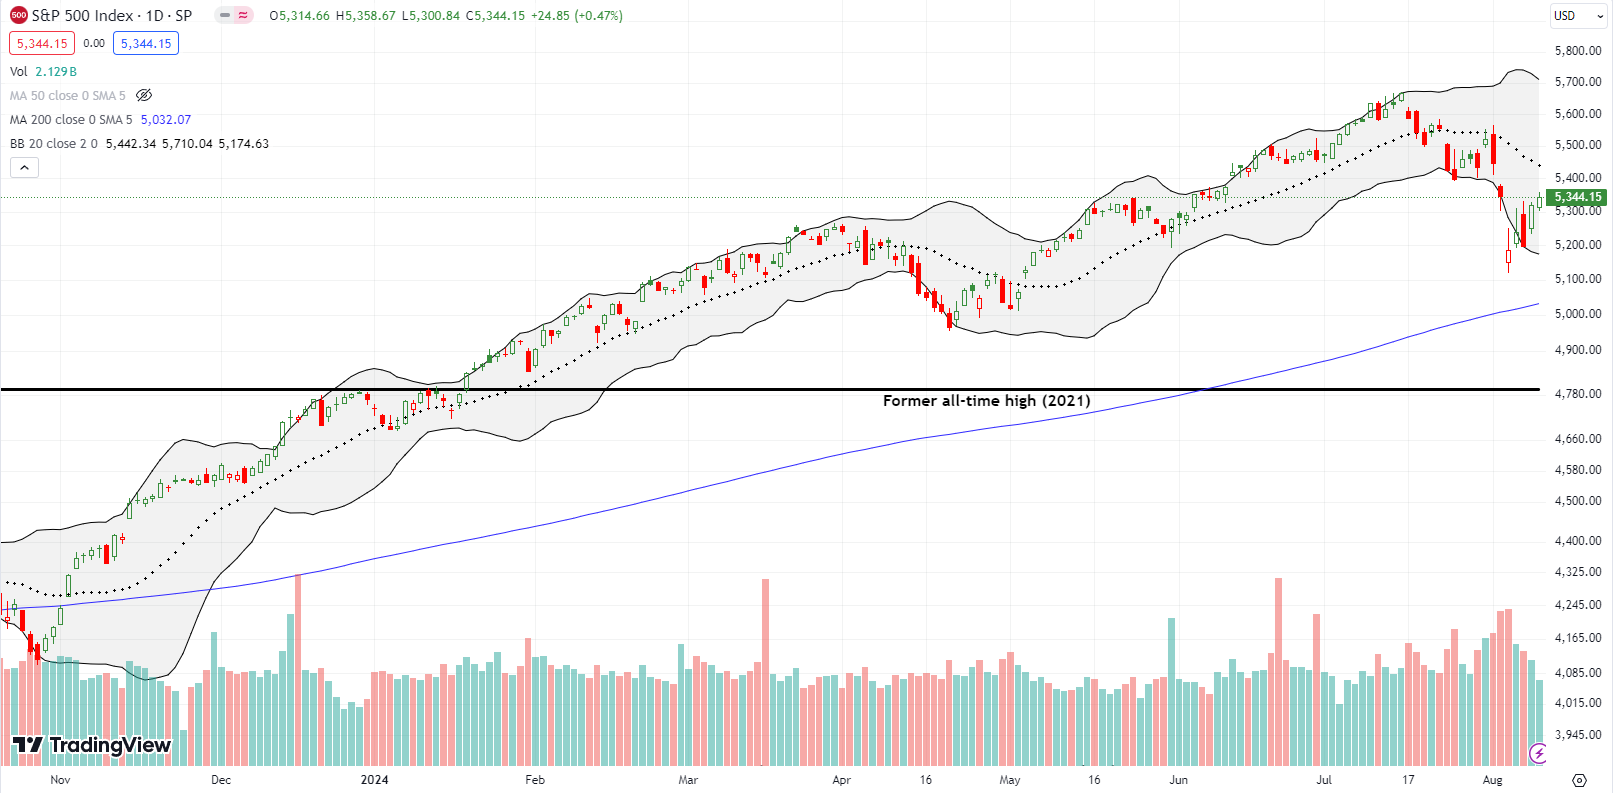
The S&P 500 (SPY) still looks like it is breaking down, but the recovery from Monday’s calamity looks impressive on paper. The index lost just 0.04% for the week as buyers and bulls tried to throw Monday’s big losses into the dustbin of distant memories. However, without a proven test of support at the 200-day moving average (DMA) (the blue line below), resistance from the downtrending 20DMA (the dashed line) looms large. I will be watching price dynamics closely around that resistance. In the meantime, I bought a fresh calendar put spread on SPY at the $520 strike in the wake of Thursday’s celebration. I go into this week riding the long side of that spread as a partial hedge on bullish trading positions.
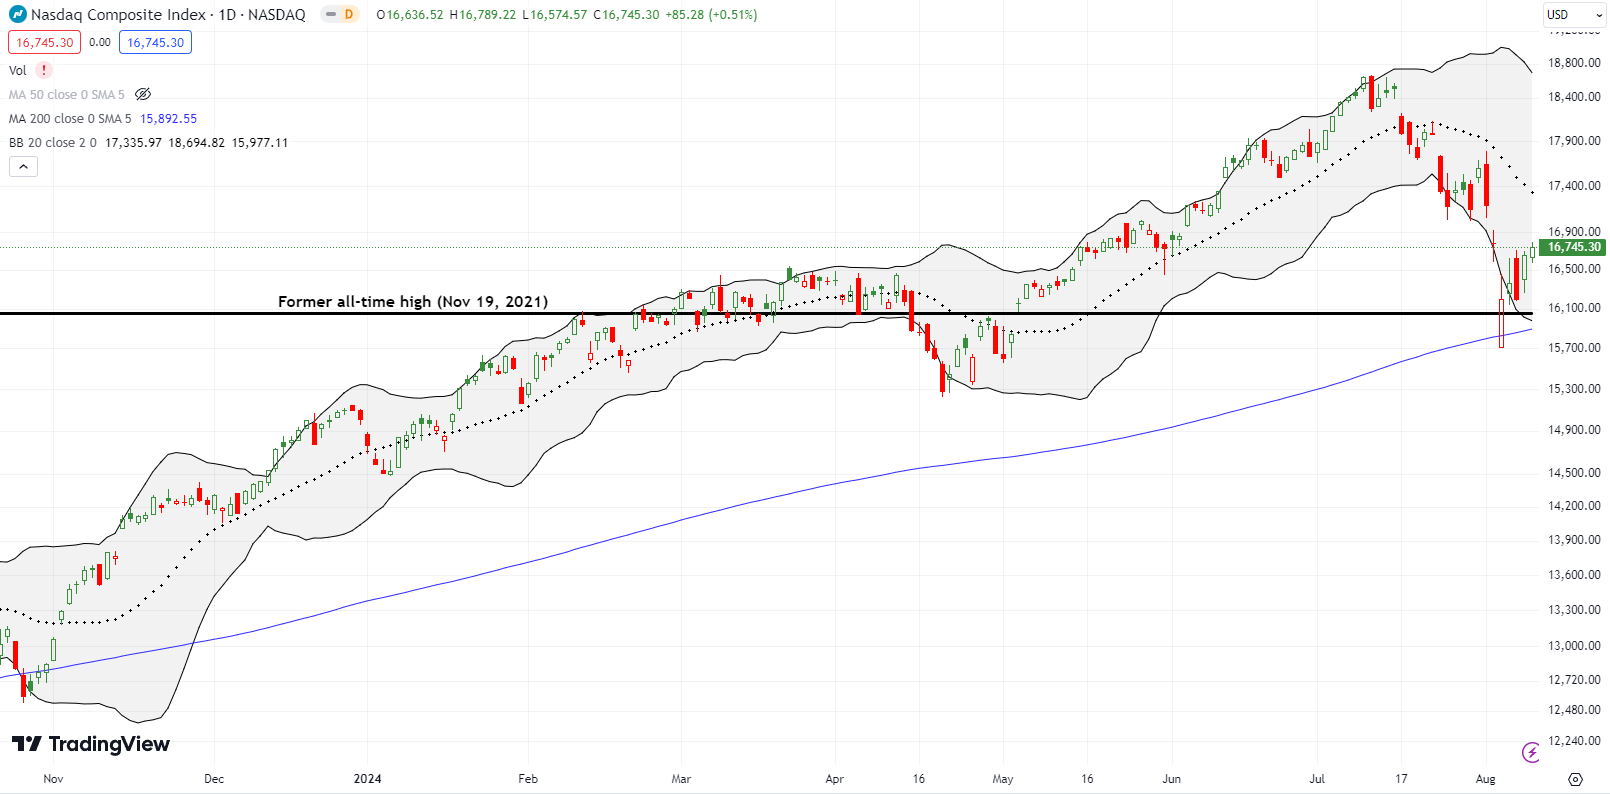
The NASDAQ (COMPQ) has suffered more damage than the S&P 500. Yet, at least the NASDAQ proved its mettle with a spirited and confirmed defense of 200DMA support. The tech laden index also recovered from losing important support at the former all-time high set November 19, 2021. That’s right – if you thought you missed the stimulus-fueled tech rally in the wake of the pandemic, almost three years later you can still buy as if that rally is just picking up again. Of course, the NASDAQ offered similar opportunities last spring.
Speaking of offering fresh opportunities, the iShares Russell 2000 ETF (IWM) is back to struggling in the middle of its 2024 trading range. With the rotation into small caps already over, investing in IWM will require fresh patience. Per my last post, I decided to accumulate IWM in the expectation that permabull Tom Lee’s prediction of a 40% rally for small caps will at least deliver on part of its potential. I am also back to regularly buying call options as plays on the trading range…bolstered by IWM confirming support at critical 200DMA support.

The Short-Term Trading Call With Calamity
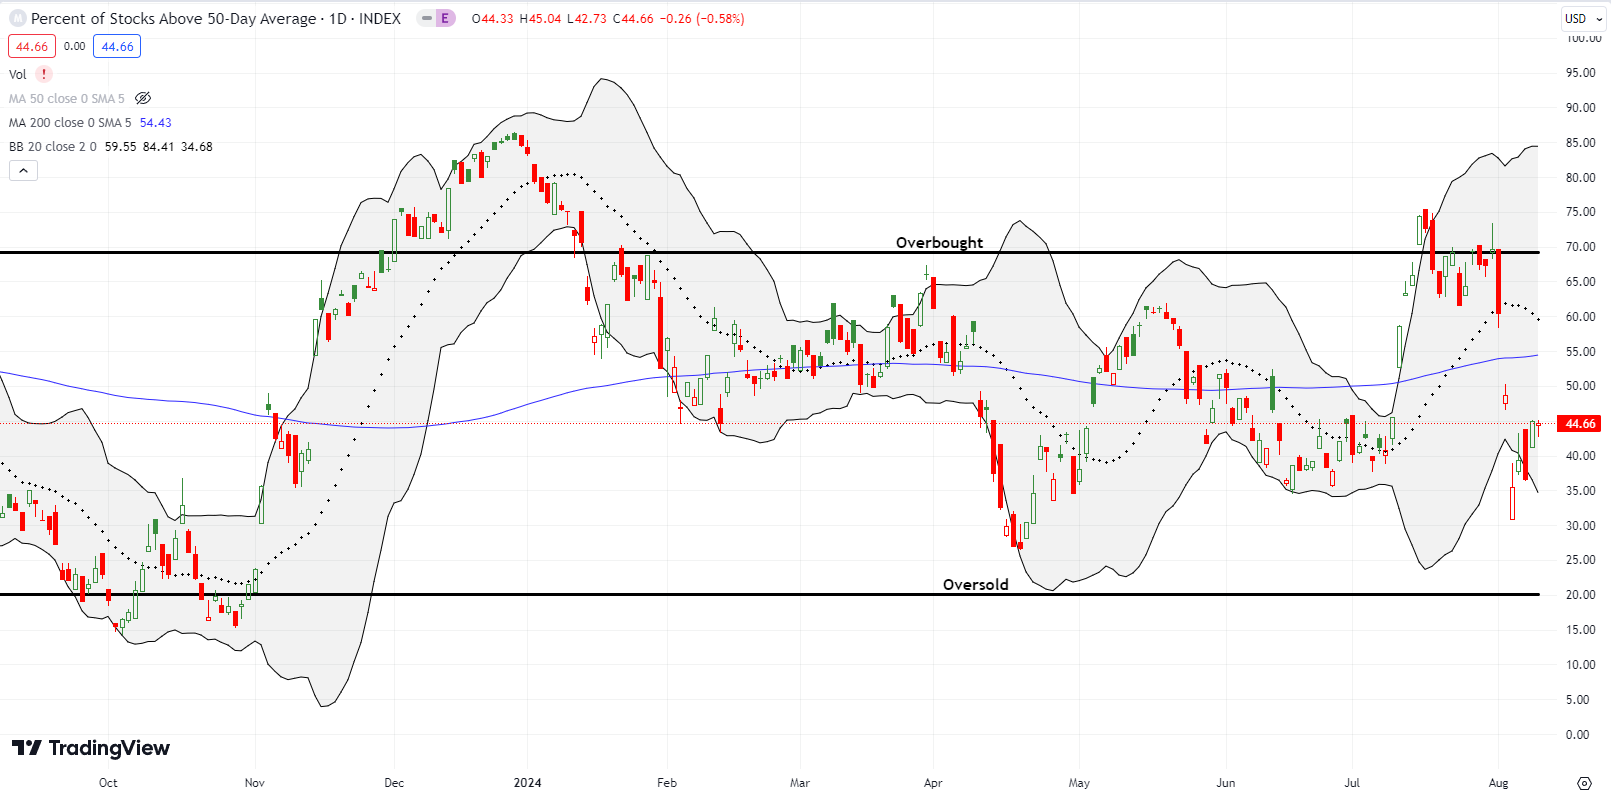
- AT50 (MMFI) = 44.7% of stocks are trading above their respective 50-day moving averages
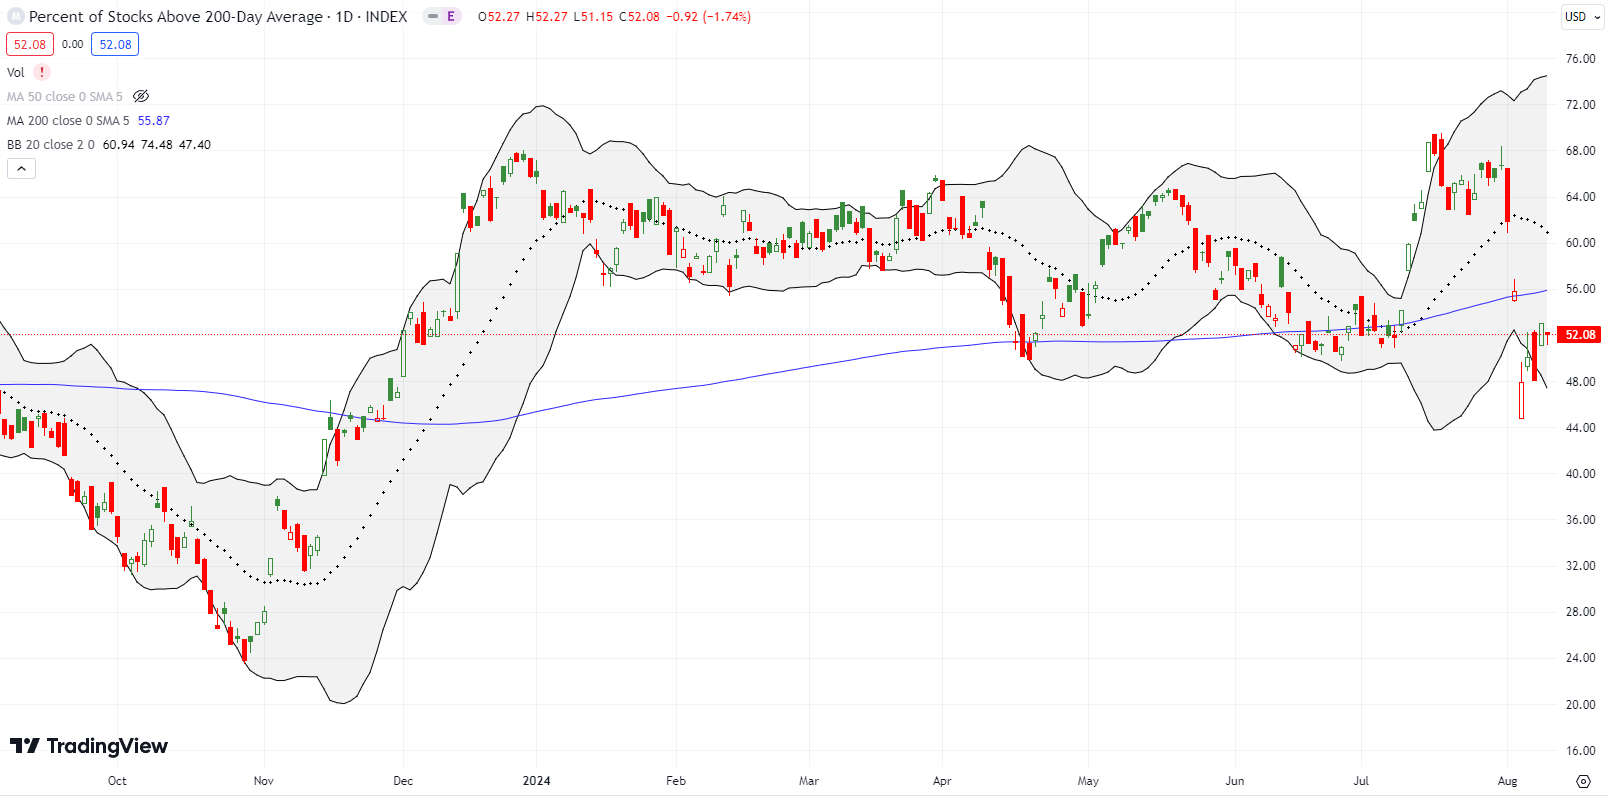
- AT200 (MMTH) = 52.1% of stocks are trading above their respective 200-day moving averages
- Short-term Trading Call: neutral
AT50 (MMFI), the percentage of stocks trading above their respective 50DMAs, rebounded with the market breadth dropping as low as 35.5% and closing the week at 44.7%. My favorite technical indicator fell 3 percentage points short of reversing all of its loss from Monday. Moreover, like the S&P 500, AT50 proved little at its lows for the week given it fell far short of testing the oversold threshold. AT50 is in a particularly odd situation given surges as extreme as the VIX’s move should have delivered oversold conditions. Instead, AT50 is sitting in a “limbo” area. In other words, there are strong cases for moving either up or down this week. A neutral short-term trading call is appropriate in this case.
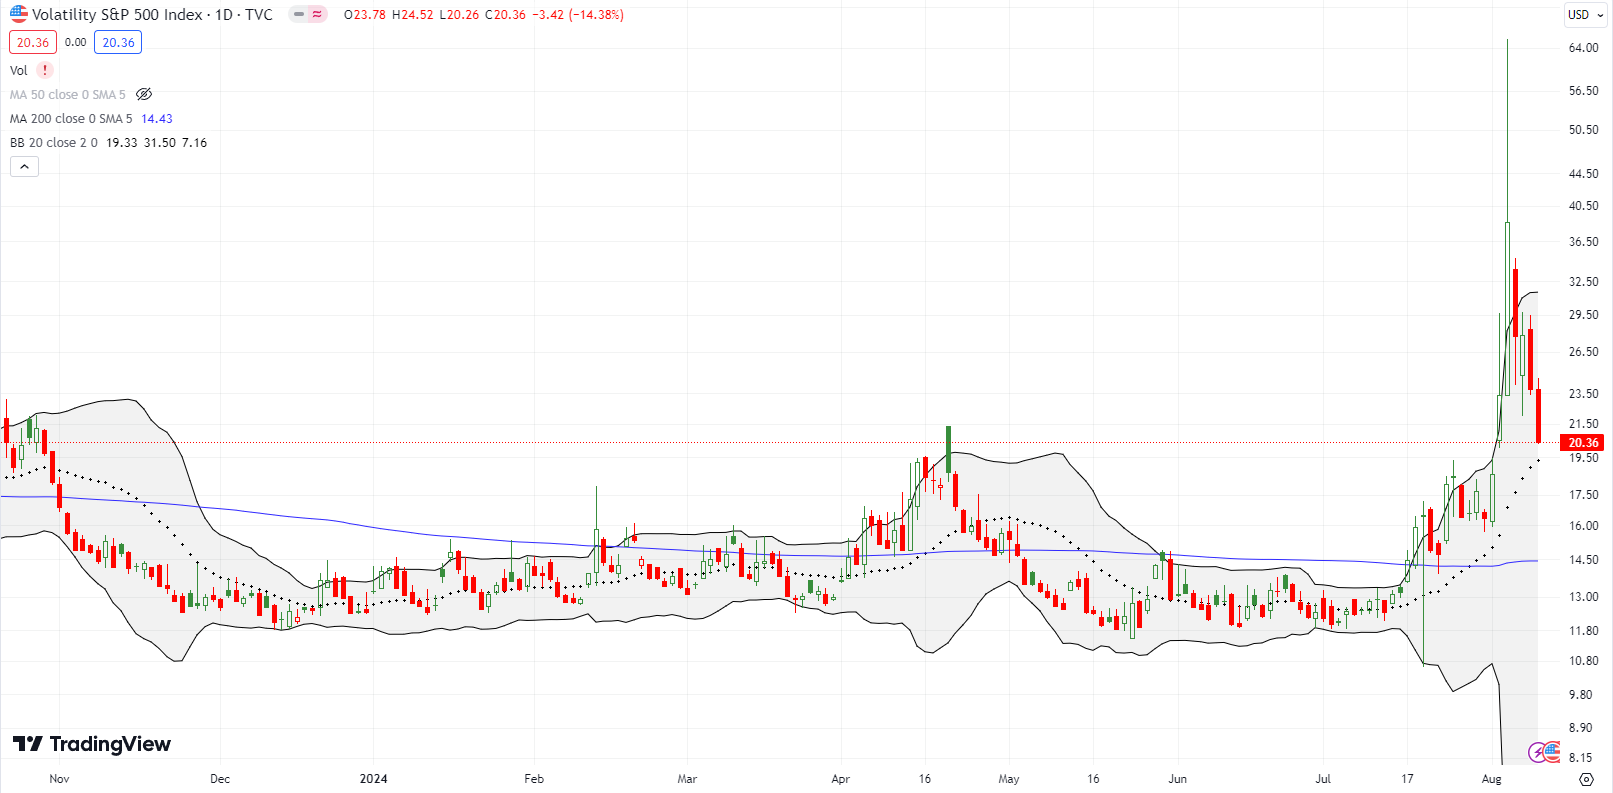
As I mentioned in my last Market Breadth post, the volatility index (VIX) traded to its third highest level ever at its intraday high on Monday. The sharp fade from there was predictable. The AT50 trading rules trigger automatic buys on VIX spikes during oversold conditions, so I had to exercise discretion to bet on a VIX reversal despite AT50 trading far above oversold conditions.
As I also mentioned in my last post, I voted with the bulls and added to my SVXY calls. However, I failed to take into account a rapid decline in implied volatility on those call options. I finally realized my error on Friday morning as calls lost value even with SVXY soaring again (I did NOT want to take my chances buying shares only to get caught in a massive liquidation/calamity event from a fresh VIX extreme).
A put option on the iPath Series B S&P 500 VIX Short-Term Futures ETN (VXX) became my trade for a VIX fade. I took profits at the close Friday and could only guess at how much money I left on the table failing to identify the more effective way to fade the VIX. In my small defense, there were no VXX options available on Monday, so I figured the market makers were well aware of the one-way direction of the trade for the week.
The VIX collapsed so thoroughly that it managed to LOSE 12.9% for the week. However, it is still above 20 and thus “elevated” according to conventional definitions. I will not be surprised if the VIX manages a bounce off the 20 level before continuing to follow the gravitational laws tugging on the VIX.
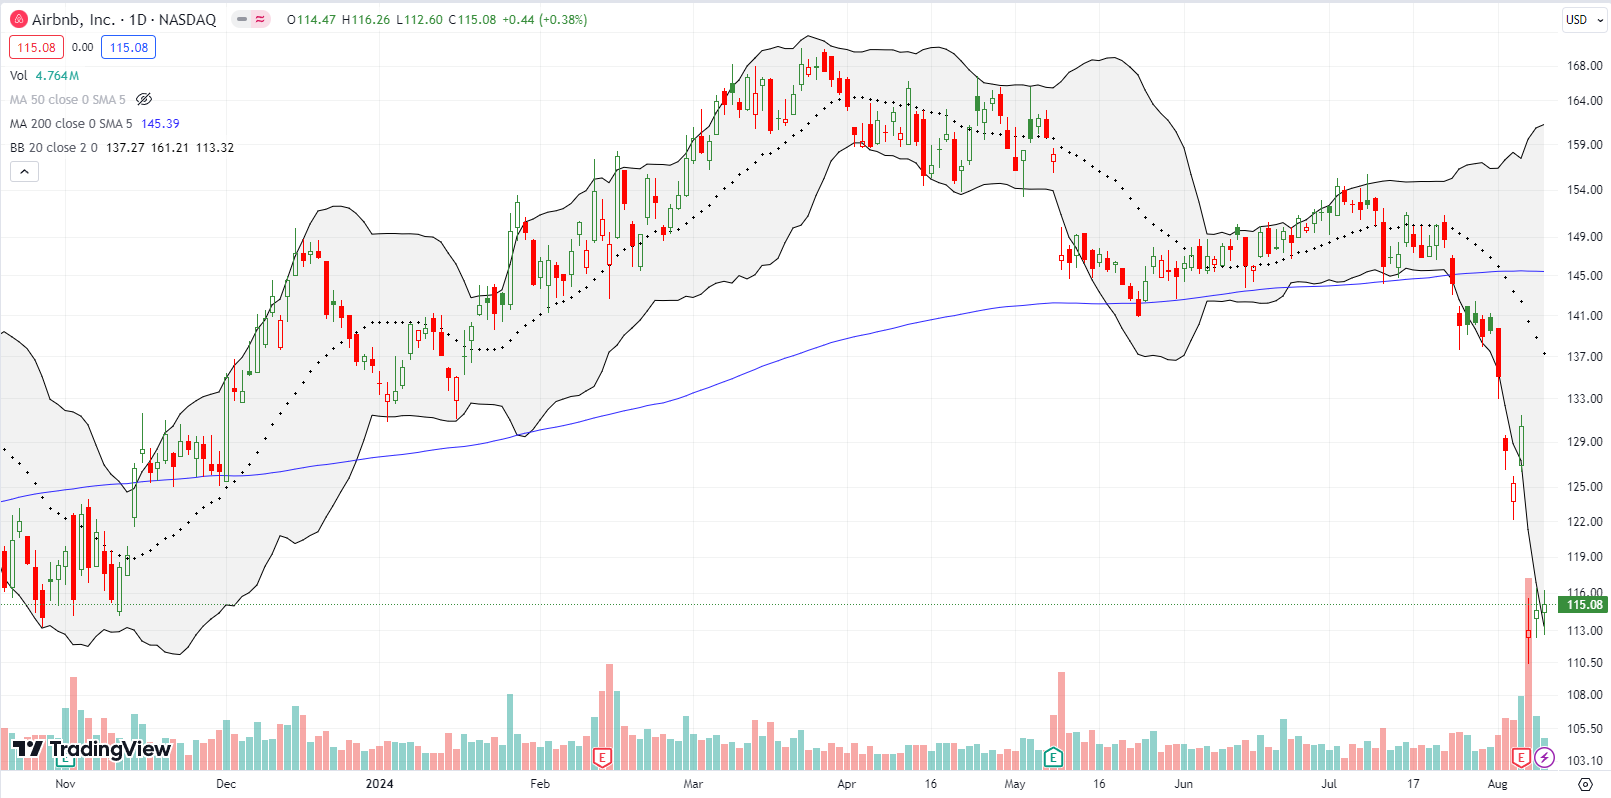
Airbnb, Inc (ABNB) returned to its October/November lows with a 13% post-earnings loss. I bought a put spread on ABNB after it confirmed its 200DMA breakdown. I meant to hold it through earnings given the pressure on many travel-related stocks. However, two big declines in the previous week meant that ABNB was one of the many bearish positions I closed out given what looked like extremes in selling at THAT time. It did not even occur to me to reload on the position when ABNB jumped 4.1% ahead of earnings. The growing stories of hidden cameras in ABNB properties sealed the deal for me on getting bearish. As “middleware” I have no idea how ABNB insures camera-free properties to quell growing concerns. Hotels have a much better shot at addressing this creepy problem.
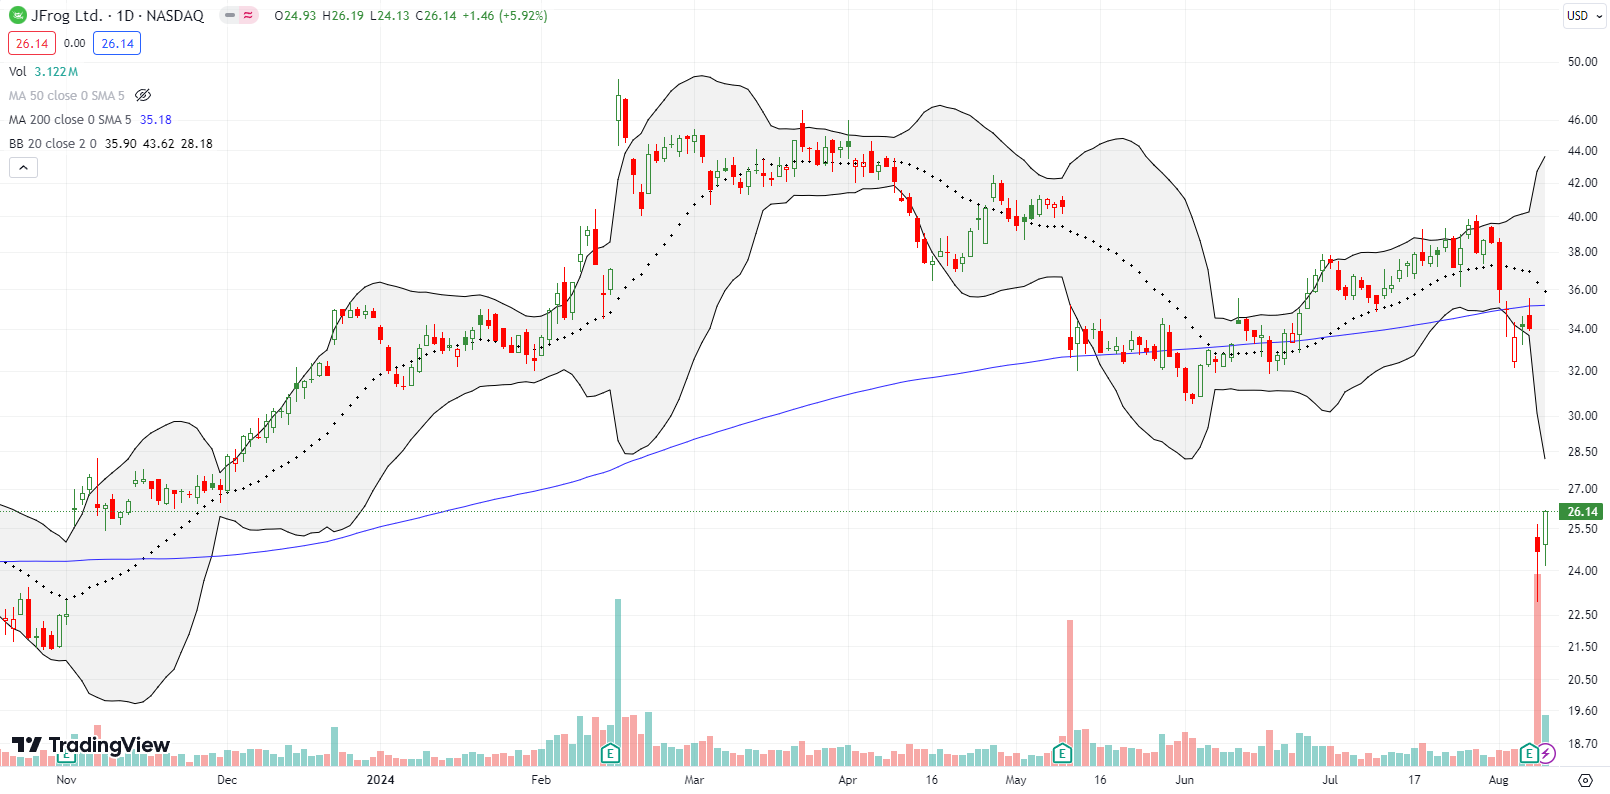
DevOps software company JFrog Ltd (FROG) collapsed 27% post-earnings despite reporting a small change in guidance. I happened to buy a strangle (calls and puts) ahead of earnings as a bet on a weakening IT-spending environment with the calls in place in case I was completely wrong. Still, I did not expect this kind of collapse. So when FROG traded above its post-earnings high, I turned around and bought some shares (I already took profits on the put). FROG almost filled the gap up from November earnings, so I think current levels provide a decent derisked price. Consistent with the theme of the market over-exaggerating the importance of small changes, FROG shaved its guidance around the edges. Per Seeking Alpha:
“JFrog expects third quarter revenue to range from $105M to $106M, with a mid-point of $105.5M, which is less than the consensus estimate of $107.9M. The company also lowered its fiscal year 2024 revenue to a mid-point of $423M, which is less than the estimate of $428.4M.”
I have my eye on FROG again given the recent disaster with Crowdstrike’s recent software update that crippled software systems around the globe. Delta Airlines reportedly lost $500M after its operations seized up, and the company is looking to sue Crowdstrike and Microsoft (MSFT) for damages. Impacted Delta passengers are also filing a class-action lawsuit. JFrog provides software that helps company with software deployments.
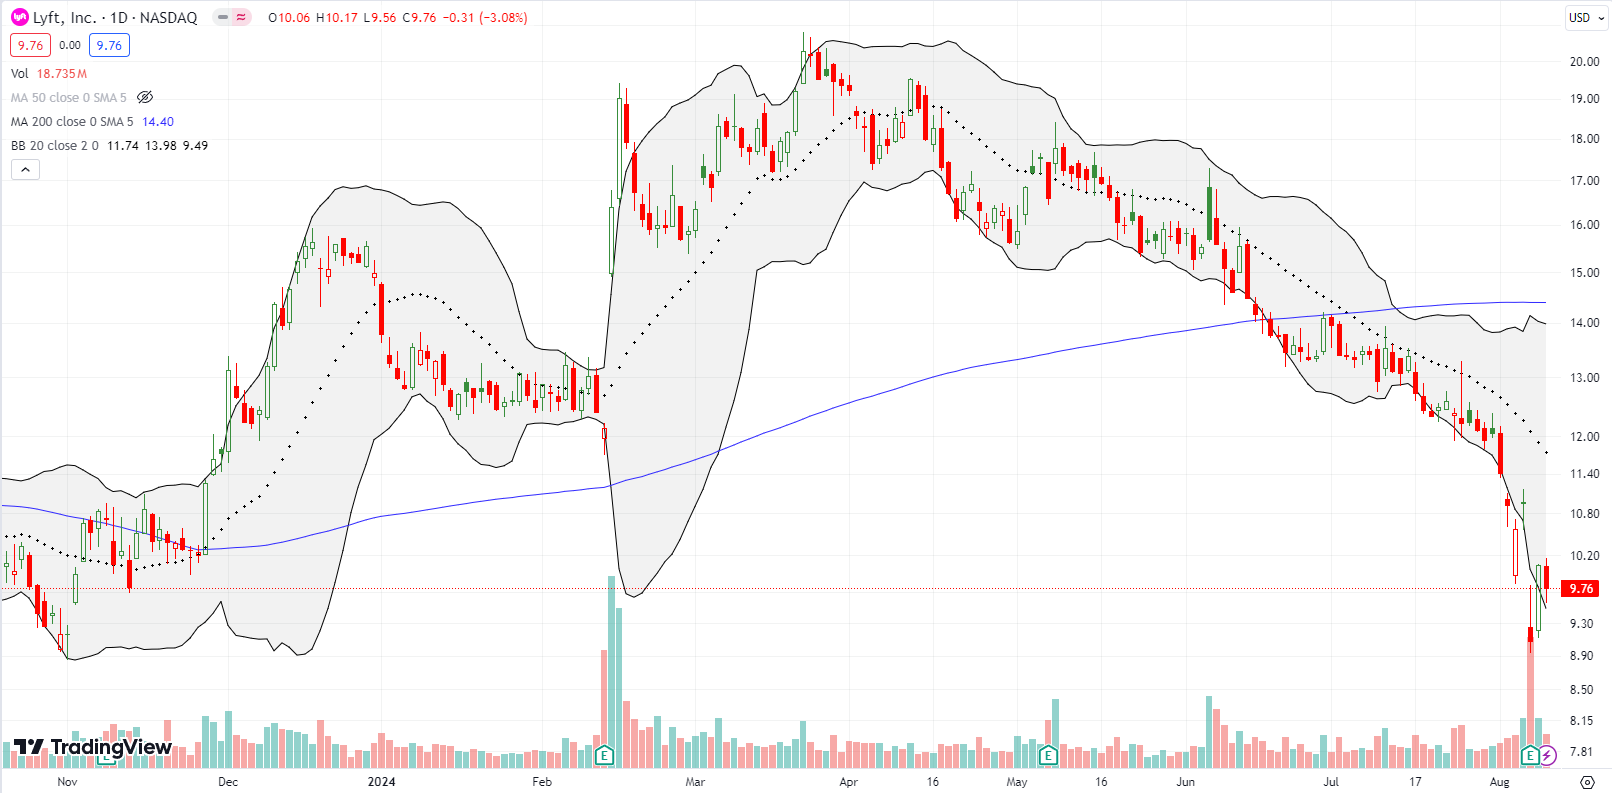
The excitement over a rebound in rideshare company Lyft Inc (LYFT) is long gone. In February, LYFT soared 35.1% post-earnings and jumped another 16.1% the next day. The stock faded most of the incremental gains and slumped into May earnings. After a 7.1% post-earnings gain, LYFT resumed an extended slide. The selling persisted right into earnings last week, and LYFT lost 17.2% post-earnings. A subsequent rebound lifted the stock off its 9-month low, but I am skeptical.
The journey for LYFT is one of those moments that makes me question the market’s ability to understand the fundamentals of a company. What so dramatically changed for LYFT from the euphoria in February to the subsequent waning enthusiasm and then despair last week? Relatively large short interest of 11.8% could be distorting the price dynamics.
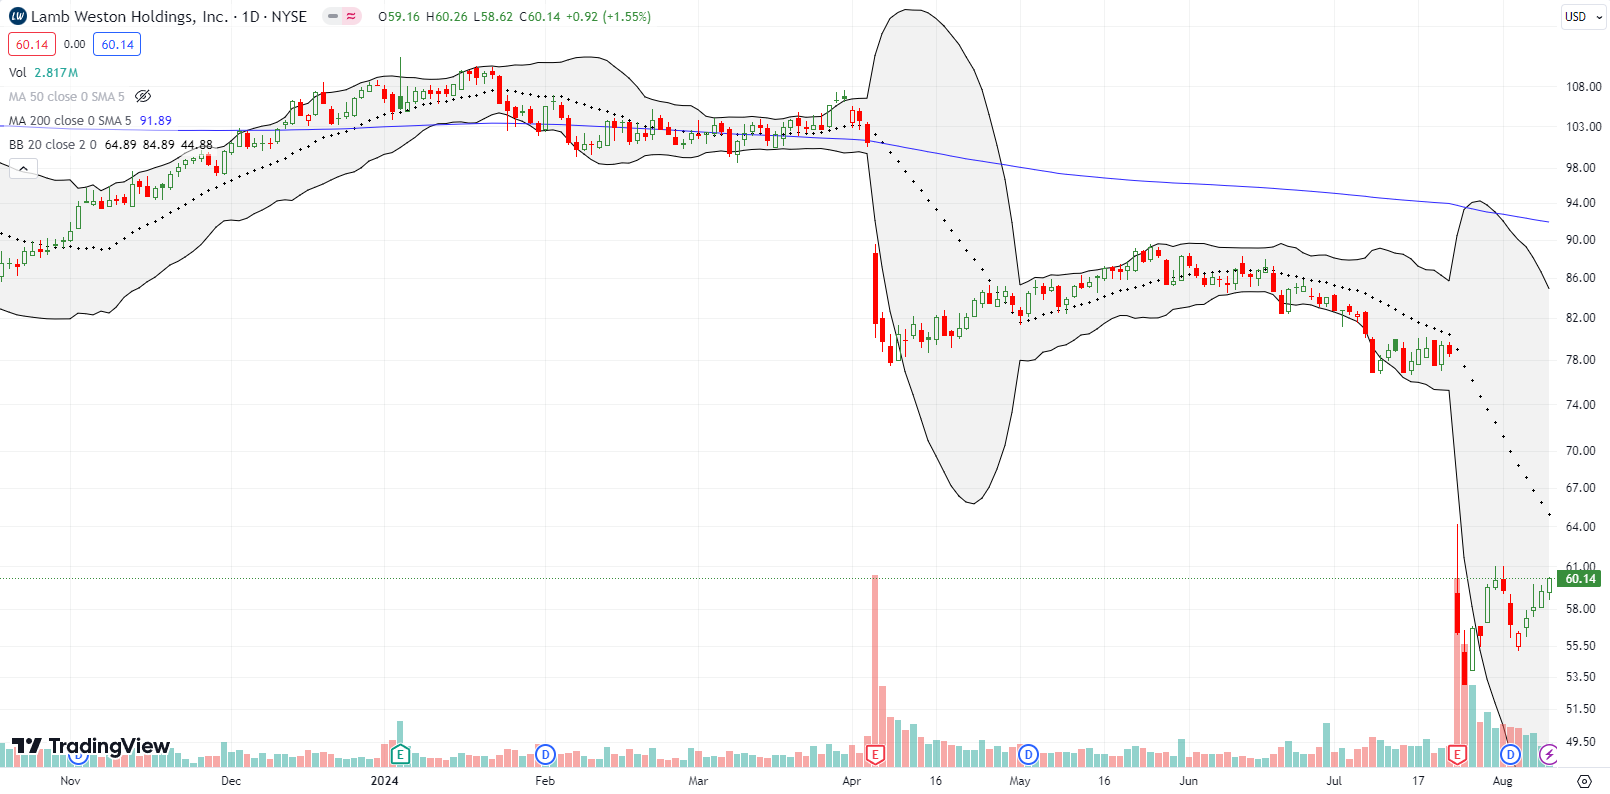
Apparently, the market for french fries continues to collapse. I would never know given my son’s appetite for fries. Maker of frozen potato products Lamb Weston Holdings, Inc. (LW) collapsed post-earnings for the second consecutive quarter. April’s 19.4% plunge was followed by July’s even worse 29.2% post-earnings plunge. After trading down to a 2 1/2 year low, bargain basement shoppers are showing interest in LW. LW is one higher close away from luring me in as well. The stock has a well-established history of “saw-toothed” trading: large drawdowns followed by extended rallies. LW was trading at current prices back in early 2018.
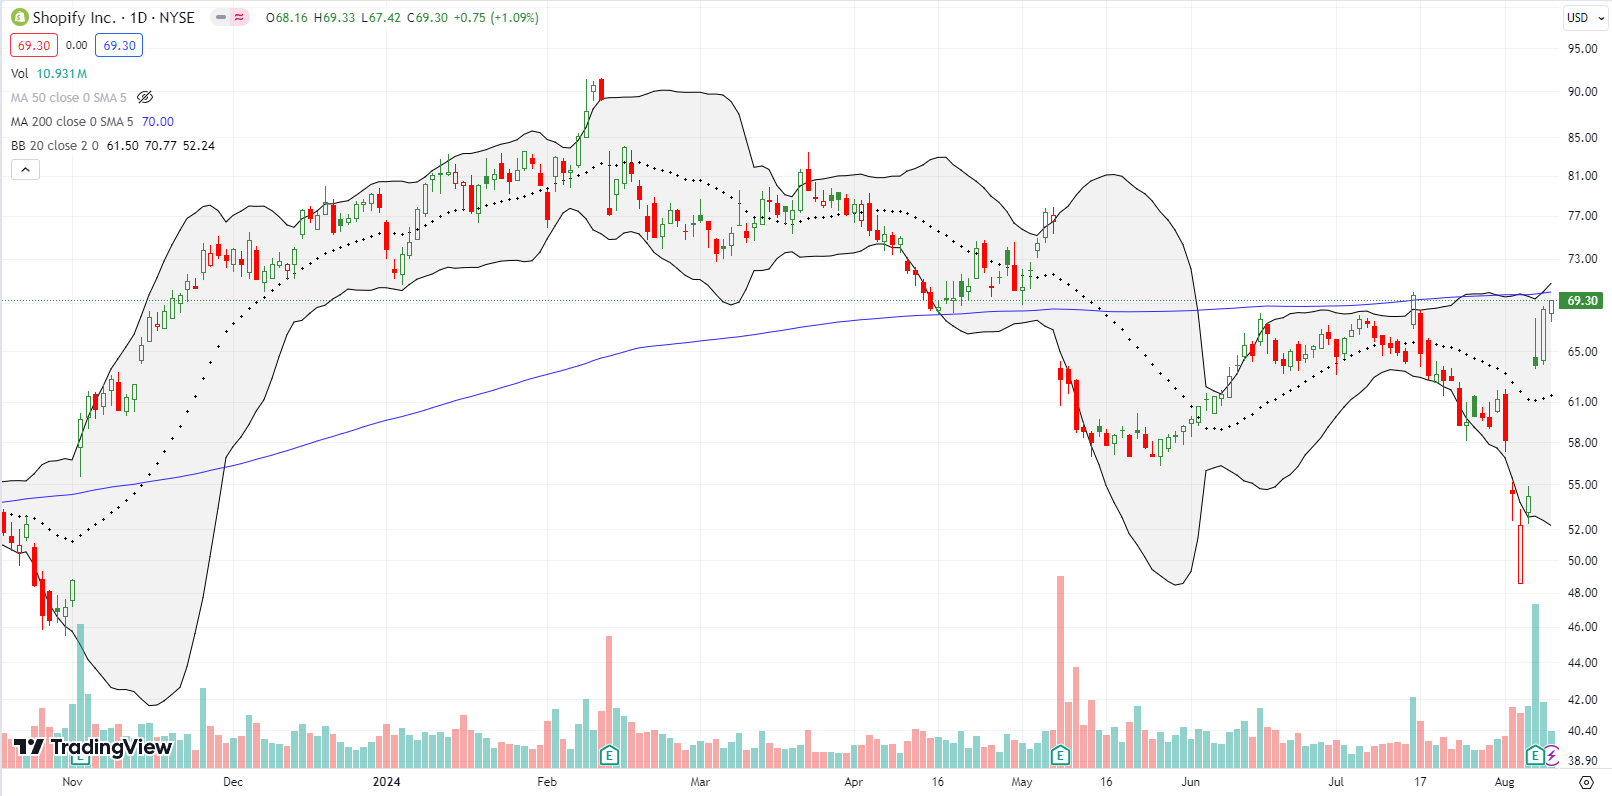
E-commerce platform Shopify, Inc (SHOP) is roughly one higher close from a 200DMA breakout. Following a 17.8% post-earnings gain, I am relatively confident in chasing SHOP higher on a breakout. Well at least I will be much more confident than chasing the 1-day (marginal) breakout on July 16 when two analysts issued positive reports on the company. I bet they are quite relieved by the sharp V-shaped recovery!
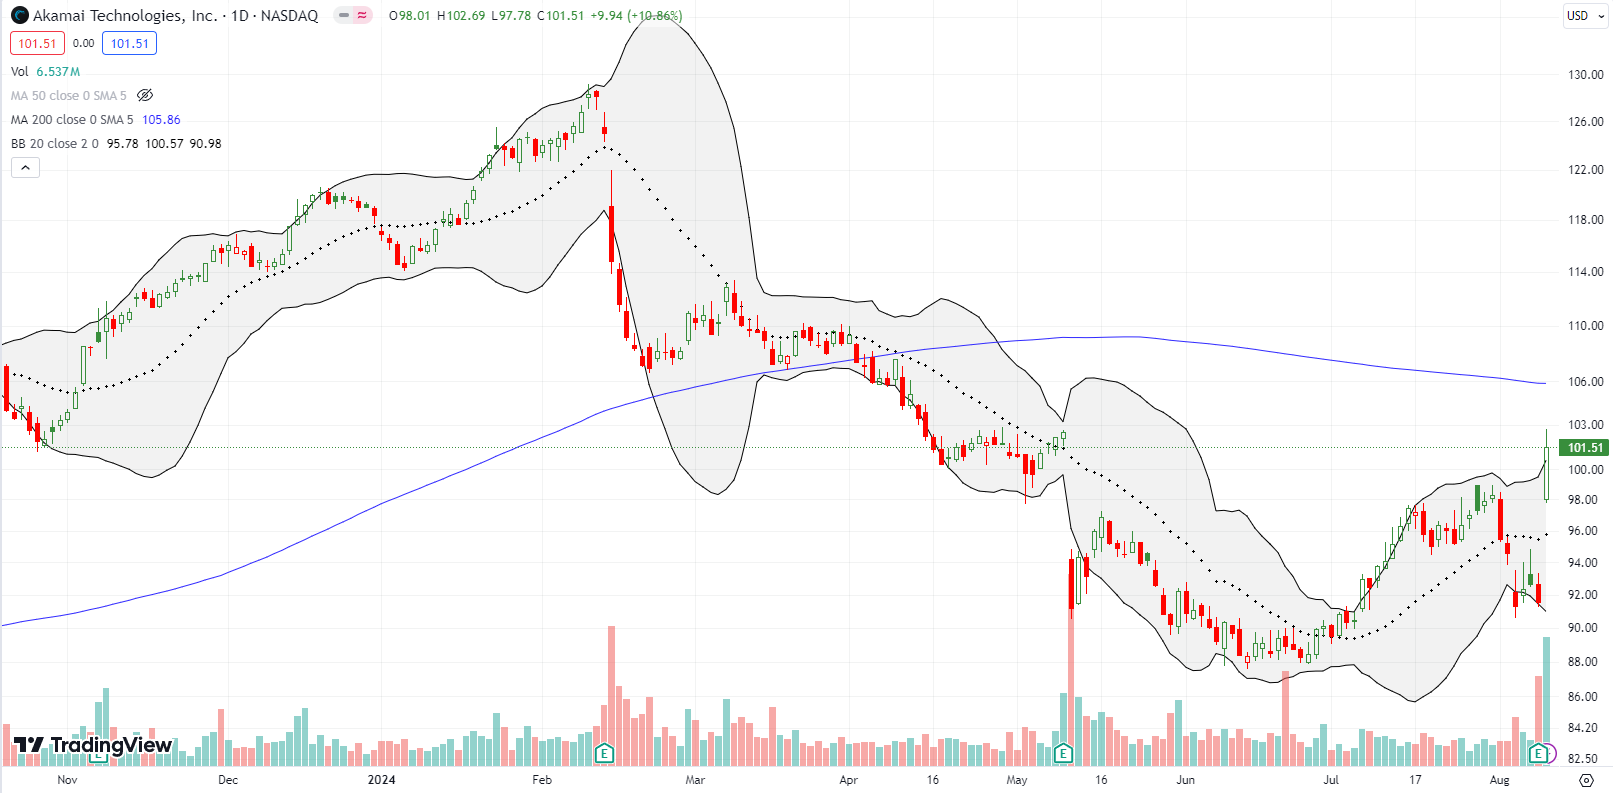
On May 15, news dropped that the CEO of Akamai Technologies, Inc (AKAM) bought $2M in shares. That show of confidence did nothing to prevent a resumption in selling in the stock. AKAM hit a 52-week low at its June lows. The current market calamity almost wiped out the entire rebound from those lows. I took interest in the earnings report, assuming that the CEO would not invest so much money if he lacked conviction in coming results.
Sure enough, AKAM surged 10.9% post-earnings and finished reversing the loss from May earnings. However, I misaligned positioning by over-protecting shares with a $90/$80 put spread that expired on Friday. So, I am net flat despite being “right”. I will keep the shares as long as AKAM holds it post-earnings low as support. I will even add to shares on a “shallow” pullback to the July highs. Resistance at the 200DMA looms ominously overhead.
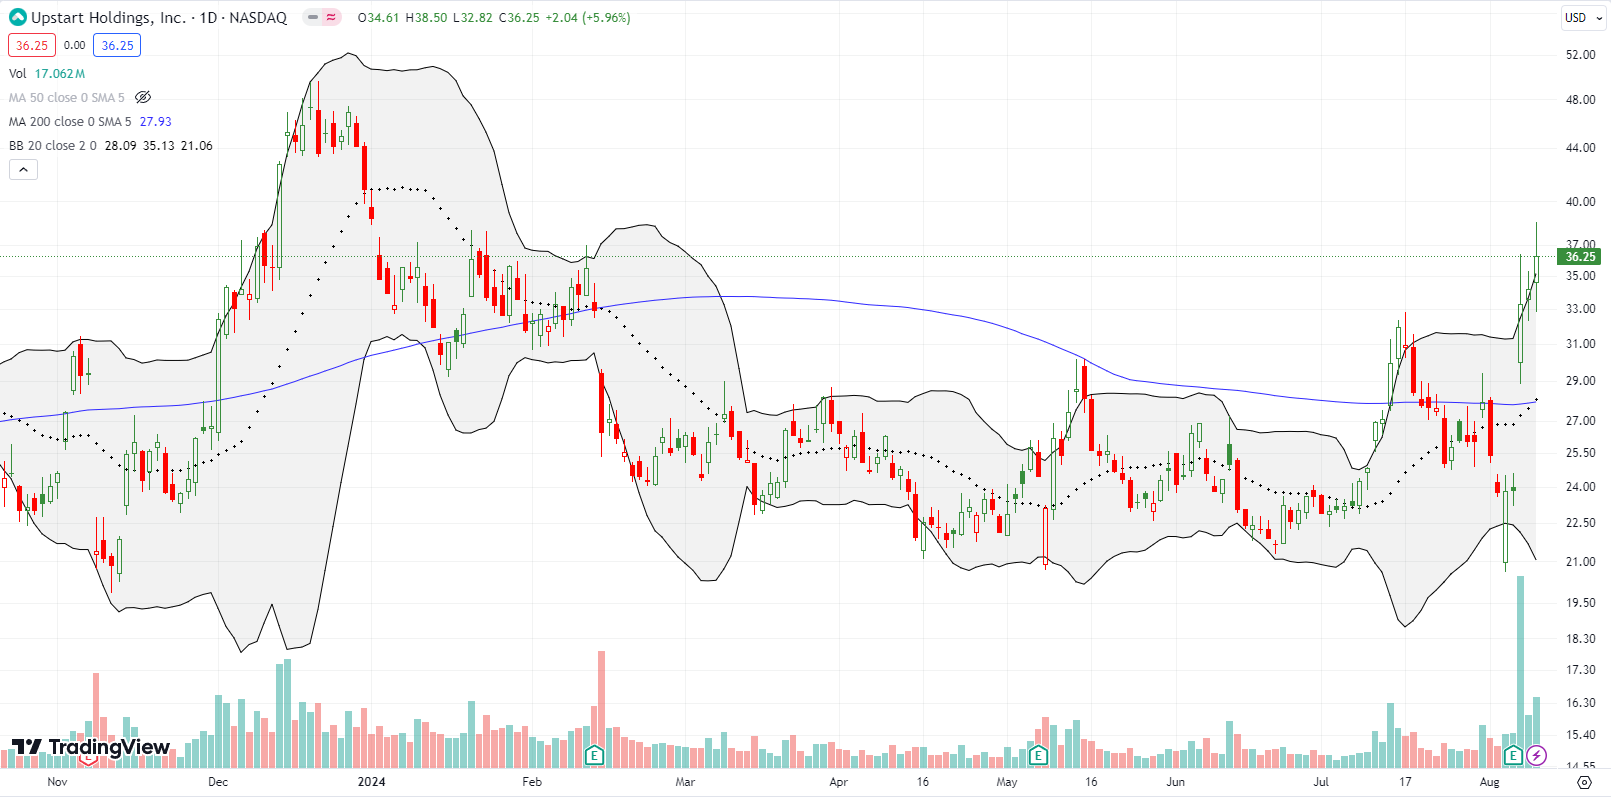
So much for recession worries? Fintech consumer lender Upstart Holdings, Inc (UPST) surged 39.5% post-earnings and continued to rally going into the end of the week. UPST finished with a confirmed 200DMA breakout and 6-month high. I bought a strangle after the gain got to 36%. So far, I have not benefited from the continued rally given the on-going decline in implied volatility. Short interest is a whopping 27.4%.
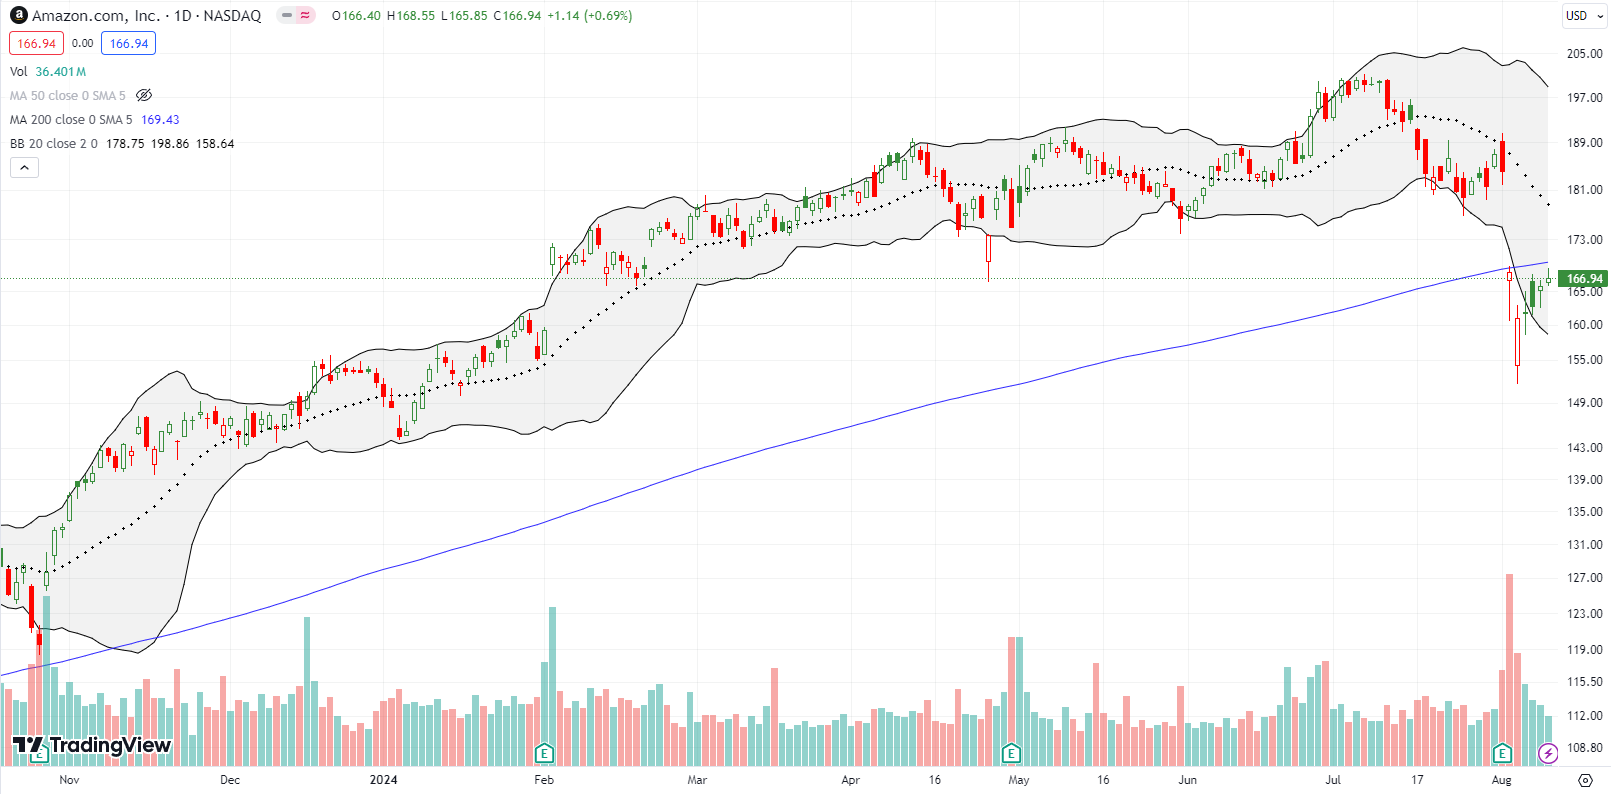
My Amazon.com (AMZN) post-earnings trade is now a week old with one week to go. Things look tenuous with the stock’s rebound slowing on the approach to 200DMA resistance. I go into the week with the long side of a calendar call spread at the $172.5 strike.
Be careful out there!
Footnotes
Subscribe for free to get email notifications of future posts!
“Above the 50” (AT50) uses the percentage of stocks trading above their respective 50-day moving averages (DMAs) to measure breadth in the stock market. Breadth defines the distribution of participation in a rally or sell-off. As a result, AT50 identifies extremes in market sentiment that are likely to reverse. Above the 50 is my alternative name for “MMFI” which is a symbol TradingView.com and other chart vendors use for this breadth indicator. Learn more about AT50 on my Market Breadth Resource Page. AT200, or MMTH, measures the percentage of stocks trading above their respective 200DMAs.
Active AT50 (MMFI) periods: Day #179 over 20%, Day #78 over 30%, Day #2 over 40% (overperiod), Day #6 under 50%, Day #21 under 60%, Day #17 under 70%
Source for charts unless otherwise noted: TradingView.com
Full disclosure: long SPY put spread, long QQQ call, long IWM shares, call spread, and calls; long SVXY calls, long AMZN calls, long UPST strangle, long FROG
FOLLOW Dr. Duru’s commentary on financial markets via StockTwits, Twitter, and even Instagram!
*Charting notes: Stock prices are not adjusted for dividends. Candlestick charts use hollow bodies: open candles indicate a close higher than the open, filled candles indicate an open higher than the close.


