

Housing Market Intro and Summary
What happened in the housing market in July, 2024? July started with a major downgrade from Citigroup for the housing sector. The downgrade at the time confirmed the implications of a bust for the spring selling season. My lamentations about the bust seemed confirmed by further deterioration in the housing data for the month. However, along the way, a weak report on inflation excited financial markets about the prospects for rate cuts from the Federal Reserve. Suddenly, the data mattered little and the rate-sensitive stocks of home builders took off like jet planes. The celebration came to a screeching halt with weak jobs numbers for July. While the economic weakness nearly guarantees a rate cut in September, the specter of a rapid decline in employment will add further pressure to the health of the housing market.
Overall, I am skeptical about the current rally in the stocks of home builders. The Fed’s rate cuts may turn sentiment around, but that sentiment in turn could pace demand well past supply, drive prices ever higher, and make homes even less affordable for people still holding jobs. The housing market is in quite a bind. Economic weakness that convinces the Fed to cut rates will be a poor harbinger for the housing market in the intermediate term.
In the meantime, the key messages from the July housing data were new lows for the year contrasted by a sharp divergence from soaring prices for the stocks of home builders.
- The stocks of home builders rolled over and topped out in June, but broke out in July thanks to the giddy anticipation of rate cuts.
- Homebuilder sentiment fell for the third consecutive month to a new low for the year. However, a small sign of life in a forward-looking component of the sentiment indicator could serve as the launchpad for sentiment hopeful about rate cuts.
- Single-family housing starts dropped to a new low of the year. Building permits registered their first year-over-year decline since May, 2023.
- Sales of new single-family homes fell marginally to a new low for the year.
- Sales of existing homes plunged to a low for the year and approached the 13-year low set last year. Prices still set new all-time highs.
- California existing home sales continued a resumption of a downtrend even as prices continued to trend upward.
- Pending home sales increased 4.8% off an all-time low for the entire data series.
Housing Stocks
The iShares US Home Construction ETF (ITB) gained an astounding 19.3% for the month of July. This gain is ITB’s entire 18.5% year-to-date gain through July. ITB in turn returned to out-performance versus the S&P 500 (SPY) which gained 15.8% for the year through July. The S&P 500 even ended July on a weak note. Perhaps ominously, ITB ended July with a potential blow-off top, meaning that the last motivated buyers finally spent all their money excitedly chasing ITB higher. This blow-off top comes in the form of a new all-time high high during the trading day but a loss at the end of the trading day. This reversal comes at the end of a sharp uptrend and is followed by continued selling.
")
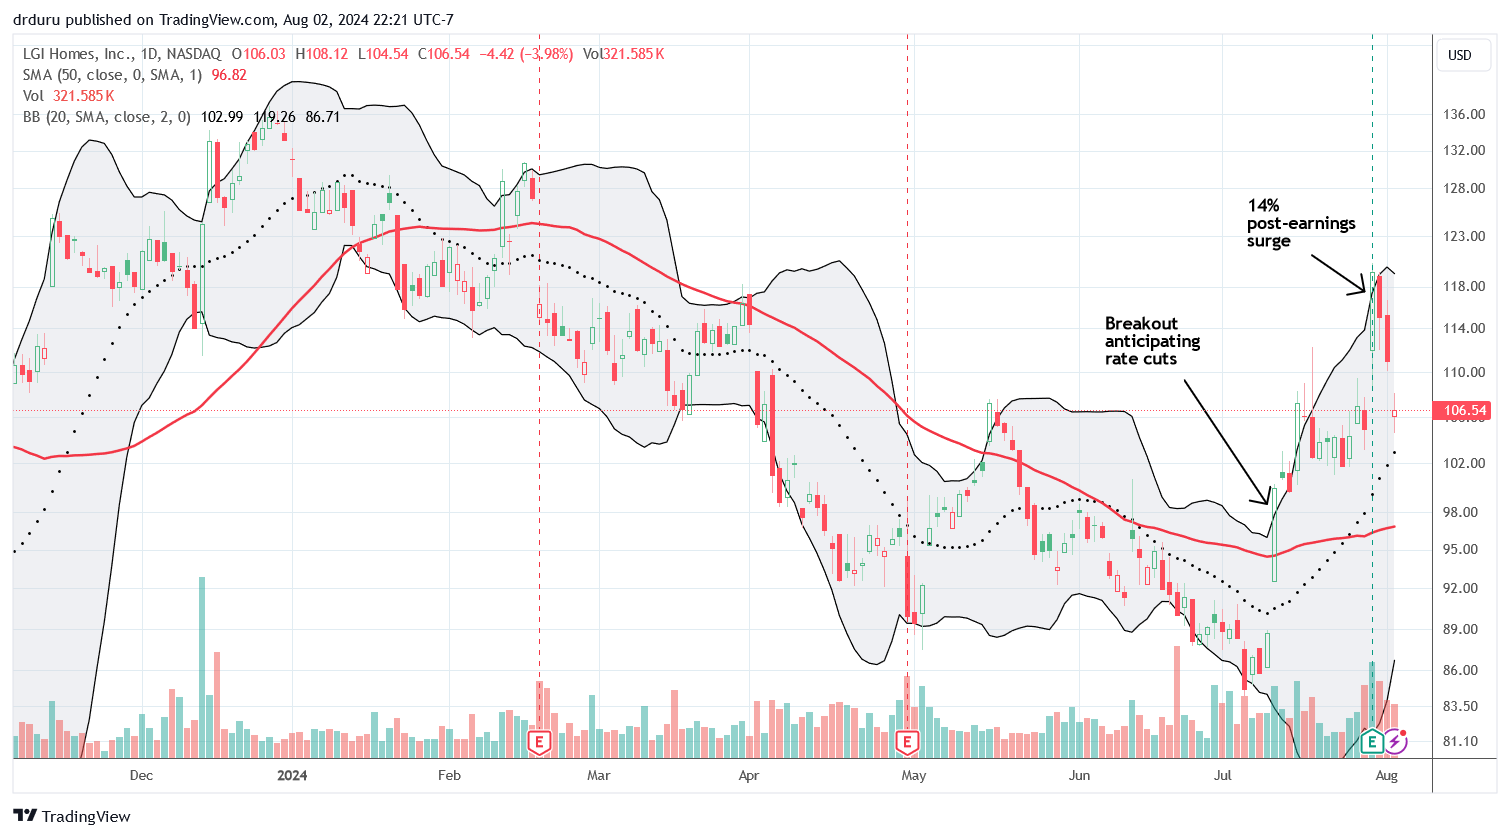
I wrote warily about LGI Homes, Inc (LGIH) in late June because its under-performance suggested more trouble ahead. The stock bottomed two weeks later as the celebrated anticipation of rate cuts sent LGIH soaring 12.7% with a freshly bullish breakout above its 50-day moving average (DMA) (the red trendline below). I watched in yet more surprise as LGIH surged 14% post-earnings. I am NOT surprised that investors took those gains and sold LGIH back to pre-earnings levels. Right now, the price performance of many home builders is predicated on macroeconomic expectations instead of the specific financial results. When investors are heavily discounting a positive future, past results matter little.
In April, LGIH provided the following guidance:
“With clear visibility onto our backlog and the strong demand we continue to see, we are confident in our original closing target of between 7,000 and 8,000 homes at an average selling price between $350,000 and $360,000. Our full year gross margin guidance remains between 23.1% and 24.1% and adjusted gross margin between 25% and 26%.”
In its latest quarterly earnings report, LGIH significantly cut its closing guidance to a range of 6,400 to 7,200. This reduction does not surprise me given current market sales trends. The company raised the low and high end of its ASP range by $10,000, hardly enough to preserve the implied top-line revenue guidance. So in this case, investors heavily extrapolated rate cut expectations to LGIH beating its lowered guidance. I do not want to bet on that strong assumption.
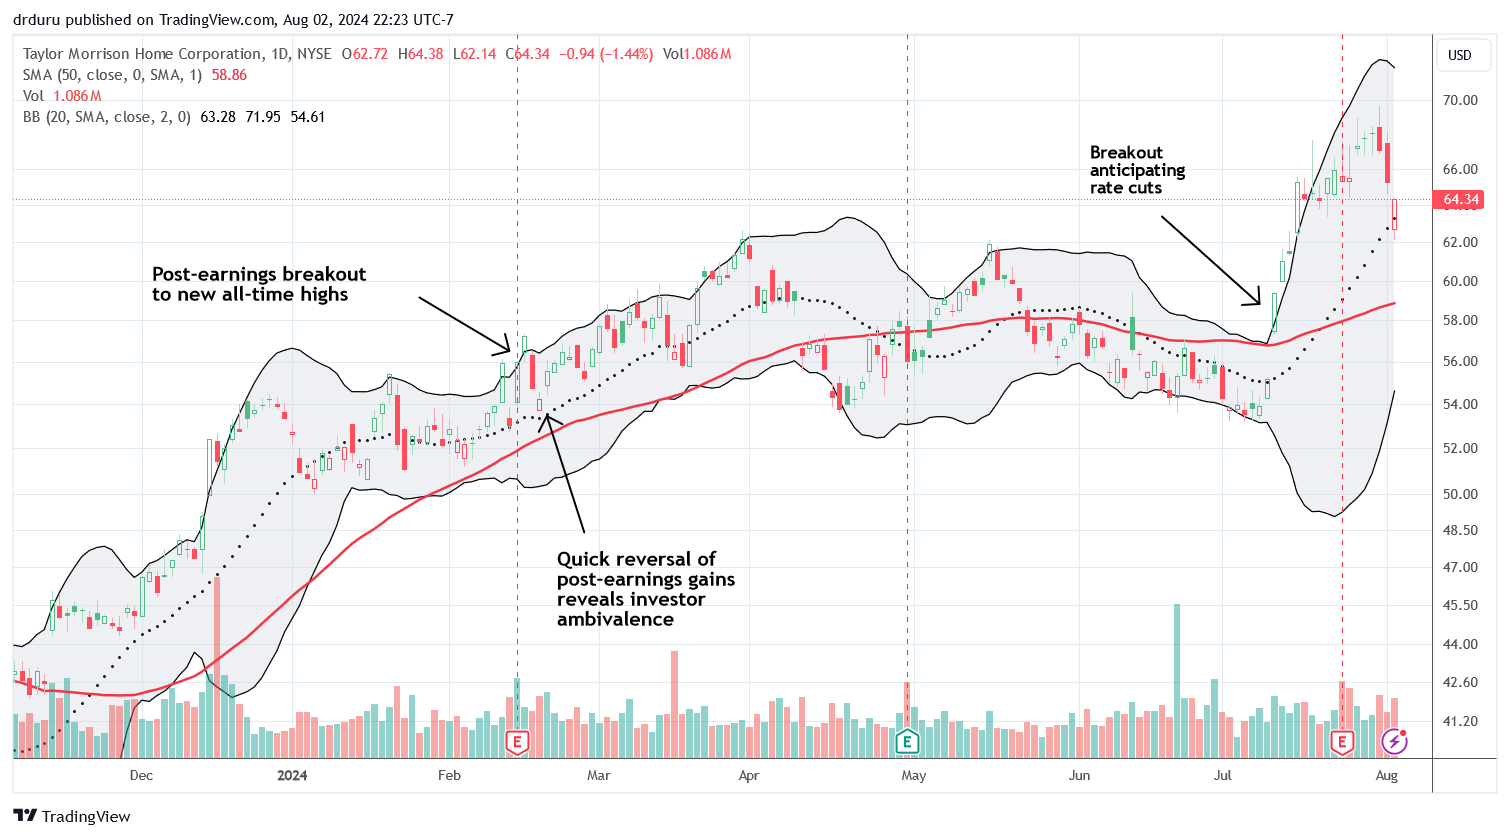
Taylor Morrison Home Corporation (TMHC) is another home builder that turned me lukewarm. Back in March, I considered TMHC to be “fully priced.” That assessment looked for 4 months. In July, TMHC broke out to new all-time highs. The response to TMHC’s subsequent earnings report was tepid. The stock initially went nowhere, rallied slightly going into the Fed meeting, and then sold off after the Fed meeting and on the jobs report. With the stock now trading below its price the day before earnings, I suspect TMHC will eventually settle back toward or into the previous trading range. Analysts on the conference call looked askance at an aggressive assumption for an ASP increase in Q4, implied reductions in cash flow, and high SG&A expenses.
Housing Data
Home Builder Confidence: The Housing Market Index – July, 2024
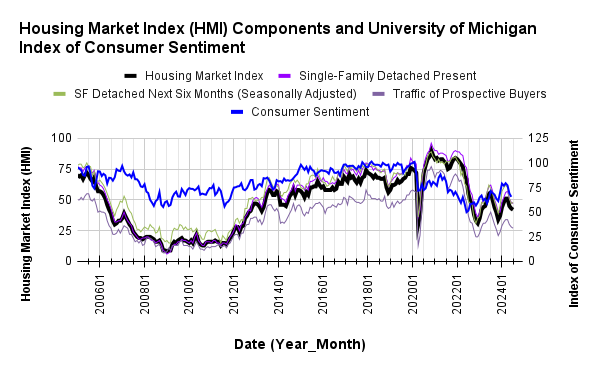
The National Association of Home Builders (NAHB)/Wells Fargo Housing Market Index (HMI) dropped another point to 42, its third consecutive monthly decline and a new low for the year. According to the NAHB, elevated mortgage rates and loan rates continue to weigh on sentiment. Thus, it will be interesting to see whether sentiment immediately jumps back up with general market expectations for imminent Fed rate cuts.
At least one of the components may be an early sign of hopes for rate cuts. According to the NAHB, “the six-month sales expectation for builders moved higher, indicating that builders expect mortgage rates to edge lower later this year…”
/Wells Fargo Housing Market Index (HMI) and the University of Michigan Index of Consumer Sentiment")
Source for data: NAHB and the University of Michigan
All three components of the HMI remain well synchronized month-to-month even with the SF Detached Next Six Months increasing by a point.
Builders felt further pressure to reduce prices in July. The 31% share of builders cutting prices is up from 29% in June and 25% in May. Still, the average price discount stayed flat at 6% for the thirteenth straight month. The share of builders providing incentives stayed flat month-over-month at 61%.
The HMI experienced broadening weakness across regions in May. The picture was mixed for June and now July. The South stayed flat with its low for the year. The Midwest fell another point a month after plunging off its high of the year. July was the Northeast’s turn for a plunge: the region crashed from 62 to 47 for its lowest reading since October. Meanwhile the West lost the point it gained in June.
New Residential Construction (Single-Family Housing Starts) – June, 2024
Single-family housing starts fell to a new low of the year and and hit below 1M for the first time since last October (after May was adjusted higher). My assumption that starts would stabilize around the 1M mark still looks tenuous even with one of the components of builder sentiment perking up for a point gain. I do not expect starts to ride the excited anticipation of rate cuts. Instead, builders should need to see actual rate reductions to make the incremental commitments. For June, single-family housing starts decreased 2.2% month-over-month to 980,000, down from 1,002,000 (revised significantly upward from 982,000). June delivered a 5.4% year-over-year increase in starts thanks to a favorable comp from a one-month dip a year ago.
![US. Bureau of the Census, Privately Owned Housing Starts: 1-Unit Structures [HOUST1F], first retrieved from FRED, Federal Reserve Bank of St. Louis, July 28, 2024](https://drduru.com/onetwentytwo/wp-content/uploads/2024/07/20240728_Housing-starts-June-2024.png "Housing starts")
A peaking in builder permits continues to reinforce the peaking in housing starts and builder sentiment. Building permits in March ended an impressive 13-month streak of sequential gains with a 4.2% decline from February. June continued the sequential declines with a 1.8% drop from May. These sequential declines align with the broadening weakness in the housing market, but anticipation of lower rates may arrest the decline in permits. The year-over-year change was negative for the first time since May, 2023. The year-over-year gain peaked in December at 36.9%. June was down to a -0.7% change and met my expectation for a flattening by July.
The West was the only region to maintain a year-over-year gain in starts in May. In June, all regions enjoyed a year-over-year bump (again, thanks to favorable comps) except the Midwest which stayed flat. The Northeast, Midwest, South, and West each changed +15.5%, 0.0%, +5.5%, and +5.0% respectively year-over-year.
New Residential Sales (Single-Family) – June, 2024
May’s new home sales numbers officially underlined the 2024 spring selling season as a “bust”. June continued the decline ever so slightly while barely avoiding dropping below the low in sales from 2023. June new home sales of 617,000 decreased 0.6% below May’s sales. May sales were revised upward from 619,000 to 621,000. Sales decreased 7.4% year-over-year.
![US. Bureau of the Census, New One Family Houses Sold: United States [HSN1F], first retrieved from FRED, Federal Reserve Bank of St. Louis, July 28, 2024.](https://drduru.com/onetwentytwo/wp-content/uploads/2024/07/20240628_New-home-sales-June-2024.png "new home sales")
The median price jumped from the year’s lows to $417,300 (after a significant downward revision of May’s median price), essentially flat with last June’s $417,600. The year-over-year changes have flattened out for the last several months.
A sharp shift in sales to homes priced near or above the median helped drive a sudden surge in price in March. In April, the sequential and year-over-year mix shifted toward the median. In May, the price distribution strongly favored the bottom two tiers with a 5 percentage point total gain year-over-year. June featured two notable shifts. Year-over-year, homes priced under $300,000 increased share from 14% to 17%, the largest change of any segment. At the same time, the middle of the price distribution surged in share from May from 16% to 22%. While the incremental changes are volatile, there is a clear tendency for sales to swing toward the lower half of the distribution. This shift helps explain a lot of the weakness in the overall median price as buyers desperately search for affordable homes.
June’s inventory was 9.3 months of sales, up from 9.1 in May. This continues an overall uptrend for over a year. For comparison, a year ago inventory sat at 7.7 months of sales. Absolute inventory in June increased from 472,000 to 476,000, the highest level since February, 2008. See the home closing thoughts below for more context on these seemingly high inventory numbers.
As in May, regional sales swung wildly in June. The Northeast, Midwest, South, and the West changed -63.6%, +32.8%, -12.2%, and +2.8% respectively.
Existing Home Sales – June, 2024
In my last Housing Market Review, I concluded that existing home sales would hold last year’s low given the recent rate of declines were slowing. I was wrong on the latter and may soon be proven wrong on the former. If ever there was a time for the National Association of Realtors (NAR) to be right about rising inventories motivating more sales with pent-up demand, June should have been the month. Yet, the magic failed to happen as existing home sales took an abrupt tumble in June as inventory soared – a combination more typical of a housing slowdown.
The seasonally adjusted annualized sales in June of 3.89M declined 5.4% from May’s 4.11M (revised down from 4.14M) while also decreasing 5.4% year-over-year. This plunge confirms that the spring selling season was a complete bust for existing home sales.

(For historical data from 1999 to 2014, click here. For historical data from 2014 to 2018, click here) Source for chart: National Association of Realtors, Existing Home Sales© [EXHOSLUSM495S], retrieved from FRED, Federal Reserve Bank of St. Louis, July 28, 2024

The failure of the bottoming process is most pronounced in condo and coop sales. These sales finally cracked the 400,000 level and are ever closer to the pandemic low. Condos and coops are no longer cushioning the decline in the overall existing home sales number.
May’s absolute inventory of 1.32M homes was up 3.1% month-over-month and up 23.4% year-over-year. According to the NAR, “unsold inventory sits at a 4.1-month supply at the current sales pace, up from 3.7 months in May and 3.1 months in June 2023. The last time unsold inventory posted a four-month supply was May 2020 (4.5 months).” This jump in inventory put on hold the NAR’s hopes from the last report: “Eventually, more inventory will help boost home sales and tame home price gains in the upcoming months.”
Prices ran higher despite the increase in inventory. The persistent price run-up almost regardless of market conditions has weighed on the overall market. The median sales price of an existing home increased to an all-time high for the second month in a row with a 2.3% month-over-month gain, a fifth sequential gain in a row. An increase of 4.1% year-over-year created the 11th straight year-over year gain.
The average time on market for an existing home fell to 22 days, down from 24 days in May, 26 days in April, 33 days in March and 38 days in February. This average time was only 18 days a year ago.
The share of sales to first-time home buyers rebounded from 26% in February to 32% in March and inched higher to 33% in April. The share retreated to 31% in May and further retreated to 29% in June, up from 27% a year ago. I remain surprised that the share is not lower given all-time highs in pricing. The NAR’s 2017 Profile of Home Buyers and Sellers reported an average of 34% for 2017, 33% for 2018, 33% for 2019, 31% for 2020, 34% for 2021, 26% for 2022, and 32% for 2023.
In January, the West was a surprising exception to the regional year-over-year declines in sales. All regions declined in February and March. The West was the sole gainer again in April and May and held flat for June. All three remaining regions declined.. The regional year-over-year changes were: Northeast -6.0%, Midwest -6.1%, South -6.9%, West 0%.
As usual, every region experienced a year-over-year price increase. The regional year-over-year price changes were again substantial for the Northeast: Northeast +9.7%, Midwest +5.5%, South +1.7%, West +3.5%.
Single-family existing home sales decreased 5.1% from May and declined on a yearly basis by 4.3%. The median price of $432,700 was up 4.1% year-over-year and up 2.4 % month-over-month, the fifth sequential increase in a row.
California Existing Home Sales – June, 2024
The California Association of Realtors (C.A.R.) provided an example of the positive impact on sentiment from an anticipation of rate cuts. In the latest report on California home sales, C.A.R. president stated:
“With interest rates coming down to the lowest levels since February and the availability of homes loosening up further in the last few months, the housing market is gearing up for another run in the second half of the year…We could see a pickup in market momentum at the start of the third quarter if rates decline in a more sustainable way in the coming weeks and buyers decide to take advantage of lower costs of borrowing.”
The Senior Vice President and Chief Economist added: “While it will take a couple of more reports for the Federal Reserve to begin cutting rates, housing affordability for qualified buyers should begin to see some improvement in the coming months.”
In the meantime, the California housing market continues to come off its countertrend numbers from April.
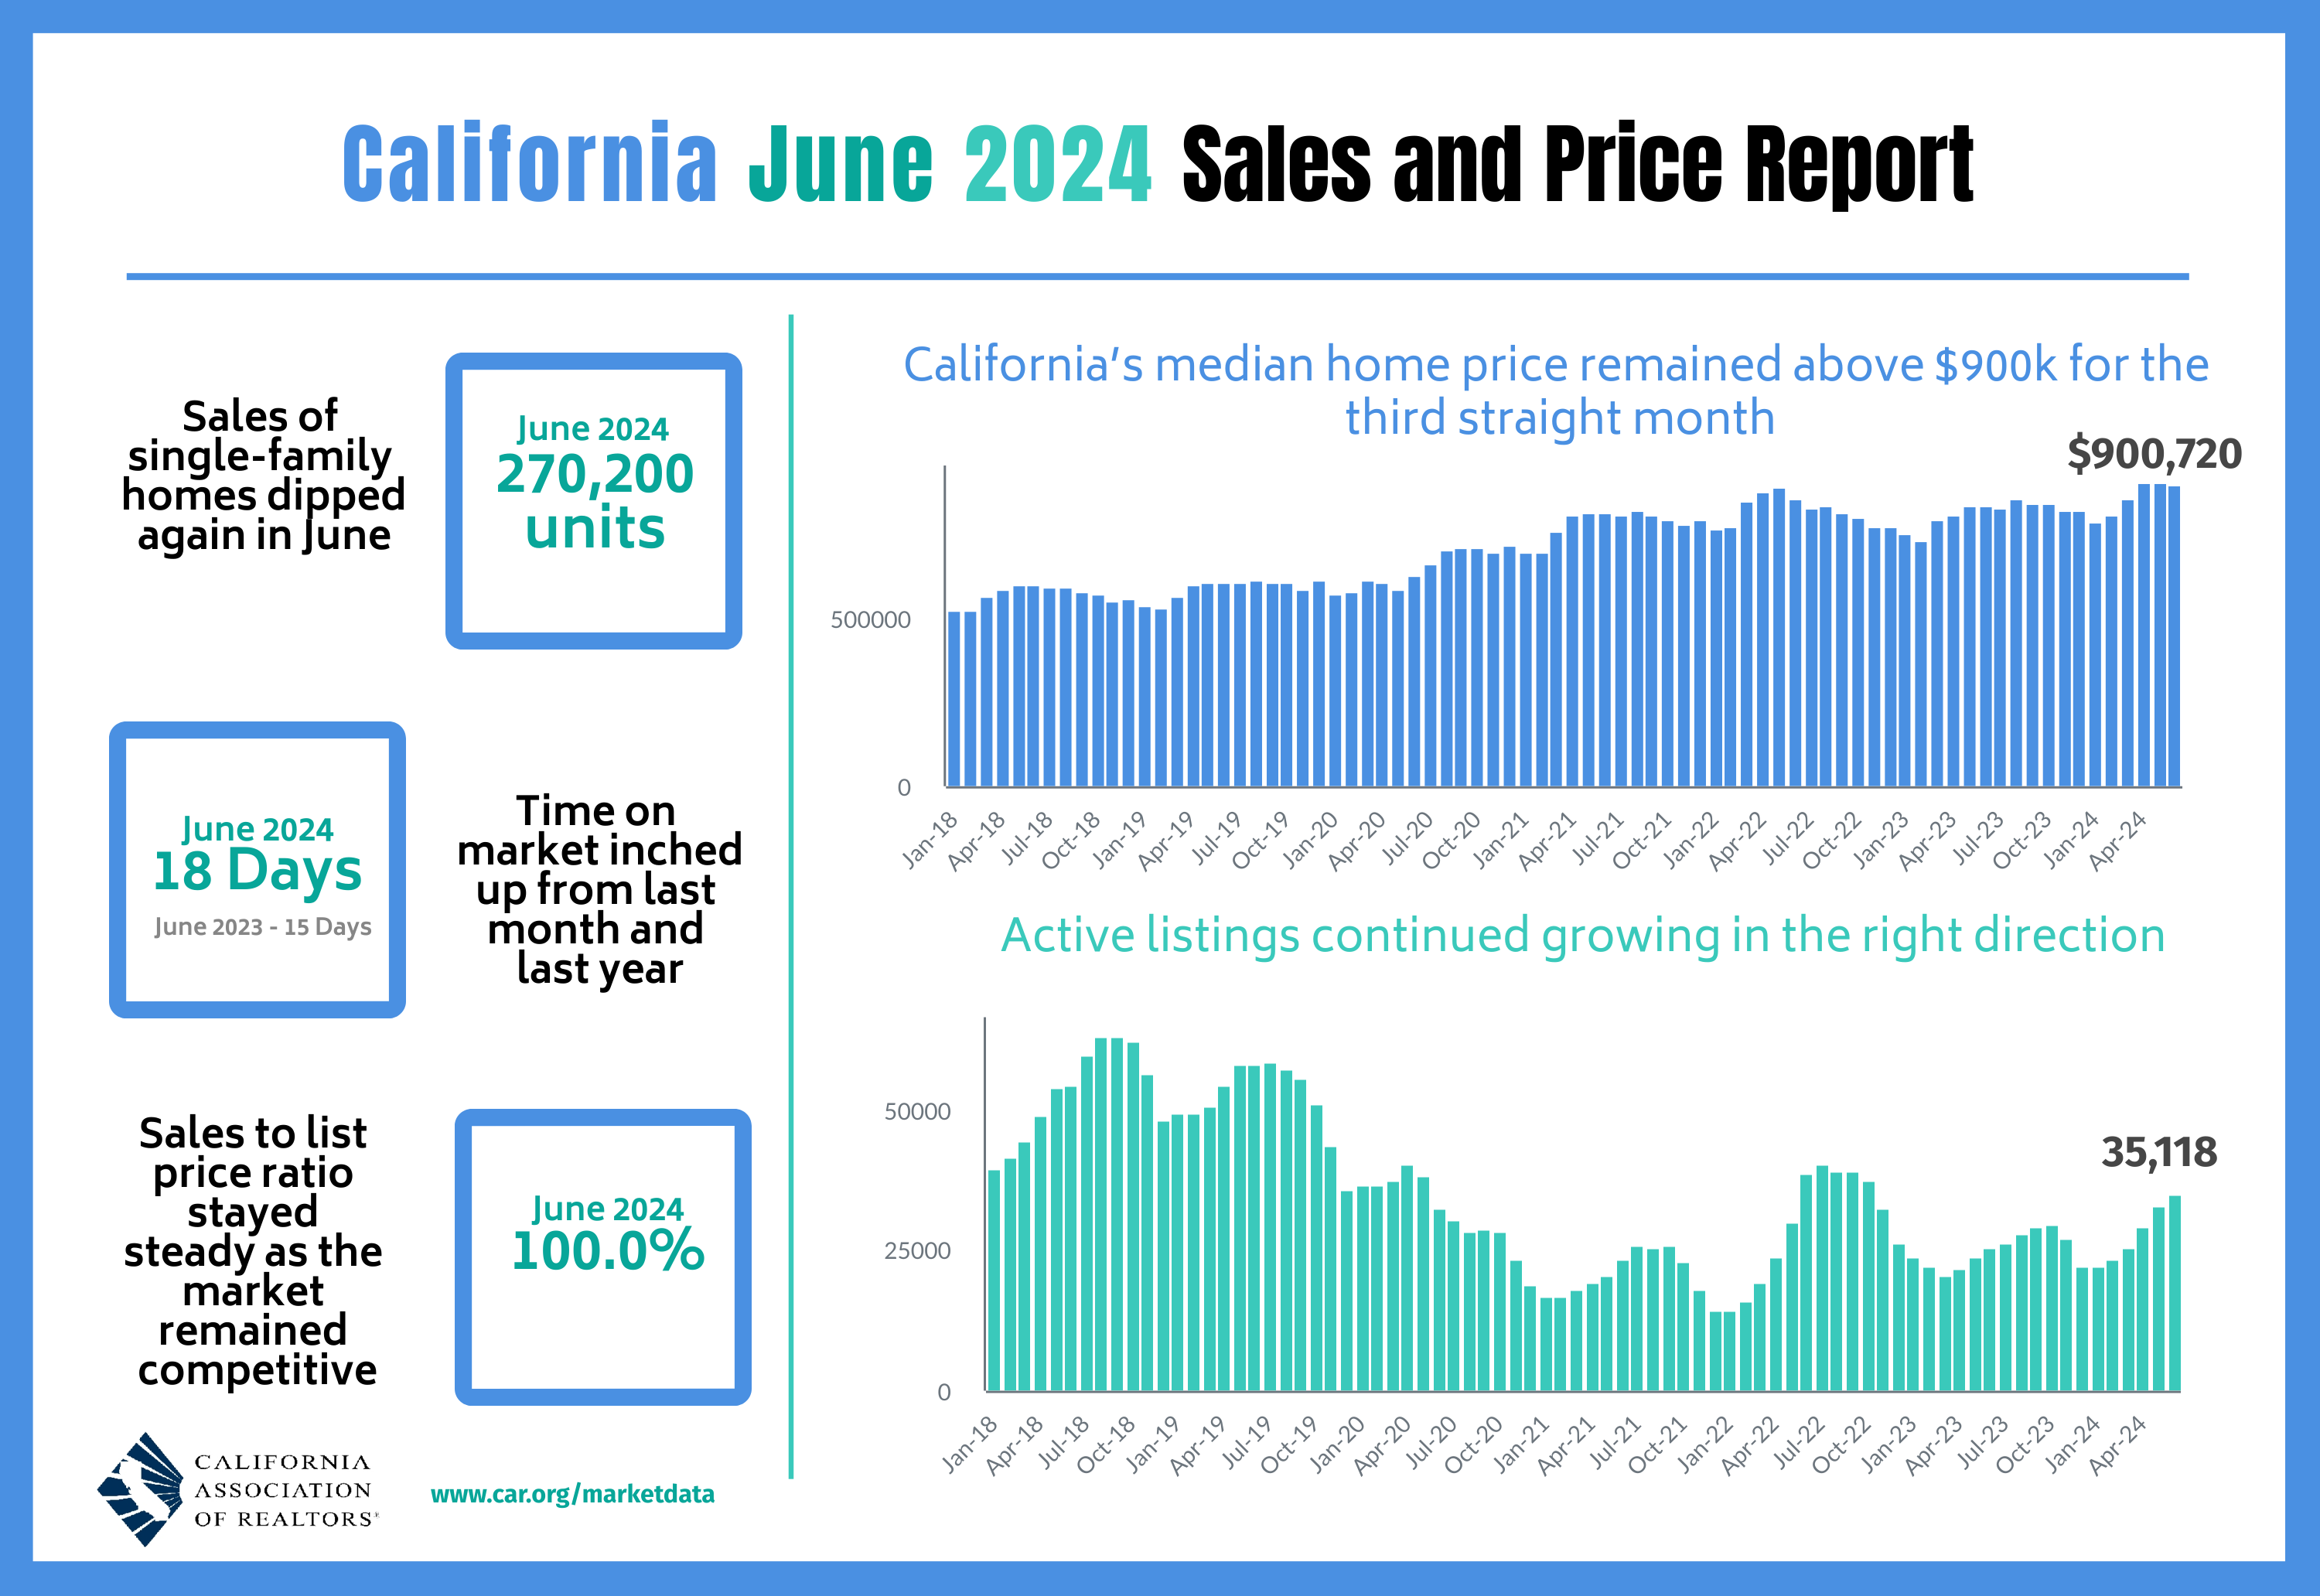
According to the latest report from the California Association of Realtors (C.A.R.), existing single-family home sales totaled 270,200 in June, marking a 0.8% decrease from May and a 2.7% decrease from June, 2023. All five regions in California saw sales decline year-over-year.
As usual, sales declines did not impede price gains. Homes priced over $1M continue to drive California’s median price higher as availability continues to favor higher-priced homes. According to CAR, “the million-dollar-and-higher market segment rose year-over-year in June by 2.0 percent, while the sub-$500,000 segment declined by 21.0 percent. Sales of homes priced above $1 million now make up 36.3 percent of all sales, nearly the biggest share in at least the last five years.” The median home price in June actually decreased slightly off the all-time high by 0.8% to $900,720. Year-over-year the changes still point upward with a 7.5% increase from the $837,850 median price in June, 2023, a twelfth consecutive month of year-over-year gains.
The median time it took to sell a home in California increased to 18 days from 16 days in May and 15 days a year ago.
The statewide sales-price-to-list-price ratio was 100.0% for the fifth month in a row, also unchanged from 100.0% in June 2023. The price per square foot for an existing single-family home in California was $440 in June, a 6.8% increase from a year ago. This increase lagged the overall median price trends.
The Unsold Inventory Index (UII) increased from 2.6 months in May to 3.0 in June. It is notable that the C.A.R. called this jump from 2.2 a year an improvement. The market needs more inventory for both sales and affordability.
Home closing thoughts
Bouncing from Record Low Pending Home Sales
In May, pending home sales printed a glaring sign of coming demand-side trouble for the housing market. The Pending Home Sales Index (PHSI) declined from 72.3 to 70.8 in May to a record low for the data series. Pending home sales bounced off these lows by 4.8% in June. (The chart below comes from the NAHB).

A Sprint Away from Deals
Cancellations of home purchase contracts have been elevated since the Fed started hiking rates in 2022. According to Redfin, these cancellations reached a record level for a June at 14.9%, edging higher than last year June at 14.7%. June’s monthly record happened in parallel with a record number of price drops for homes for the month of June that failed to prevent the median sales price from hitting a fresh all-time high. Sellers reduced the price of 20% of homes for sale in June. A record year-over-year gain in active listings (12.8%) also failed to prevent record prices and constrain cancellations.
Converting vacant offices to apartments
In early July, Moody’s wrote “Apartment Demand Slowly Catching Up, Office Stress Continued to Manifest, Retail Resilient Despite Bankruptcies, And Industrial Cools Down.” The economic analytics firm noted a record level of office vacancies: “The office sector set a new vacancy record at 20.1%, up from 19.8% in the prior quarter and breaking the 20% barrier for the first time in history.” This stat was the basis of a segment from Marketplace on converting offices to apartments in Boston. Here is the ChatGPT summary of the related article:
“In Boston, the trend of converting office spaces into residential units is gaining momentum, particularly due to government subsidies, including a 75% property tax break. This initiative aims to address high office vacancy rates and the city’s housing shortage, with Boston requiring 69,000 new housing units. Developers face challenges such as high conversion costs and affordability requirements, but such projects are seen as a way to revitalize downtown areas and preserve older buildings. Similar efforts are being pursued in other cities like Chicago and New York.”
Total Housing Inventory
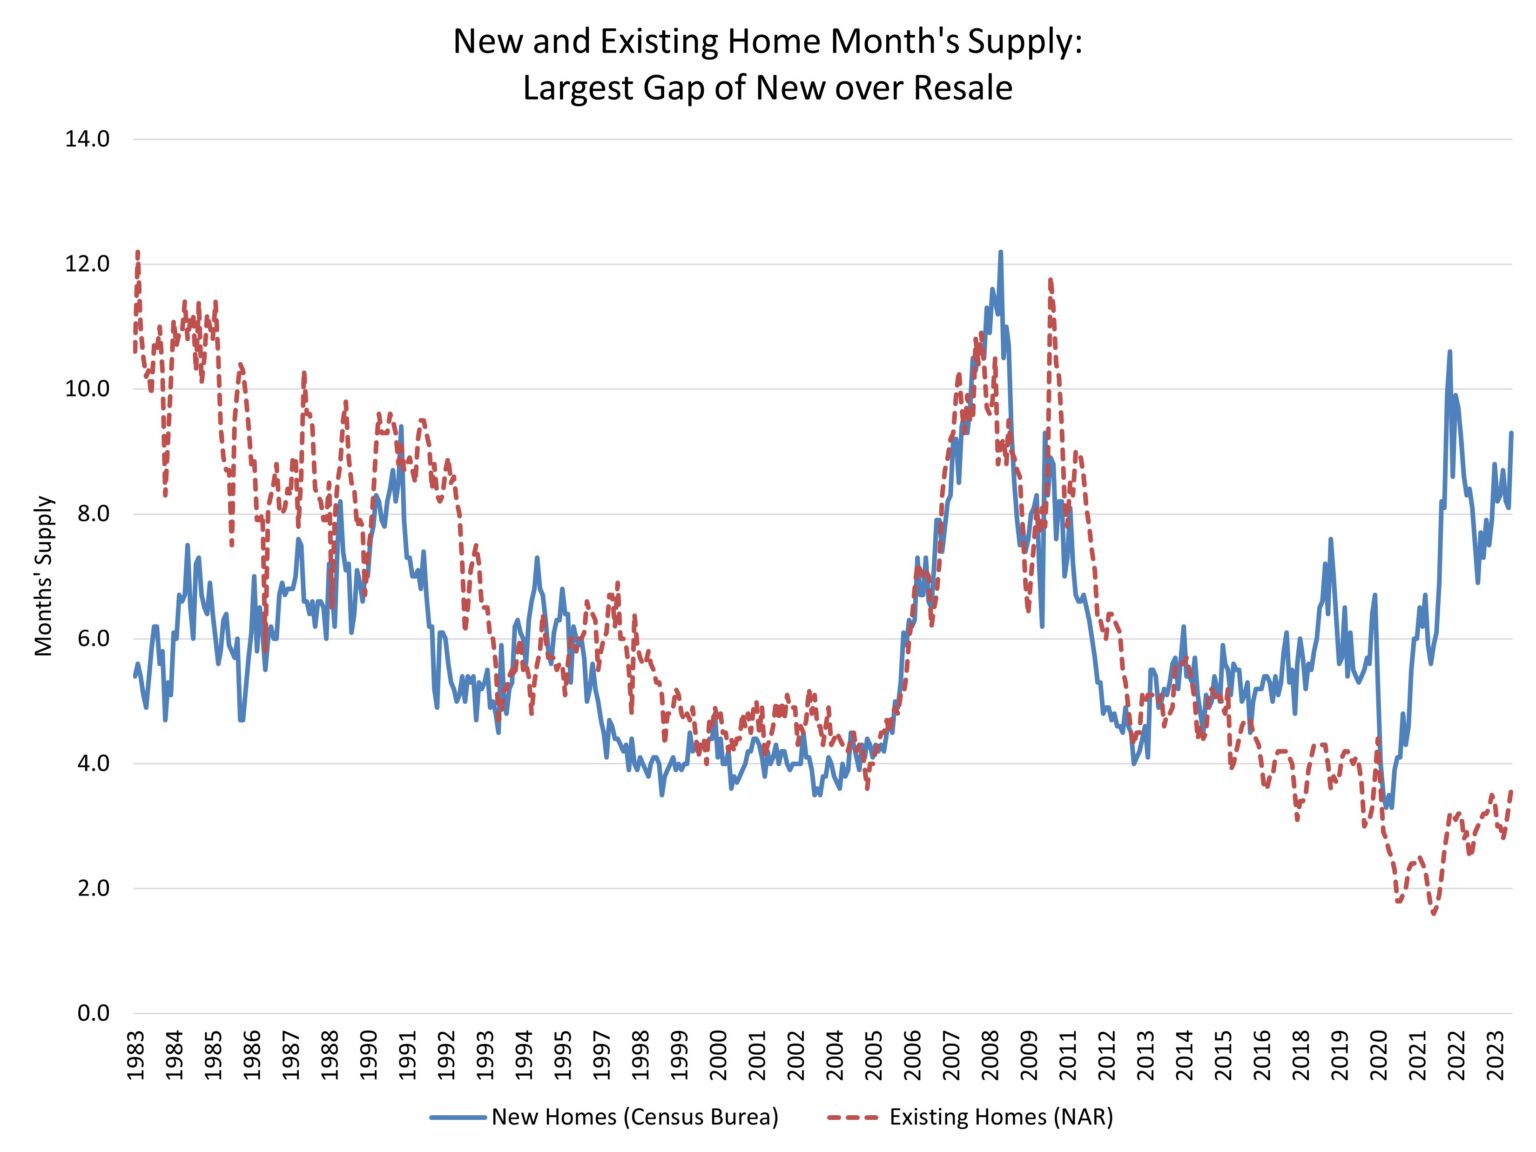
In June, the NAHB updated its analysis of total inventory in the housing market. In “Considering Housing Inventory: Why Both New and Existing Supply Matters”, the NAHB explains how the historically large gap between new and existing home sales and inventory means that one market’s inventory provides an incomplete picture. So while new home inventory looks extremely high and existing home inventory looks extremely low, total inventory is a near healthy 4.4 months of sales, up from 3.6 months of sales a year ago. The NAHB goes on to conclude that current total inventory continues to support future growth in housing prices.
Spotlight on Mortgage Rates
The Mortgage Bankers Association (MBA) reported two weekly increases and two weekly decreases in mortgage applications in July. In June, new home mortgage purchase applications ticked higher 0.7% year-over-year. The year-over-year increase was the 17th consecutive month of gains and contrasts with the indicators of a softening housing market.
Mortgage rates continued their decline off the May peak. These rates have now declined relatively consistently, albeit slowly, for two months. It seems even the mortgage market is anticipating rate cuts around the corner.
![Freddie Mac, 30-Year Fixed Rate Mortgage Average in the United States [MORTGAGE30US], retrieved from FRED, Federal Reserve Bank of St. Louis; August 1, 2024.](https://drduru.com/onetwentytwo/wp-content/uploads/2024/08/20240801_30-Year-Fixed-Rate-Mortgage-Average-in-the-United-States.png)
Be careful out there!
Full disclosure: long ITB shares, long ITB put