Stock Market Commentary
Last week ended with an historic tech outage that took down operations around the globe. This event was a poetic punctuation to a week that featured a sharp and toppy end to overbought conditions. The stock market’s tech outage features blow-off tops, double-tops, and some key breakdowns in individual stocks. Still, while the outage from technical conditions are bearish, sellers have year-to-date barely put a dent in this stock market. Thus, as always, the opportunity window for bears looks small and tight. The major indices are falling toward trend lines that have provided reliable support except for one brief period in April.
The Stock Market Indices
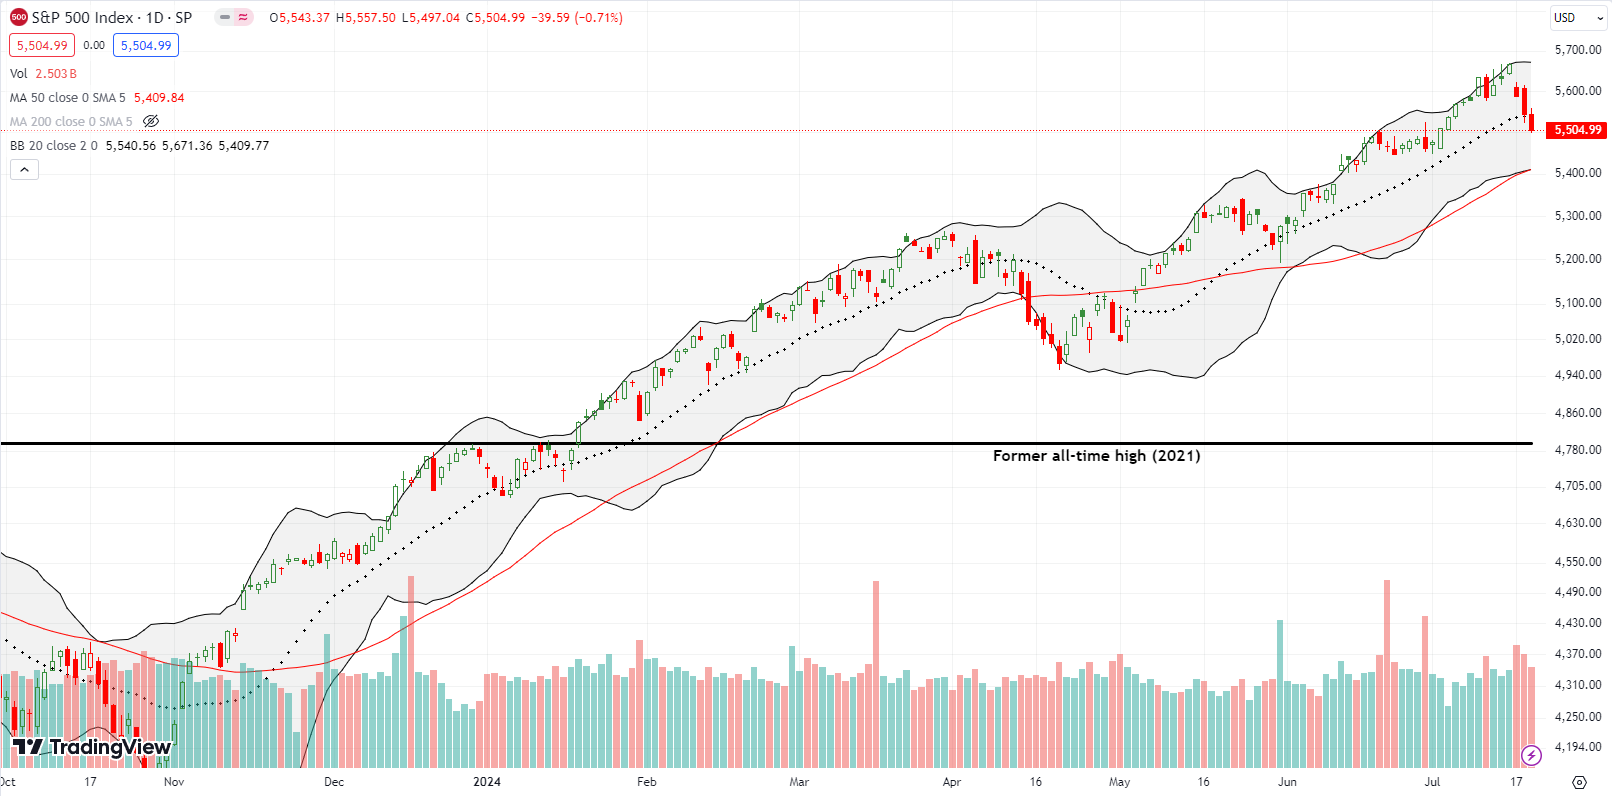
The S&P 500 (SPY) lost 0.7% and closed below its 20-day moving average (DMA) (the dotted line in the chart below) for just the FOURTH time all year excluding April’s sell-off. So this outage is relatively significant. The slide sets up an eventual test of 50DMA support (the red line) where I expect the window of opportunity for bears to slam shut…unless some fresh bearish catalyst appears. I did not buy fresh SPY put options.
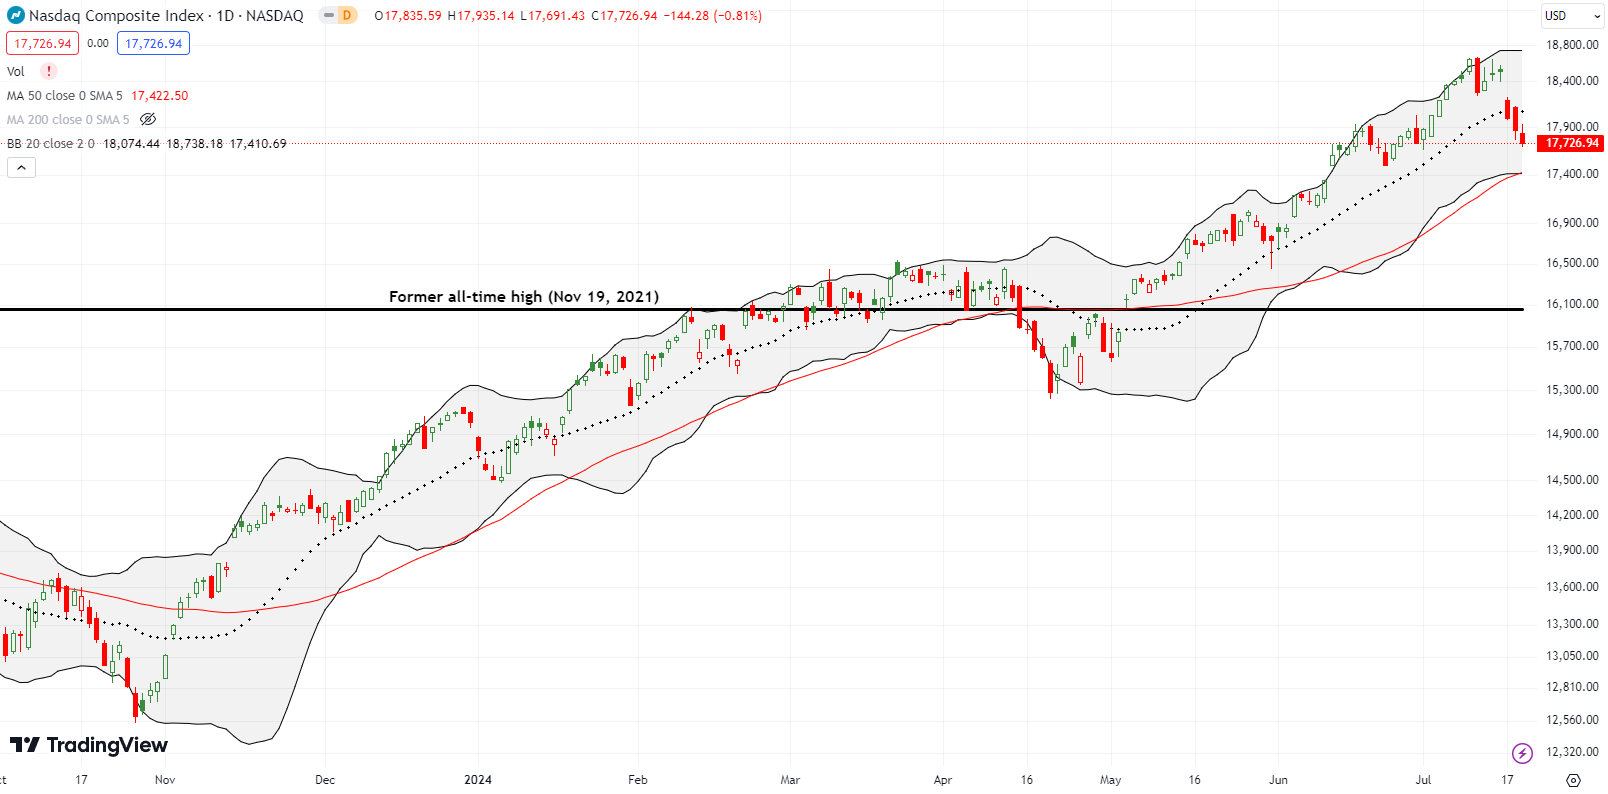
The NASDAQ (COMPQ) already looks well on its way to a test of 50DMA support. The tech laden index lost another 0.8% to end the week. This year, the NASDAQ has closed below its 20DMA just SIX times this year outside the April sell-off. This 20DMA breakdown is even the first breach since the end of April. So like the S&P 500, this technical outage is relatively significant. Yet, the breakdown will soon be forgotten if the automatic money pouring into the stock market successfully defends 50DMA support. I opened a fresh QQQ calendar put spread ($470 strike).
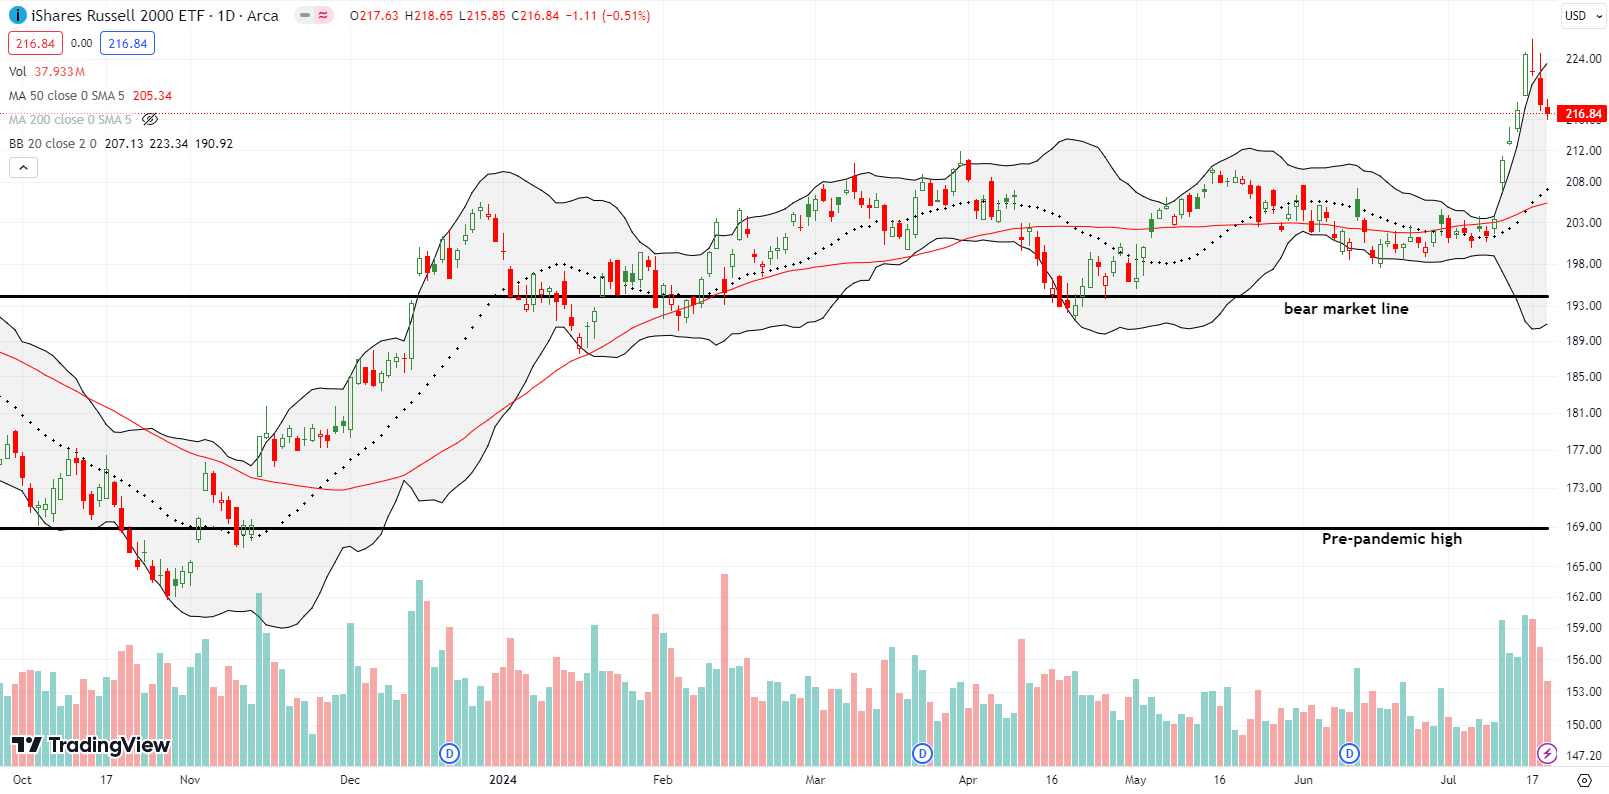
The iShares Russell 2000 ETF (IWM) confirmed its blow-off top with a marginally down day. The ETF of small caps lost 0.5% and finished reversing the last up day of the run-up into the blow-off top. I continue to sit on my hands watching how the “cooling period” from the blow-off top unfolds. I do not want to chase IWM lower. Instead, I am looking to buy on a test of 20/50 DMA support or upon invalidation of the blow-off top.
The Short-Term Trading Call With An Outage
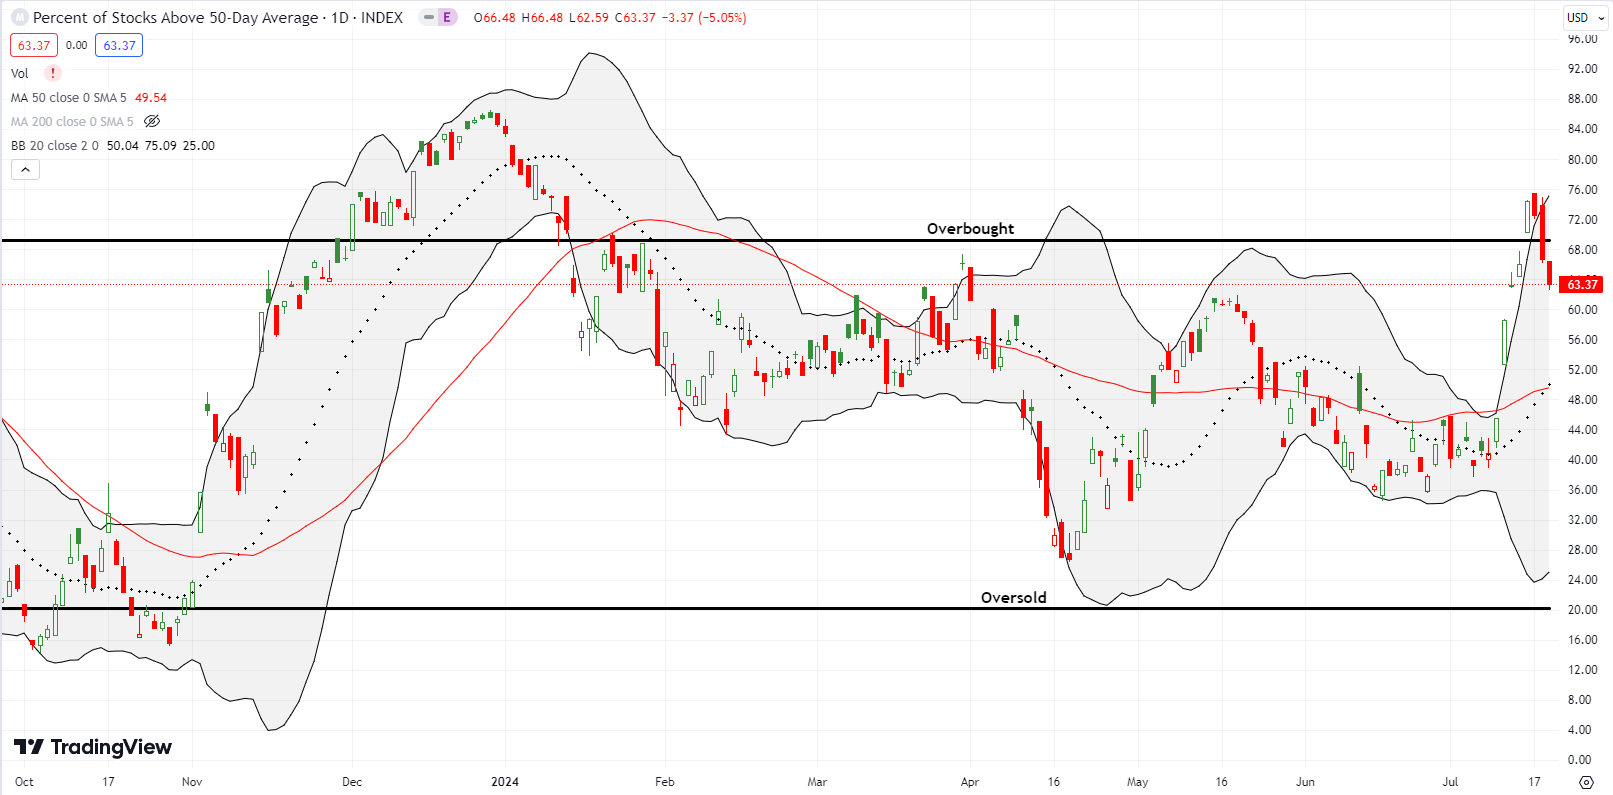
- AT50 (MMFI) = 63.4% of stocks are trading above their respective 50-day moving averages (ending 2 days overbought)
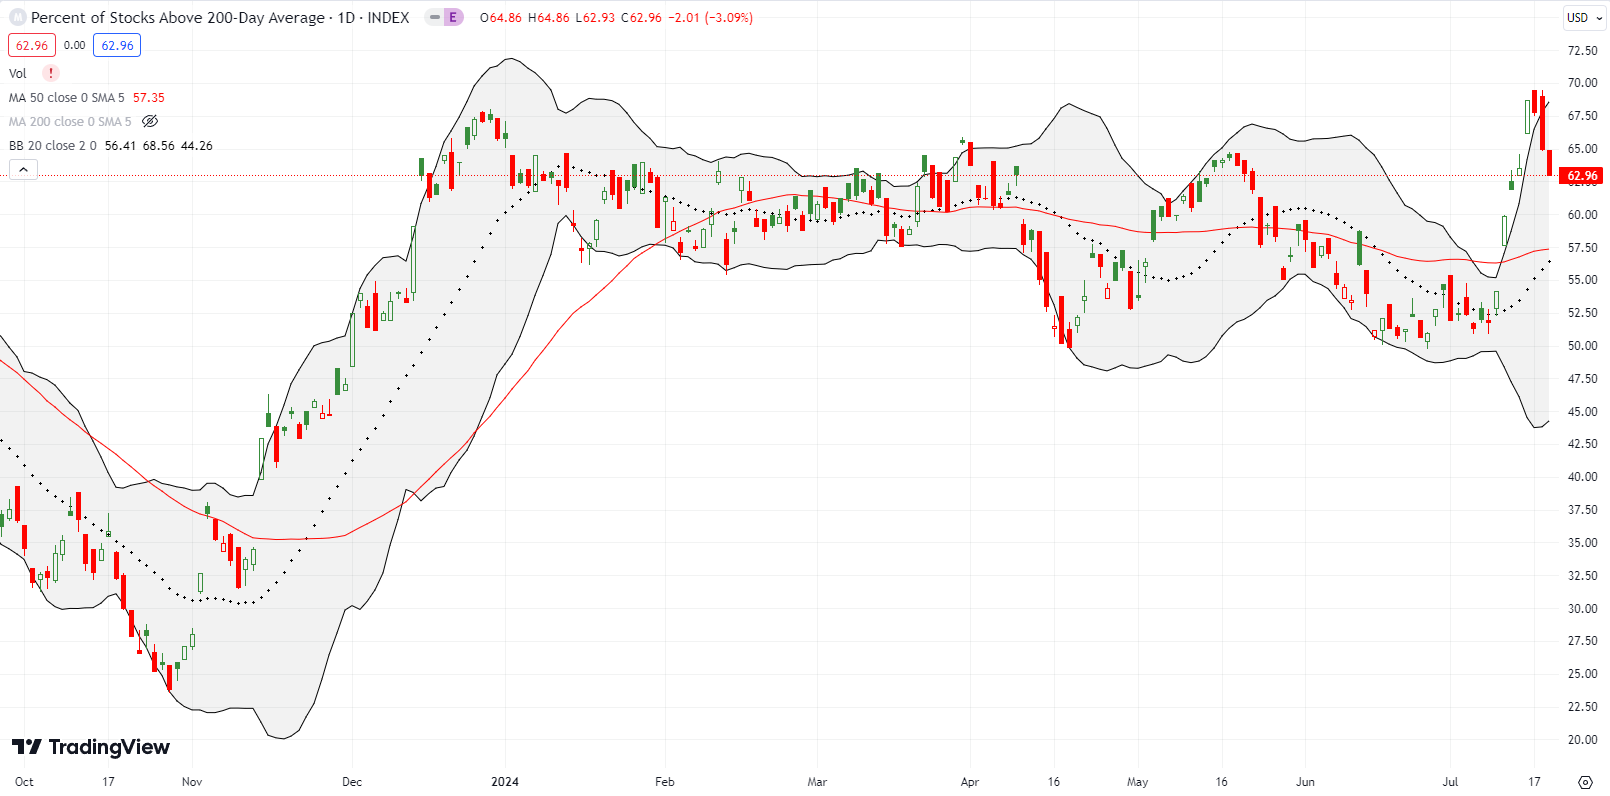
- AT200 (MMTH) = 63.0% of stocks are trading above their respective 200-day moving averages
- Short-term Trading Call: bearish
AT50 (MMFI), the percentage of stocks trading above their respective 50DMAs, fell for a third straight day as part of a broad-based retreat from overbought conditions. The outage in market breadth creates a confirmation of all the topping signals swirling in the market. AT200 (MMTH), the percentage of stocks trading above their respective 200DMAs, also fell for a third straight day from a 3-year high. This longer-term indicator of market breadth holds the keys for bulls still hoping to continue this year’s remarkable rally. AT200 has only traded below 50% once this year and has thus supported the overall uptrend for the year.
Sentiment Trader posted some interesting counterpoints to my assumption that the latest extremes in the market equate to topping patterns. The following stat is one of the most convincing and intriguing of their recent reports: “On Monday [July 14, 2024], more than 50% of Russell 2000 stocks reached a 21-day high, a feat achieved only 24 times since 1979. Precedents that occurred when the small-cap index closed at a 2-year high, like now, resulted in a 100% win rate for the Russell 2000 and S&P 500.” Note how the chart below shows a long-term uptrend in IWM, so IWM looks like it is straining to break out…
This bullish outlook is further supported by the following observation about the significance of the recent rotation into small cap stocks: “A 5-day rotation of this magnitude has only triggered 3 other times in 75 years. Each was notable for multi-month persistence.”
These stats reinforce my assumption that the window for bearishness here will be small and tight. If (once?) the blow-off tops are invalidated, the market could be off to the races all over again. Of course, since my short-term trading call is bearish, I am waiting for buyers and bulls to prove themselves.
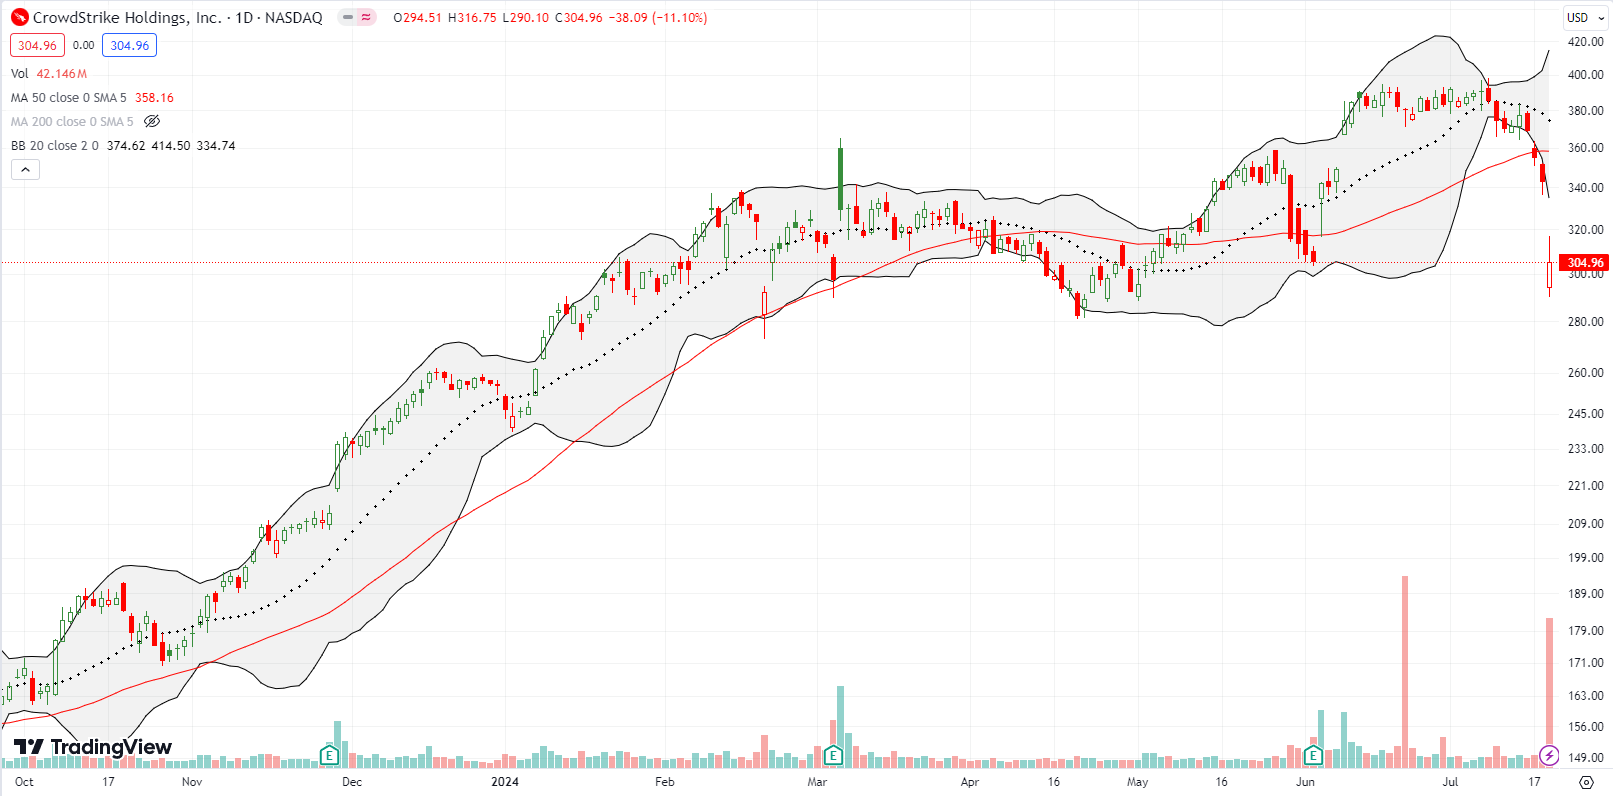
The IT outage caused by software from Crowdstrike Holdings, Inc (CRWD) was a perfect punctuation to the end of overbought trading conditions. CRWD plunged 11.1% following news that a software update took down Microsoft 360 and other applications critical to running a whole host of operations and businesses worldwide. I am surprised CRWD avoided deeper losses. CNBC’s Fast Money had a great discussion about the go-forward trade. CRWD is best-in-class but its extremely high valuation makes it hard to jump in at these levels as a buy the dip. Relatedly, Seeking Alpha’s quant ratings give Crowdstrike’s valuation an F while all the other analytic metrics range from B+ to A.
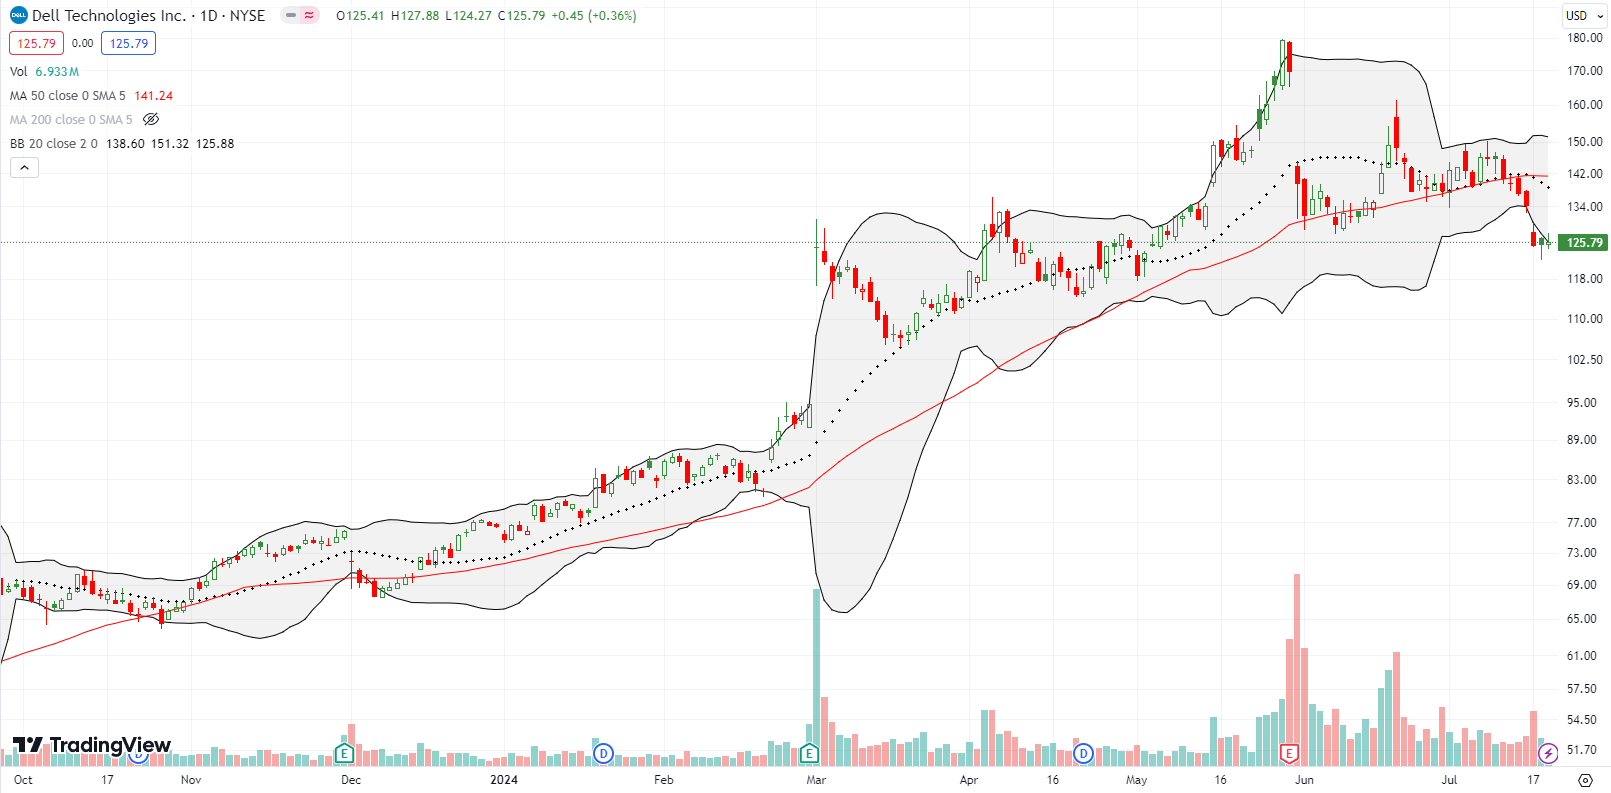
Dell Technologies (DELL) is now a broken stock. Last week, DELL confirmed a 50DMA breakdown and closed at a 2-month low. If I forget that DELL is a member of my generative AI trading basket, I see a topped out stock. That is, the run-up going into the last earnings report looks like a blow-off top.
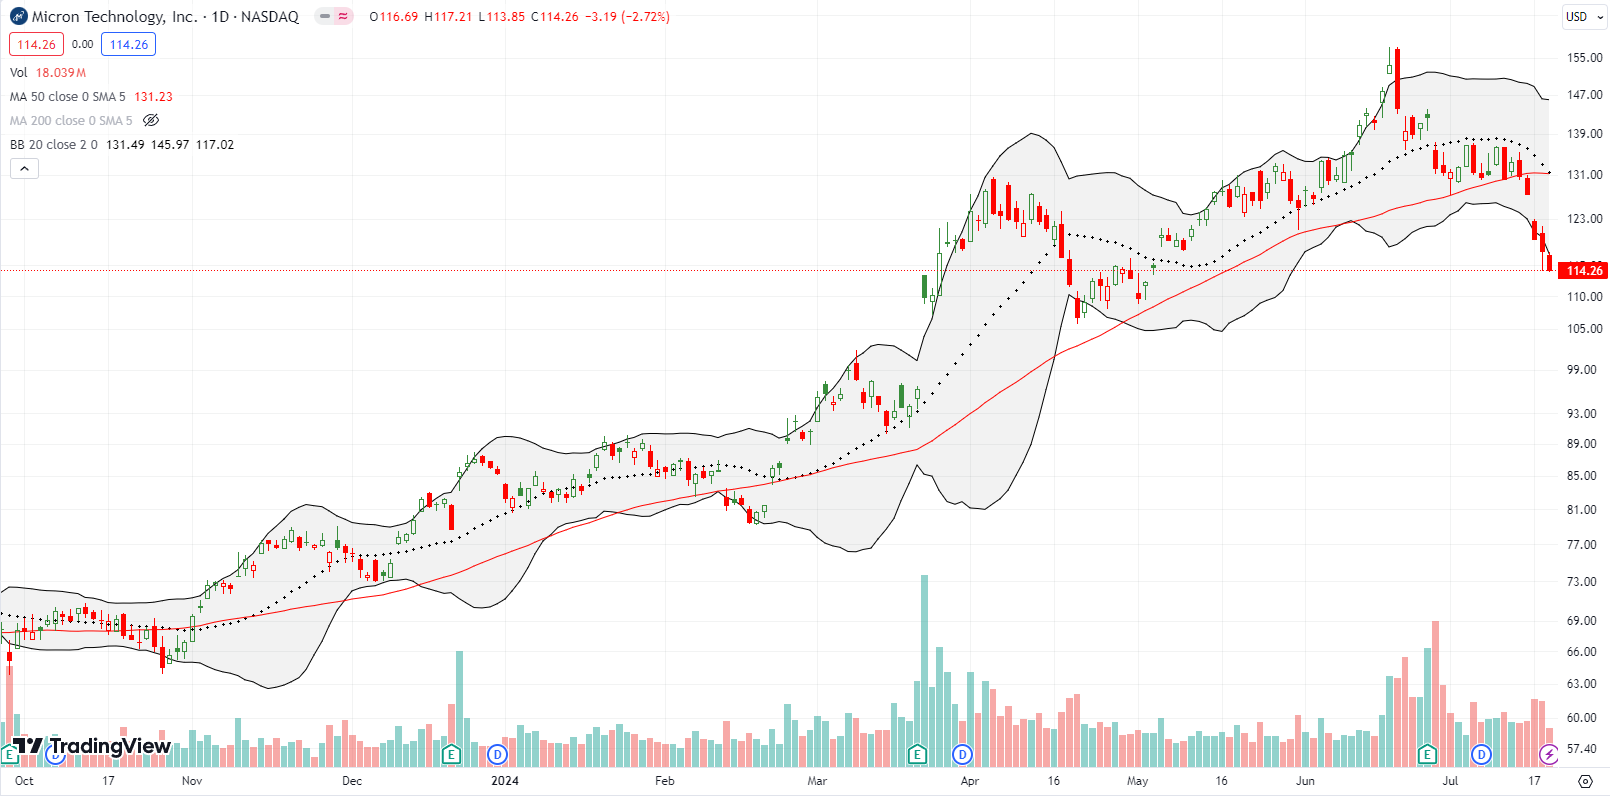
Micron Technology, Inc (MU) also looks like a broken stock with a blow-off top several days before its last earnings report. Just like DELL, MU struggled to regain its pre-earnings momentum only to crumble in exhaustion into a confirmed 50DMA breakdown. The chart below shows how the 20DMA acted as a picture-perfect resistance against buyers. MU closed the week at a 2 1/2 month low.
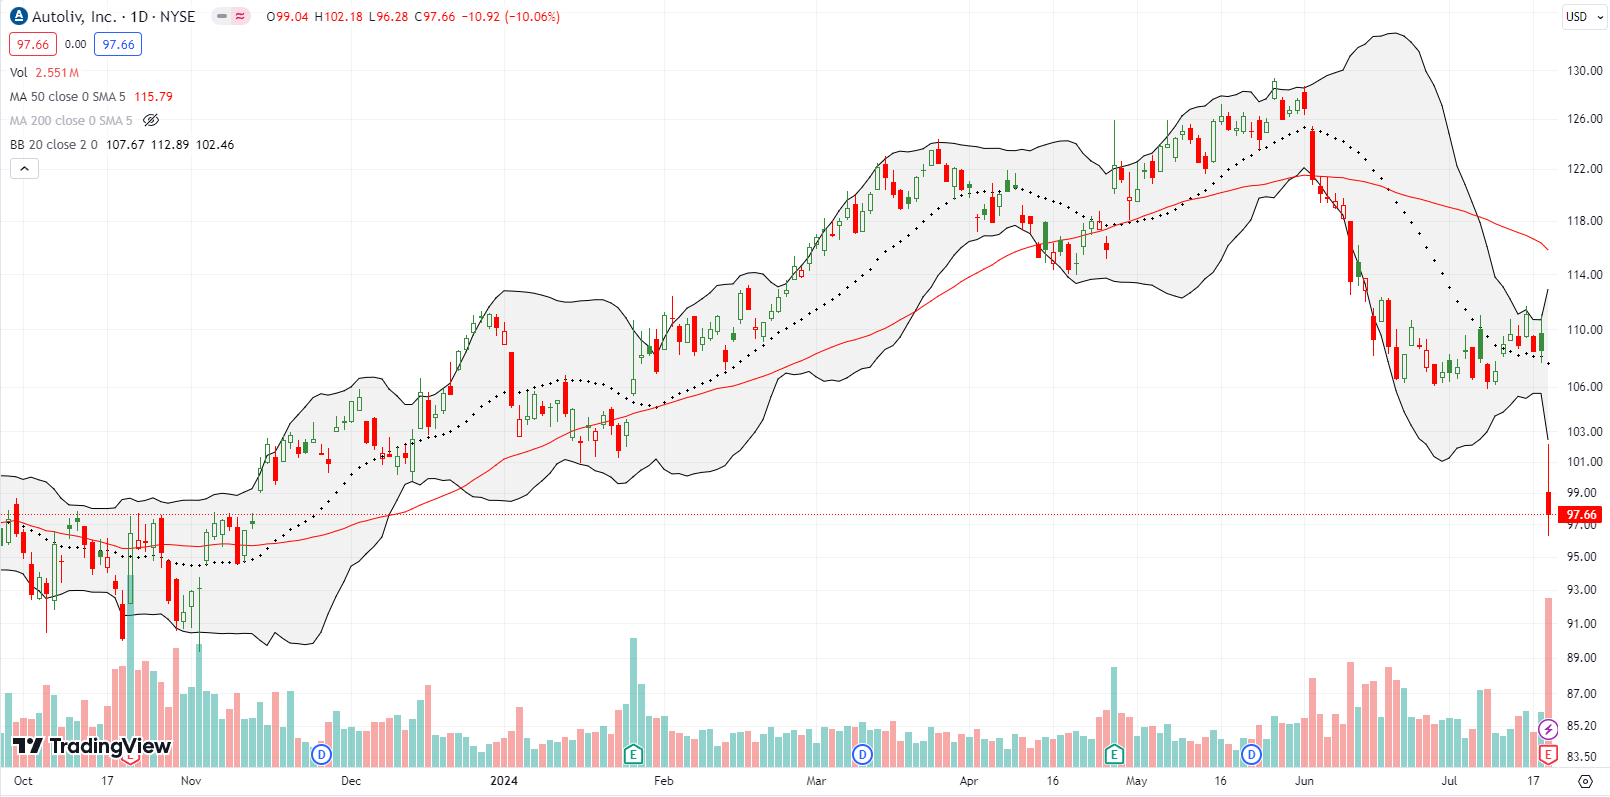
Automobile systems supplier Autoliv, Inc (ALV) suffered a major outage with a 10% post-earnings drop and an 8-month low. ALV is a case where a decisive 50DMA breakdown presaged earnings trouble ahead.
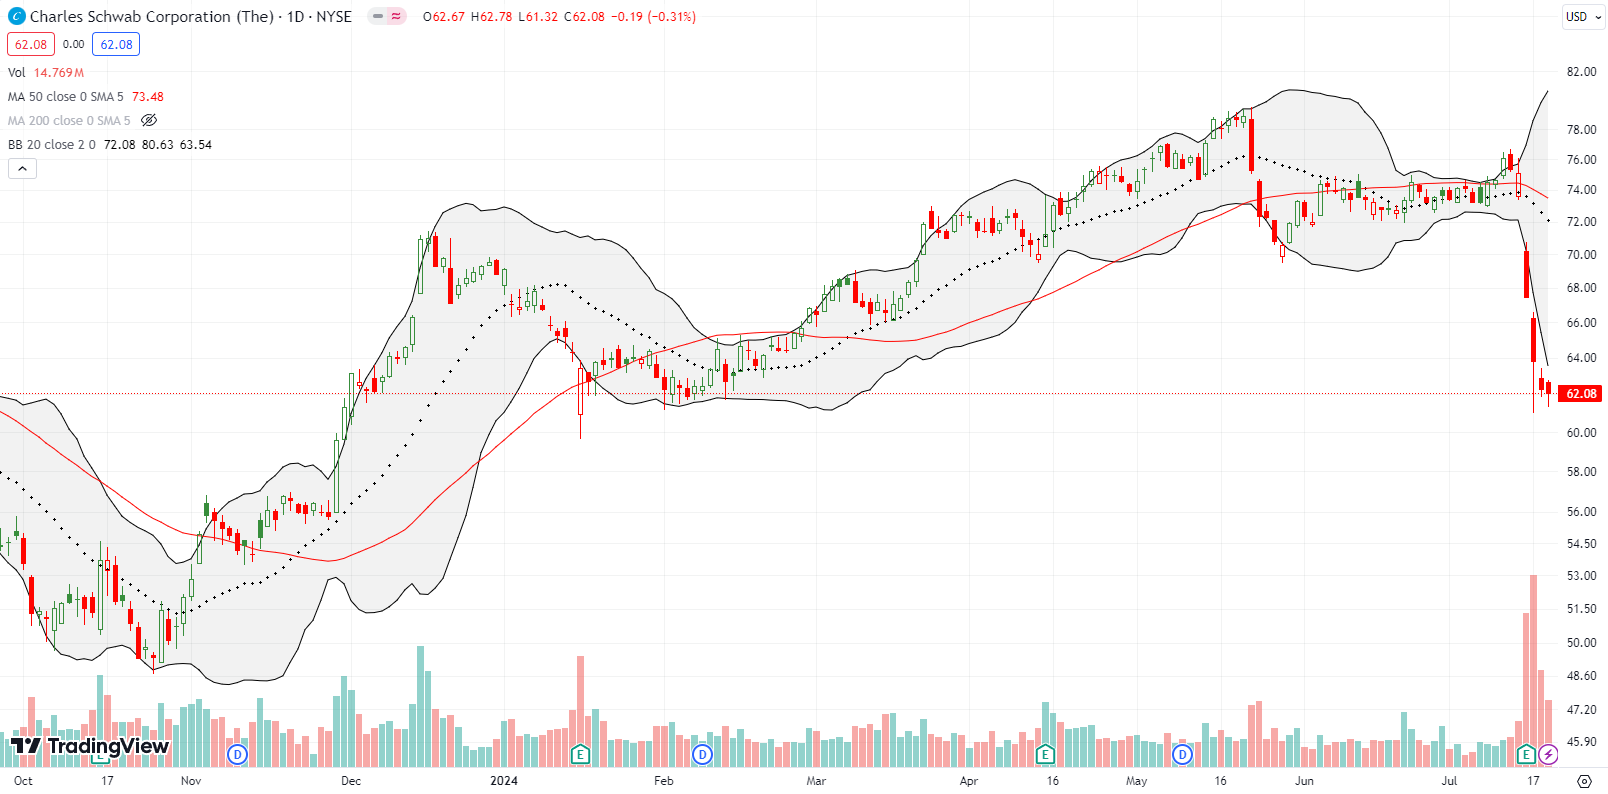
I was just looking at The Charles Schwab Corporation (SCHW) ahead of last week’s earnings-driven sell-off. I noted how SCHW recovered from last year’s regional banking crisis; SCHW was impacted by similar financial issues. Unfortunately for SCHW, last week’s decline took the stock back to a loss for the year and created a second failed attempt to complete the recovery from last year’s collapse. I am on the fence on buying into the next rebound. A convincing close above $64 would nudge me closer to a buy.
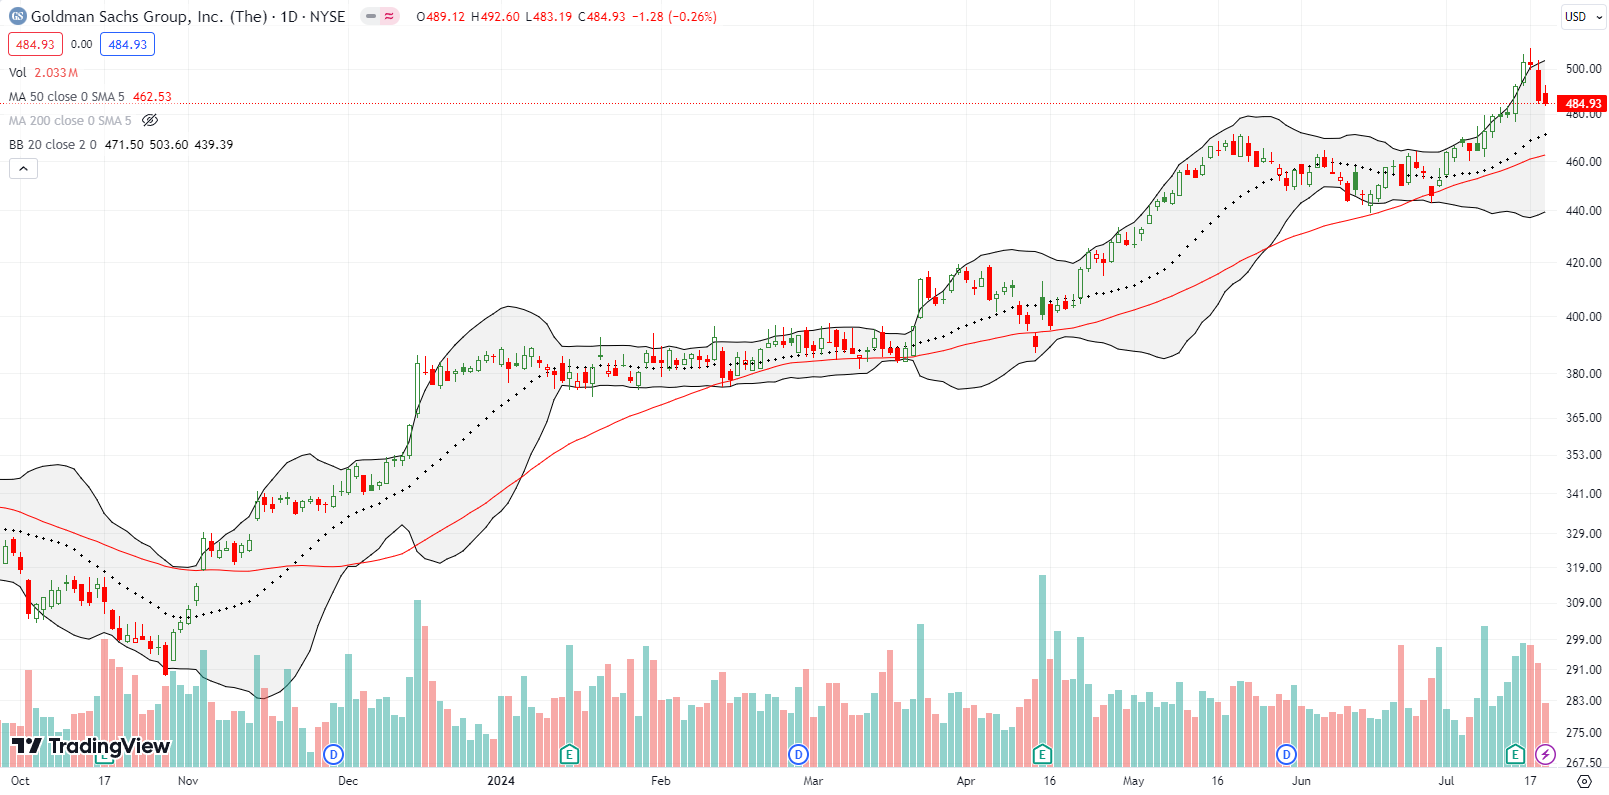
Goldman Sachs (GS) has helped lead the way for financials where stocks like SCHW and WFC are stumbling. GS started last week with a 2.6% post-earnings gain. Buyers celebrated one more day before sellers took over. Most of the post-earnings gains are gone, but GS looks well-positioned to resume its rally after a test of 20DMA or 50DMA support.
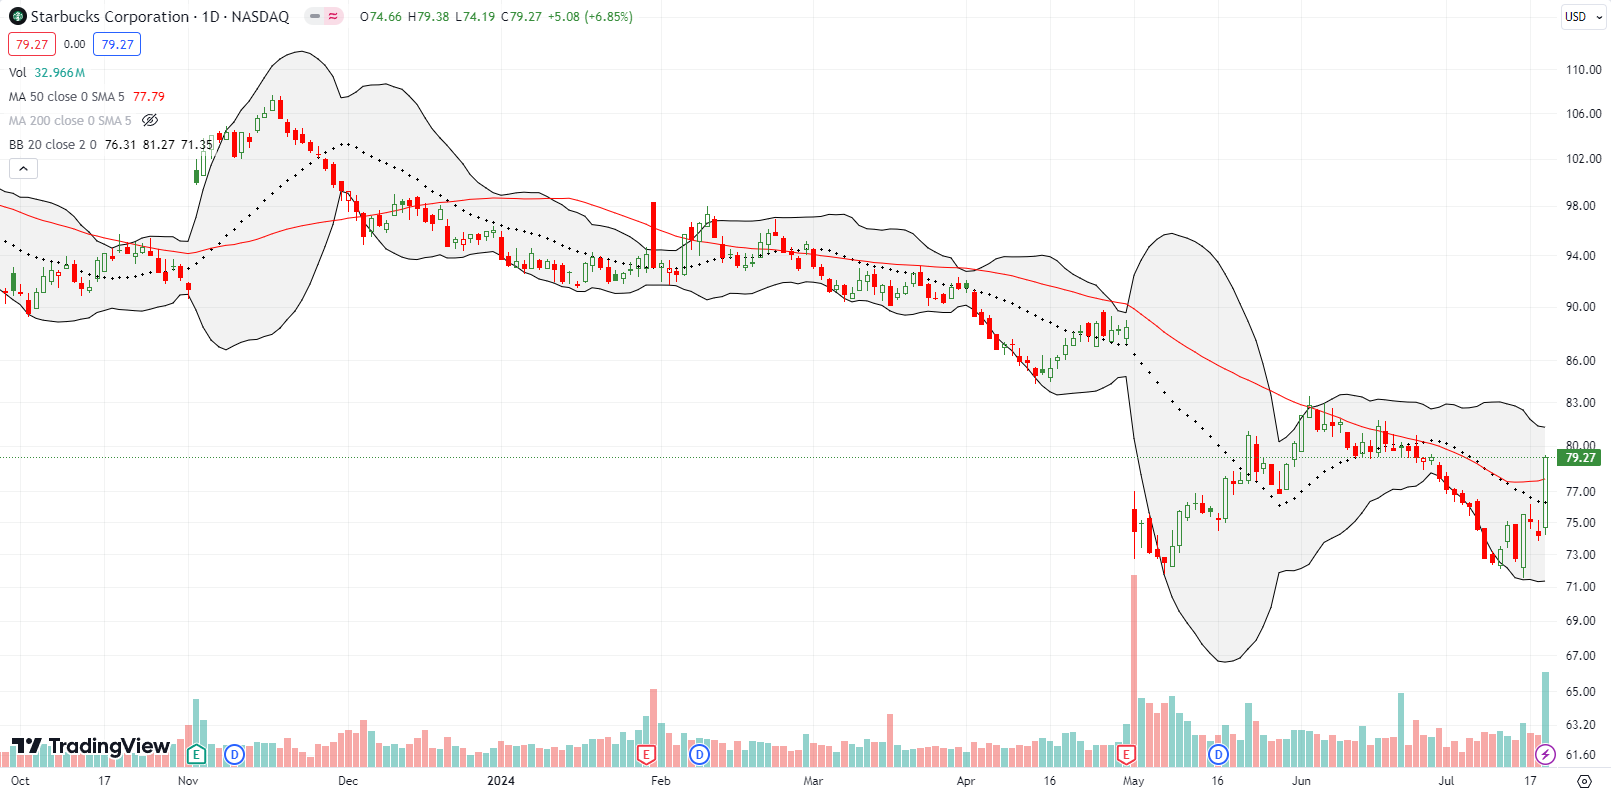
Starbucks Corporation (SBUX) was my biggest miss of the week. Buyers successfully defended the Cramer Bottom for Starbucks. A 3.8% surge on Tuesday seemed to confirm the bottom. Yet, I was oblivious until news dropped on Friday about a big stake by Elliot. SBUX surged 6% and closed above its 50DMA. SBUX is now an official buy on the dips from here…assuming the stock has truly bottomed out.
Be careful out there!
Footnotes
Subscribe for free to get email notifications of future posts!
“Above the 50” (AT50) uses the percentage of stocks trading above their respective 50-day moving averages (DMAs) to measure breadth in the stock market. Breadth defines the distribution of participation in a rally or sell-off. As a result, AT50 identifies extremes in market sentiment that are likely to reverse. Above the 50 is my alternative name for “MMFI” which is a symbol TradingView.com and other chart vendors use for this breadth indicator. Learn more about AT50 on my Market Breadth Resource Page. AT200, or MMTH, measures the percentage of stocks trading above their respective 200DMAs.
Active AT50 (MMFI) periods: Day #164 over 20%, Day #63 over 30%, Day #10 over 40%, Day #7 over 50%, Day #6 over 60% (overperiod), Day #2 under 70%
Source for charts unless otherwise noted: TradingView.com
Full disclosure: long SPY put spread, long QQQ put calendar spread, long DELL
FOLLOW Dr. Duru’s commentary on financial markets via StockTwits, Twitter, and even Instagram!
*Charting notes: Stock prices are not adjusted for dividends. Candlestick charts use hollow bodies: open candles indicate a close higher than the open, filled candles indicate an open higher than the close.


is it a good idea to hold DELL and MU or sell at this level- have a minimal loss
It depends on your risk tolerance and goals. I cannot give you a recommendation, but I can describe what I see. Both stocks are failures as short-term trades given the convincing closes below the 50-day moving average (the red line). They become interesting again on a close above the 50DMA or at much lower support levels with the general market in oversold conditions. For long-term, I still like DELL and am holding my shares (part of my generative AI basket). I have no opinion on MU for the longer-term.
makes sense. MU is the only US company which provides memory chips to other companies like Intel, NVDA- thats the only reason for being bullish hwoever the stock itself has many surprises