Stock Market Commentary
In Q2, the S&P 500 (SPY) enjoyed a 2-month rebound from an April sell-off. The index ended Q2 with a 3.9% gain. The stock market as a whole ended Q2 with a notable divergence in which market breadth, long maligned for the quarter, suddenly improved despite bearish topping patterns appearing on both the S&P 500 and the NASDAQ. The topping patterns are red flags, but the market has survived several red flags and many yellow flags this year. The potential for a bullish divergence after weeks and months of bearish divergences and similar close calls would be yet one more “escape” for the stock market.
The Stock Market Indices
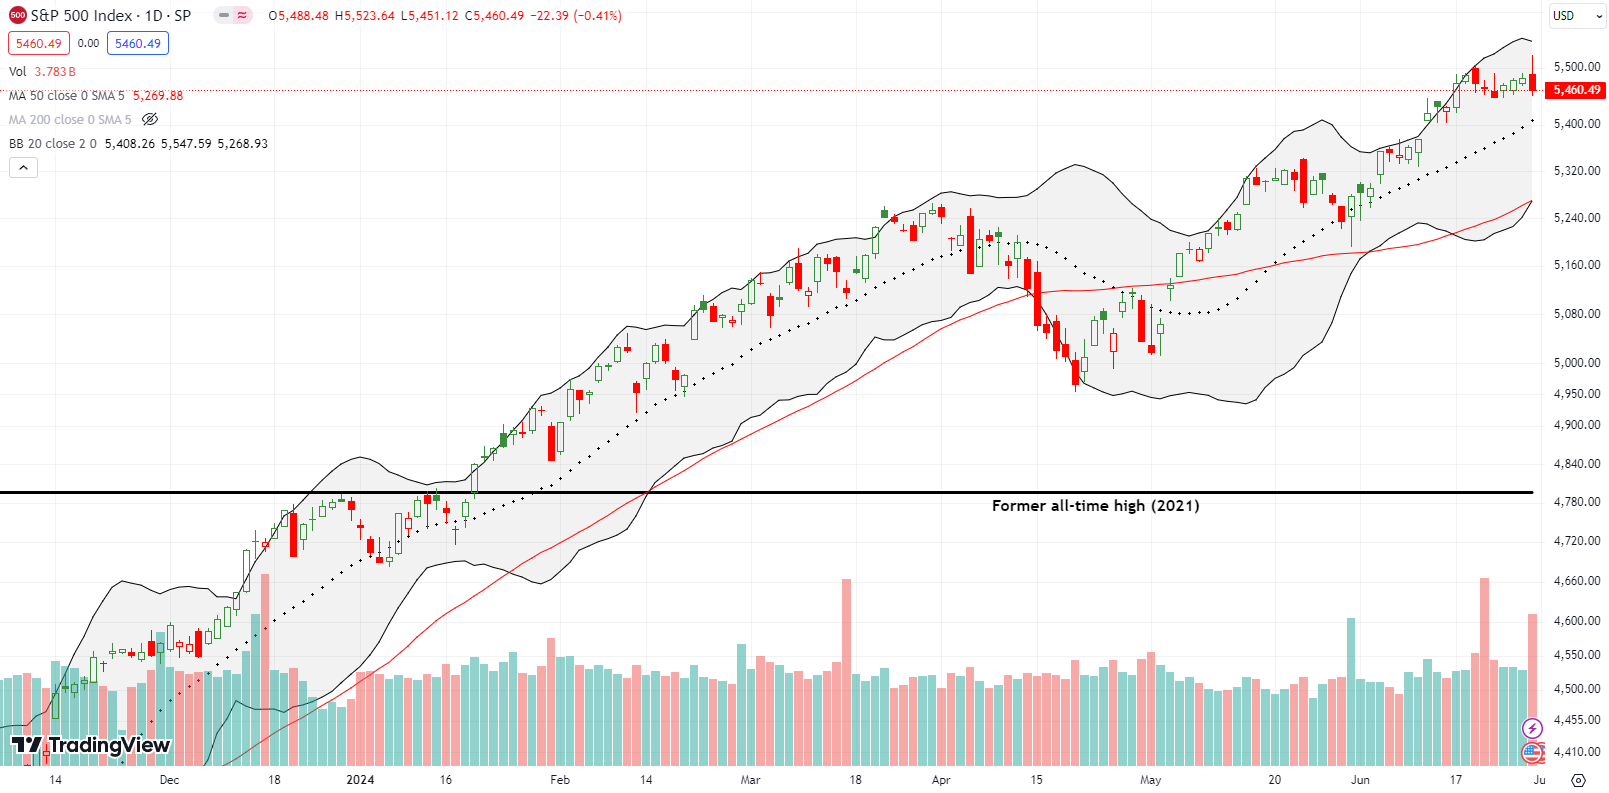
The S&P 500 (SPY) raced higher at Friday’s open as if buyers were rushing to get more stock on the books ahead of quarter end. After 45 minutes of buying, the tables turned sharply and sellers dominated the rest of the way. I never found a specific news item to try to explain the sudden change in heart.
Regardless, the reversal left the index with a bearish engulfing topping pattern. Normally, I would declare some kind of top in the S&P 500. However, buyers recently have so eagerly stepped into shallow dips that I cannot make such a call until, at a minimum, the index closes below the 20-day moving average (DMA) (the dashed line below). Moreover, market breadth improved for the day and set up a potential bullish divergence to counteract the bearish engulfing topping signal.
Because I am now habitually positioning hedges using the S&P 500, I managed to luck out with a quick flip on a weekly SPY put spread expiring in the coming week. The subsequent selling was sharp enough that the spread doubled in value ahead of the close. Per conventional rules in options trading, a quick double triggers profit-taking.
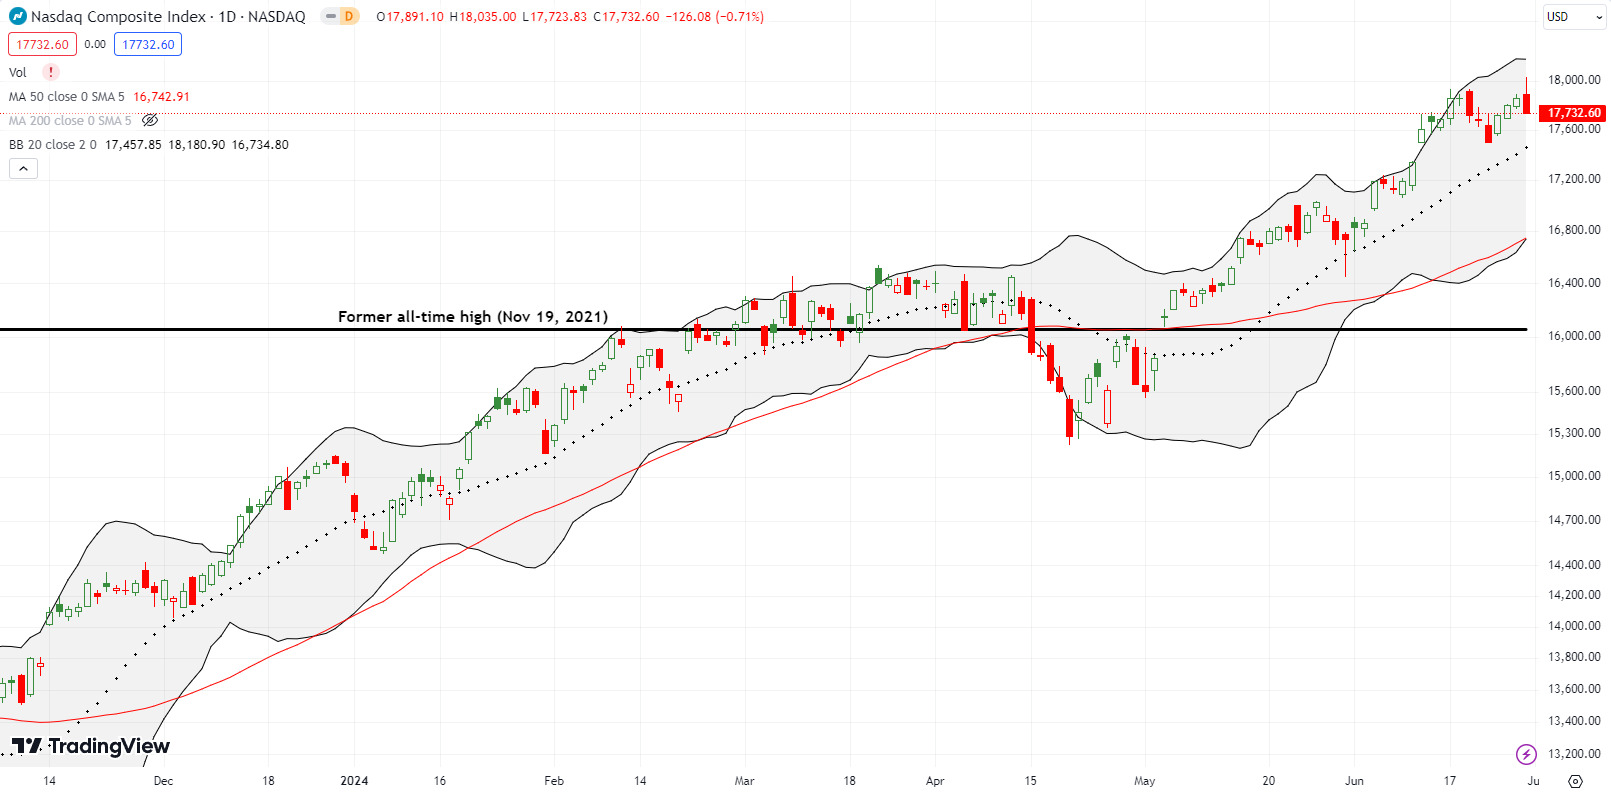
The NASDAQ (COMPQ) also printed a bearish engulfing after rushing to a fresh intraday all-time high. Unlike the S&P 500, I chased the QQQ and then added on the dip because of the bullish setup I pointed out in my last Market Breadth post. Technically, I should have triggered the trade on Thursday. Thus, I chased a little on Friday. Since my profits on the S&P 500 put options mostly paid for the QQQ call spreads, I am good watching how things unfold in the coming week.
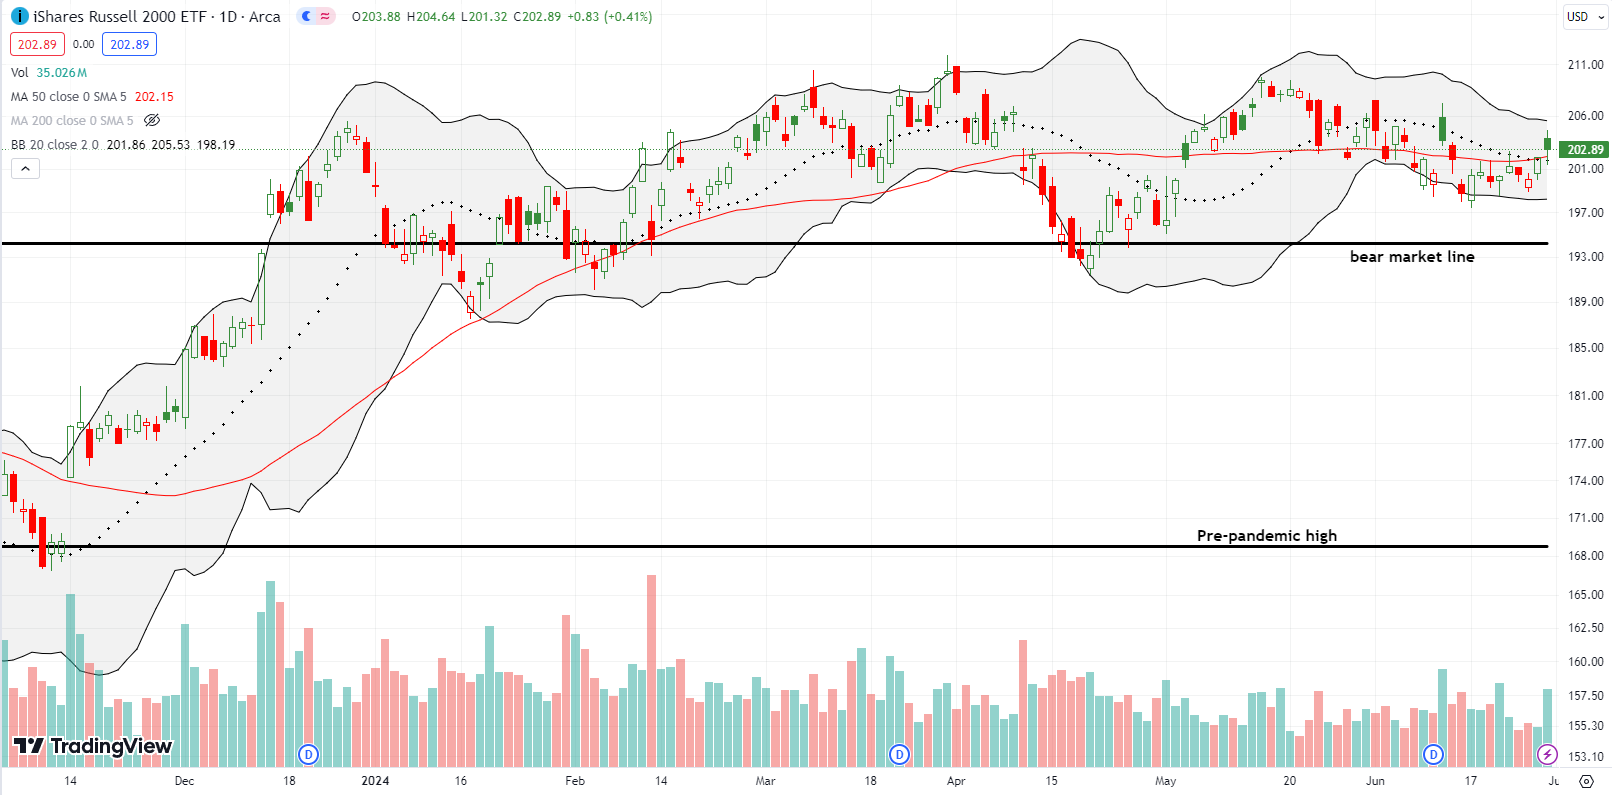
The iShares Russell 2000 ETF (IWM) actually outperformed on Friday. Not only did the ETF of small caps pull out a small gain while the S&P 500 and the NASDAQ reversed into bearish engulfing topping patterns, but also IWM pushed its way into a combined 20DMA and 50DMA (the red line below) breakout. Still, these two trendlines remain pivots until proven otherwise. In the meantime, IWM helped boost market breadth and create the bullish divergence against the S&P 500 (and the NASDAQ).
The Short-Term Trading Call With A Notable Divergence
- AT50 (MMFI) = 44.7% of stocks are trading above their respective 50-day moving averages
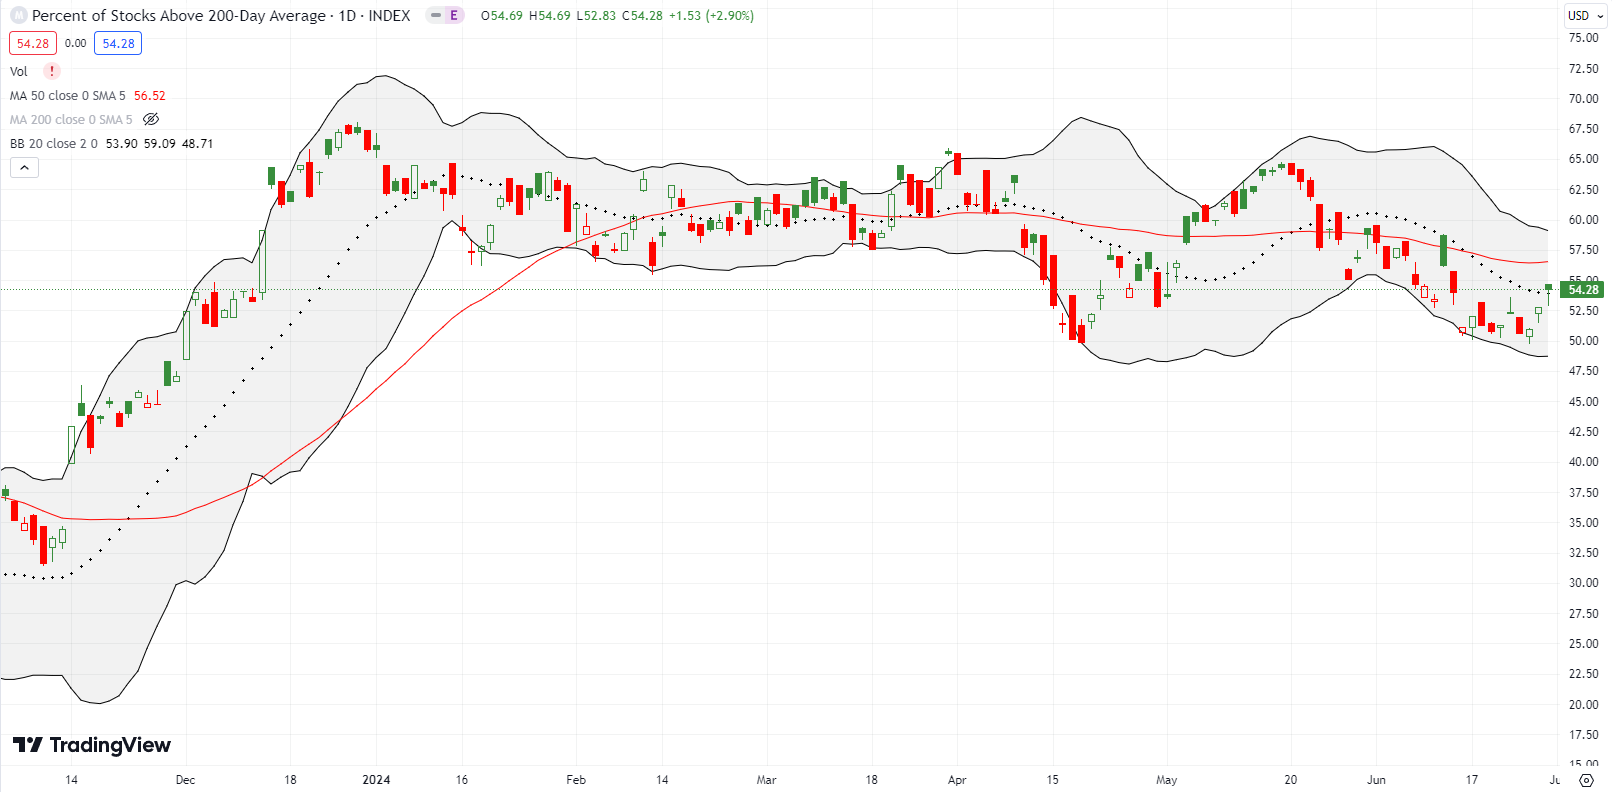
- AT200 (MMTH) = 54.3% of stocks are trading above their respective 200-day moving averages
- Short-term Trading Call: neutral
AT50 (MMFI), the percentage of stocks trading above their respective 50DMAs, recorded a small gain for the week after dropping close to a 2-month low in the middle of the week. Suddenly, the stock market went from a bearish divergence too strong to ignore to a notable divergence that nearly looks bullish. Until proven otherwise, I am assuming the market is now stuck in a tug of war between the big cap tech stocks and the rest of the market. The two sides are vying for investor funds and attention, and the news cycles are sloshing preferences around. Yet, given the S&P 500 and the NASDAQ recorded bearish engulfing topping patterns, my short-term trading call cannot move to some flavor of bullish. A neutral call still feels like the proper balance.
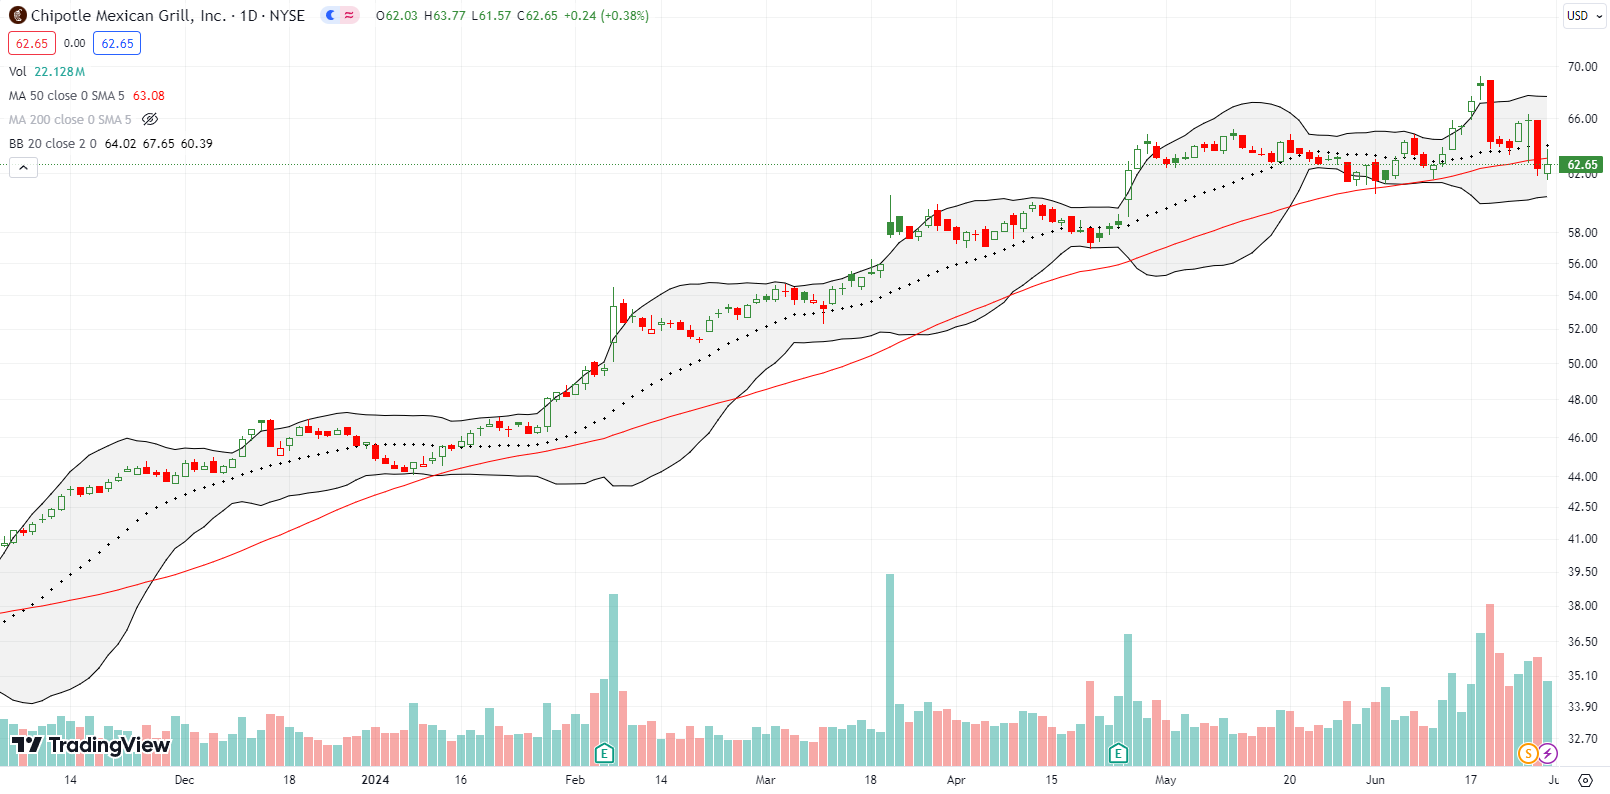
Chipotle Mexican Grill, Inc (CMG) experienced a notable divergence from its near automatic uptrend. The current narrative begins with the announcement of a 50:1 stock split on March 19, 2024. The stock gapped up 3.5% the next day. The stock churned from there until April earnings pushed the stock to a new all-time high. A Goldman Sachs (GS) initiated a buy rating on June 13th, an action which in turn ignited fresh excitement. CMG subsequently went parabolic with 4 straight closes above its upper Bollinger Band (BB) before a sudden 6.2% reversal eliminated all the Goldman gains in one fell swoop.
Buyers tried to proceed as usual by defending 20DMA support but sellers returned with a vengeance with a sub-50DMA close for the first time since November. A close lower that breaks below the previous lows (which successfully tested 50DMA support) will push this market darling into a bearish technical setup.
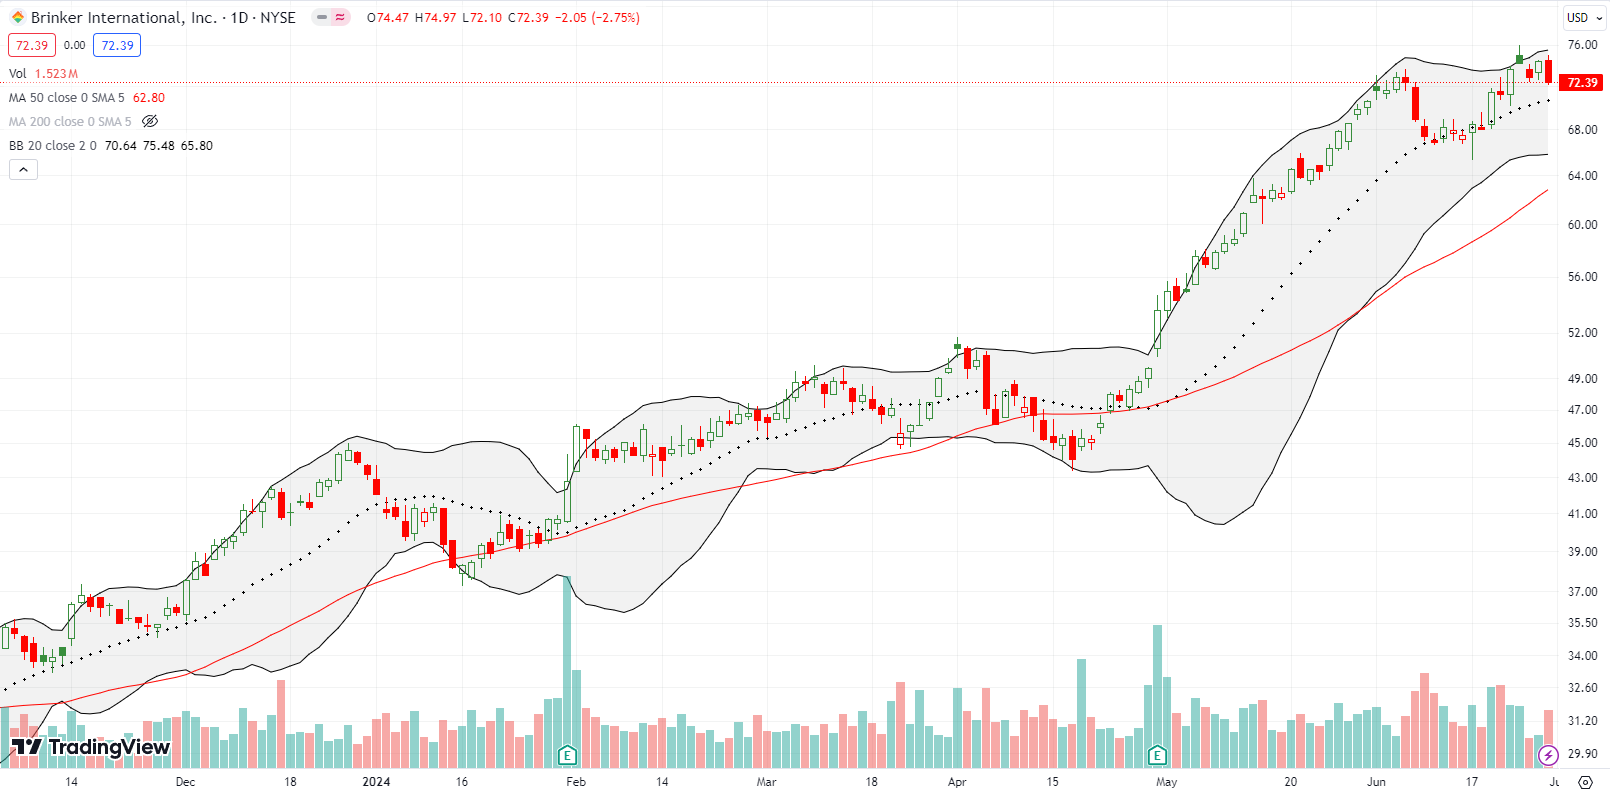
There is a lot of talk about the value menu wars in fast food. Meanwhile, a notable divergence has unfolded in the (fast) casual dining space. CMG has not soared alone. Brinker International, Inc (EAT), which I pointed out as a bullish, buy-the-dips play back in February, acts like a sector winner. Last week the stock almost tested all-time highs. While I took profits a while back in EAT, the stock still looks like a buy on dips.
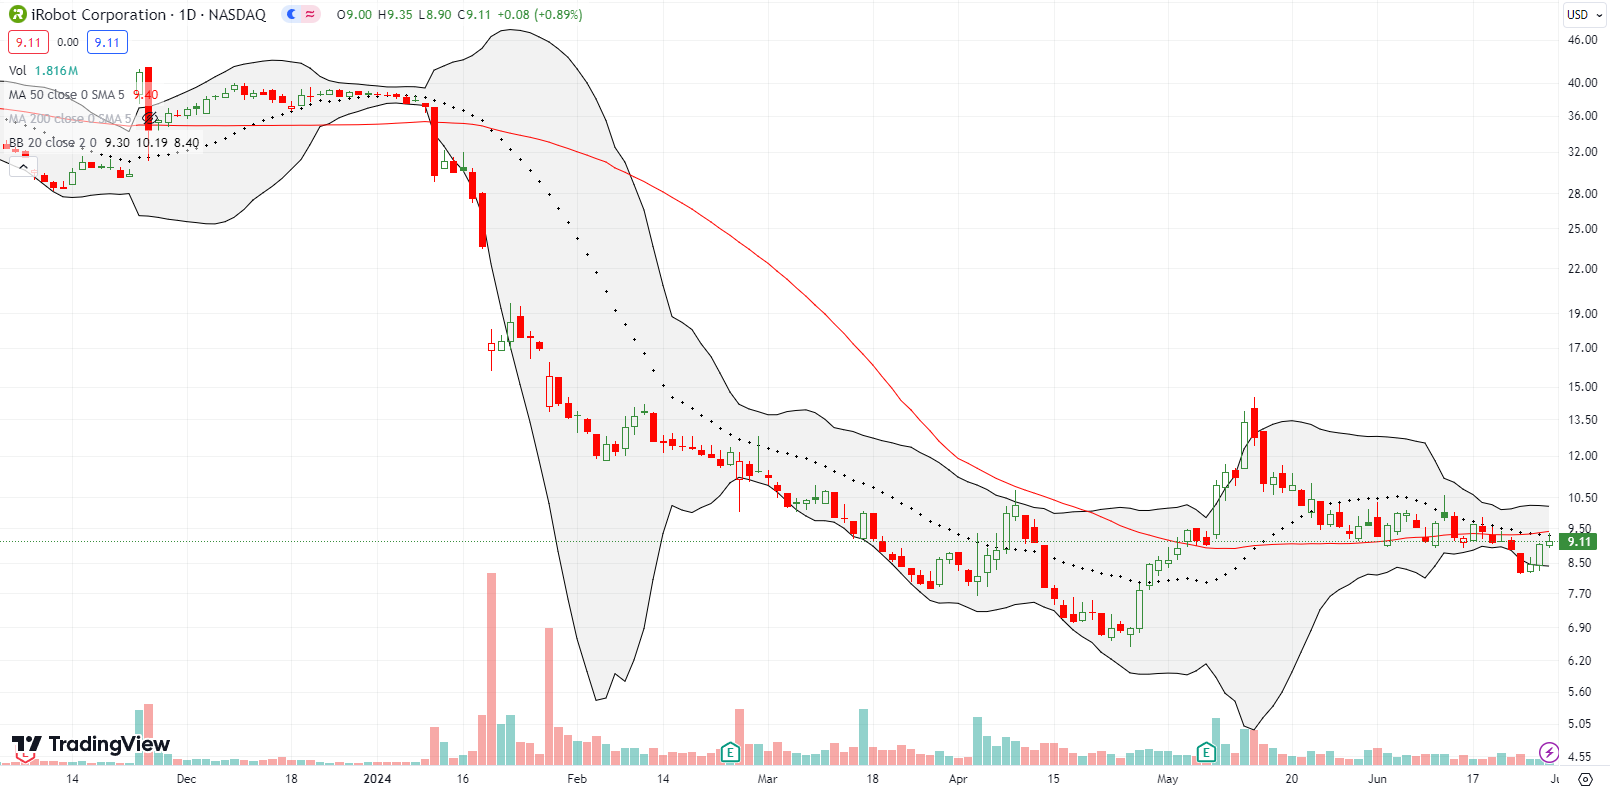
A month ago I made the case for a bottoming in iRobot Corporation (IRBT). The stock never quite separated from 50DMA support, but I dove in anyway. IRBT slowly churned its way into a fresh 50DMA breakdown, and I bailed. The strong finish to last week’s trading puts IRBT back on my radar for a buy. A close above the 50DMA gets me back in with a (final) stop below the last lows.
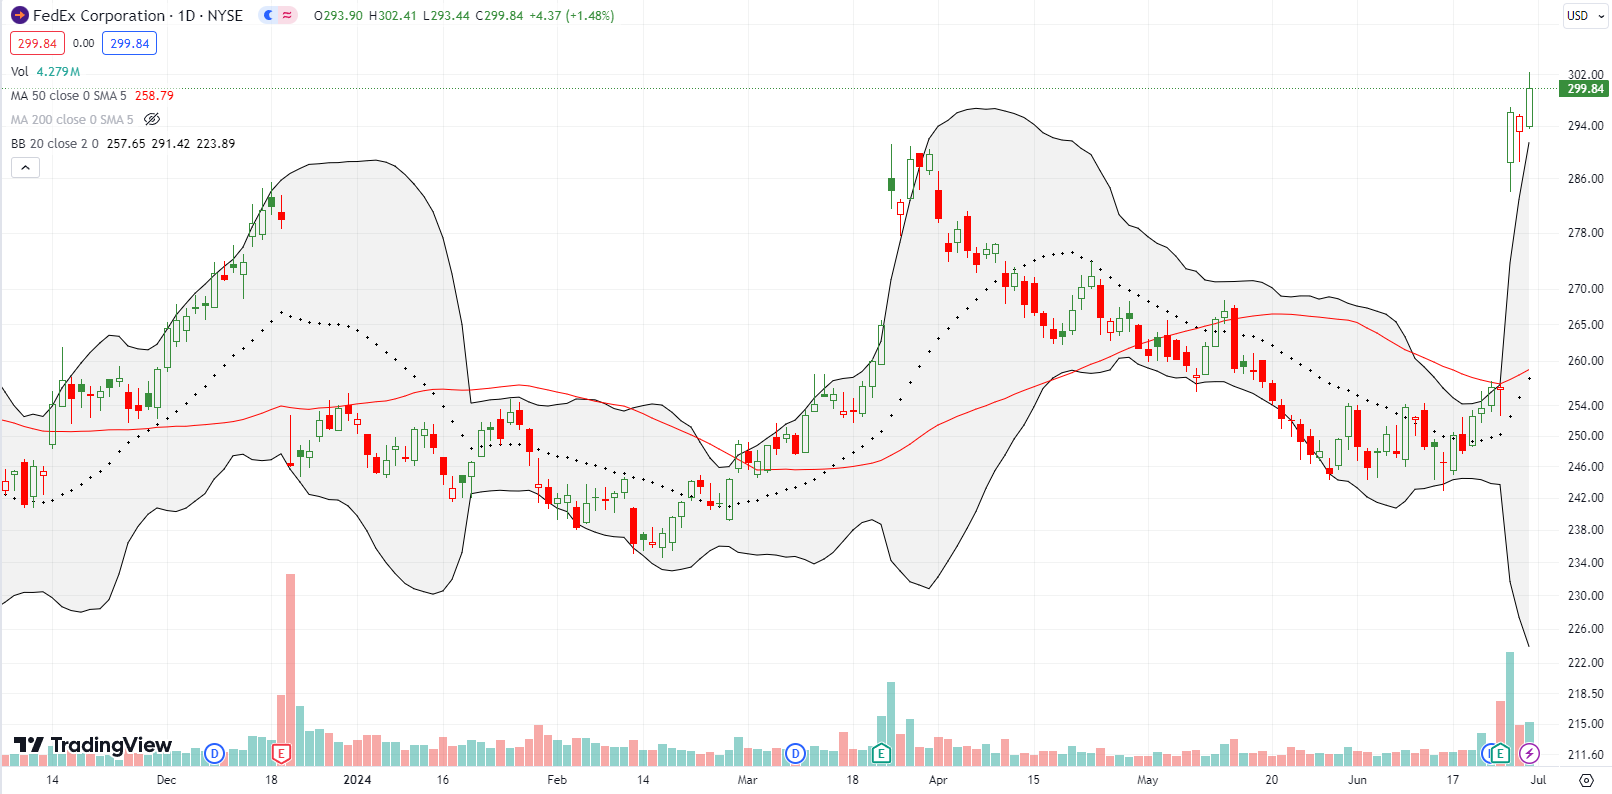
FedEx Corporation (FDX) sure has been one manic stock for almost a year. Investors clearly do not know what to make of the company’s prospects. The chart below tells the story of a stock swinging wildly between earnings (see the “E” in the x-axis). FDX gave up all its post-earnings gains from March, and then some, only to soar last week with a 15.5% post-earnings to a 2-year high. I would like to think investors have finally resolved to think well of FDX here. If so, FDX is a buy on the dips with a stop-loss after a post-earnings intraday low.
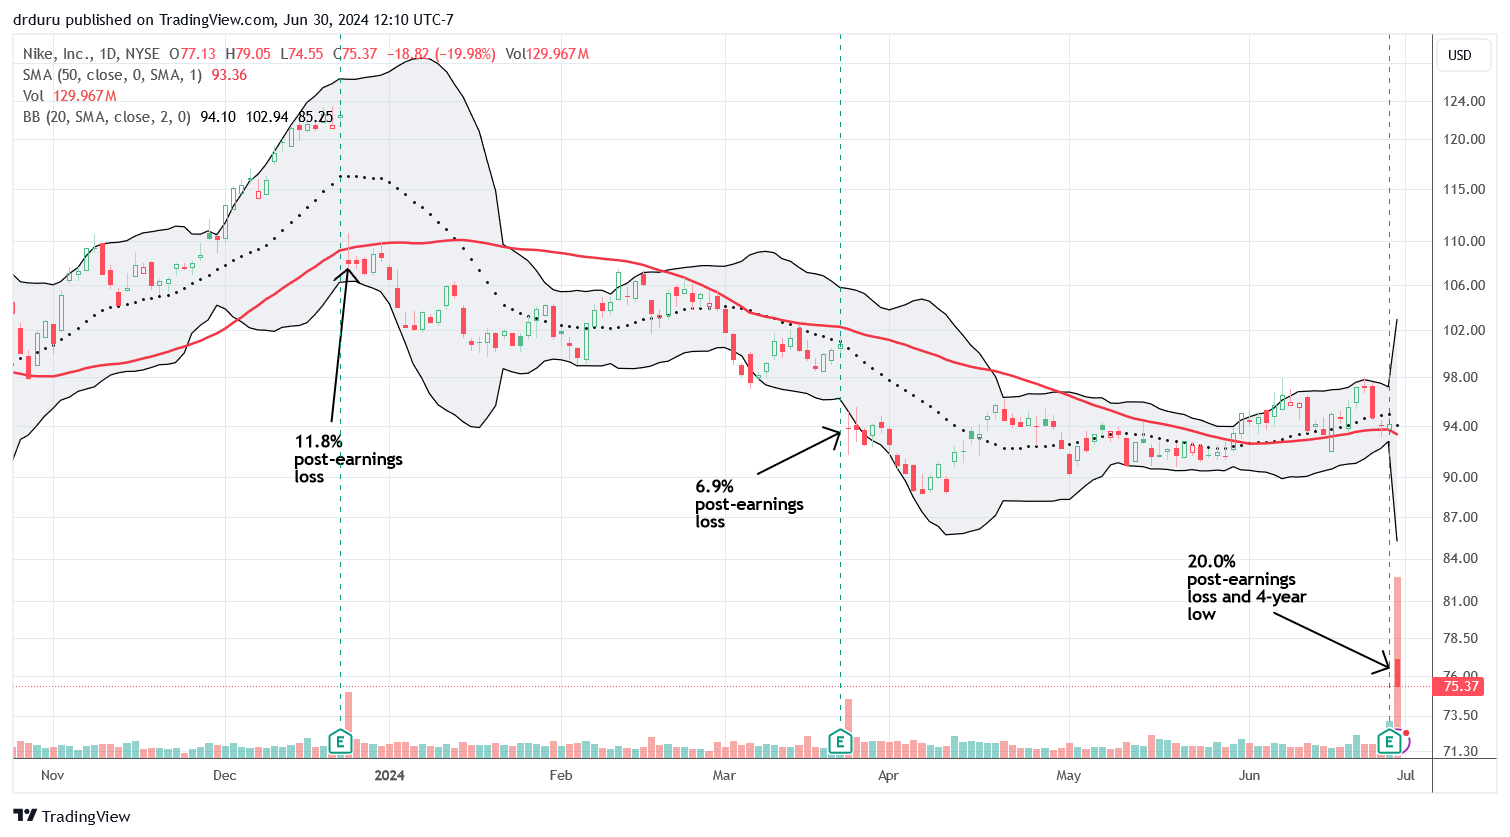
Investors have been quite clear about Nike, Inc (NKE) all year. NKE came into 2024 having just suffered a big post-earnings setback. The stock never recovered before the next post-earnings setback. NKE actually looked ready to rebound going into its latest earnings. The upturn in the 50DMA fooled me into buying a July call spread ahead of earnings (it was not technically a pre-earnings trade, just an expectation that NKE had finally turned the corner). NKE put an exclamation point on a Q2 ending with a notable divergence. This iconic brand suffered its biggest one-day loss EVER (that’s a 44-year history of trading!) with a 20.0% plunge to prices last seen in the immediate wake of the pandemic. Needless to say, this move looks like extreme panic. I will try a fresh buy on a post-earnings high.
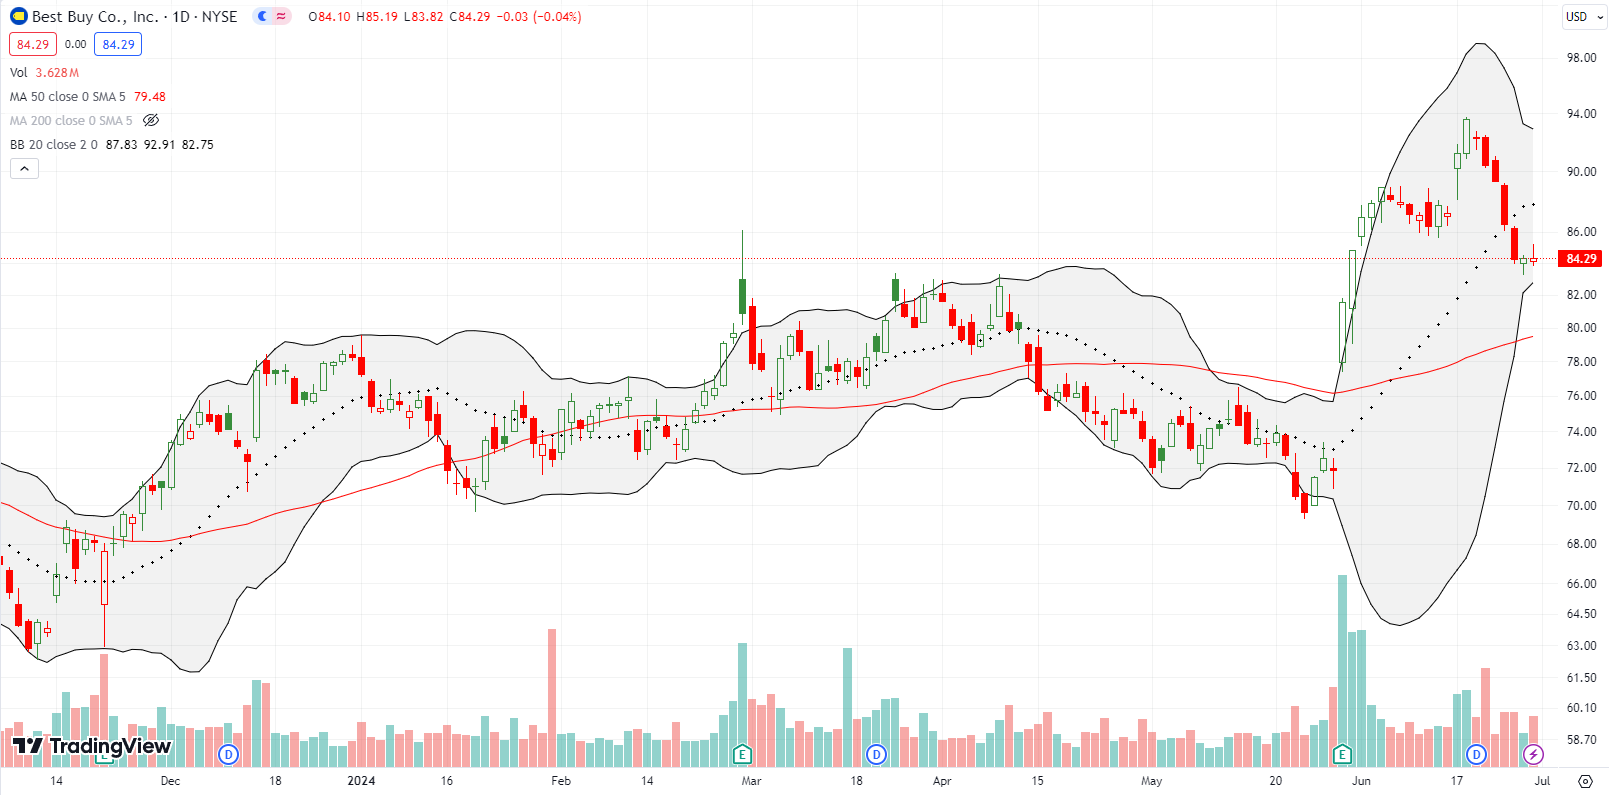
Best Buy Co, Inc (BBY) started the month with surprising post-earnings strength. Even with all the talk of a slowing consumer, BBY managed to rally to $94 and a 2-year high. Along the way I sold a $90 call option against my position and watched it get called away. I do not know why sentiment slipped sharply into reverse the last week and a half, but I took advantage of the lower prices to restart accumulating shares.
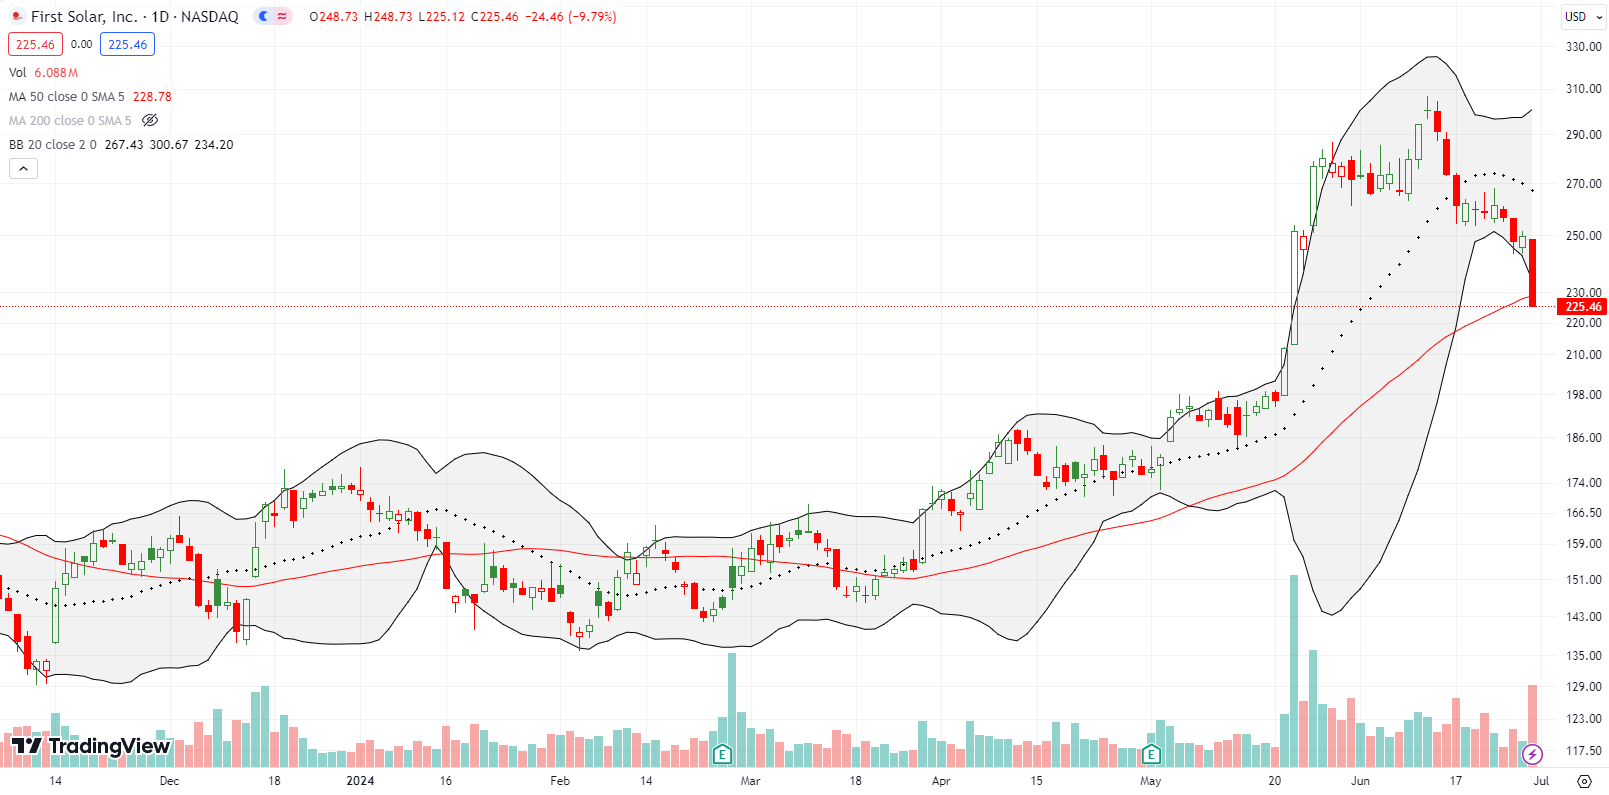
Speaking of slipping into reverse, First Solar, Inc (FSLR) sold off the last half of June ending the month and Q2 with a 10% plunge into a 50DMA breakdown. FSLR is practically the last solar play standing as one solar stock after another has suffered massive post-earnings losses. The Invesco Solar ETF (TAN) ended the quarter near its low for the year which in turn is a 4-year low. I am now very wary of FSLR.
Over a year ago, I lamented missing out on the FSLR rally up to that point. Selling ensued shortly thereafter and gave me opportunities to buy. I had to patiently wait on the next upward push. After FSLR “survived” May earnings, I decided to take profits…and found myself lamenting all over again as the stock went parabolic a little over a week later. Fortunately, I sat on my hands and did not chase price higher.
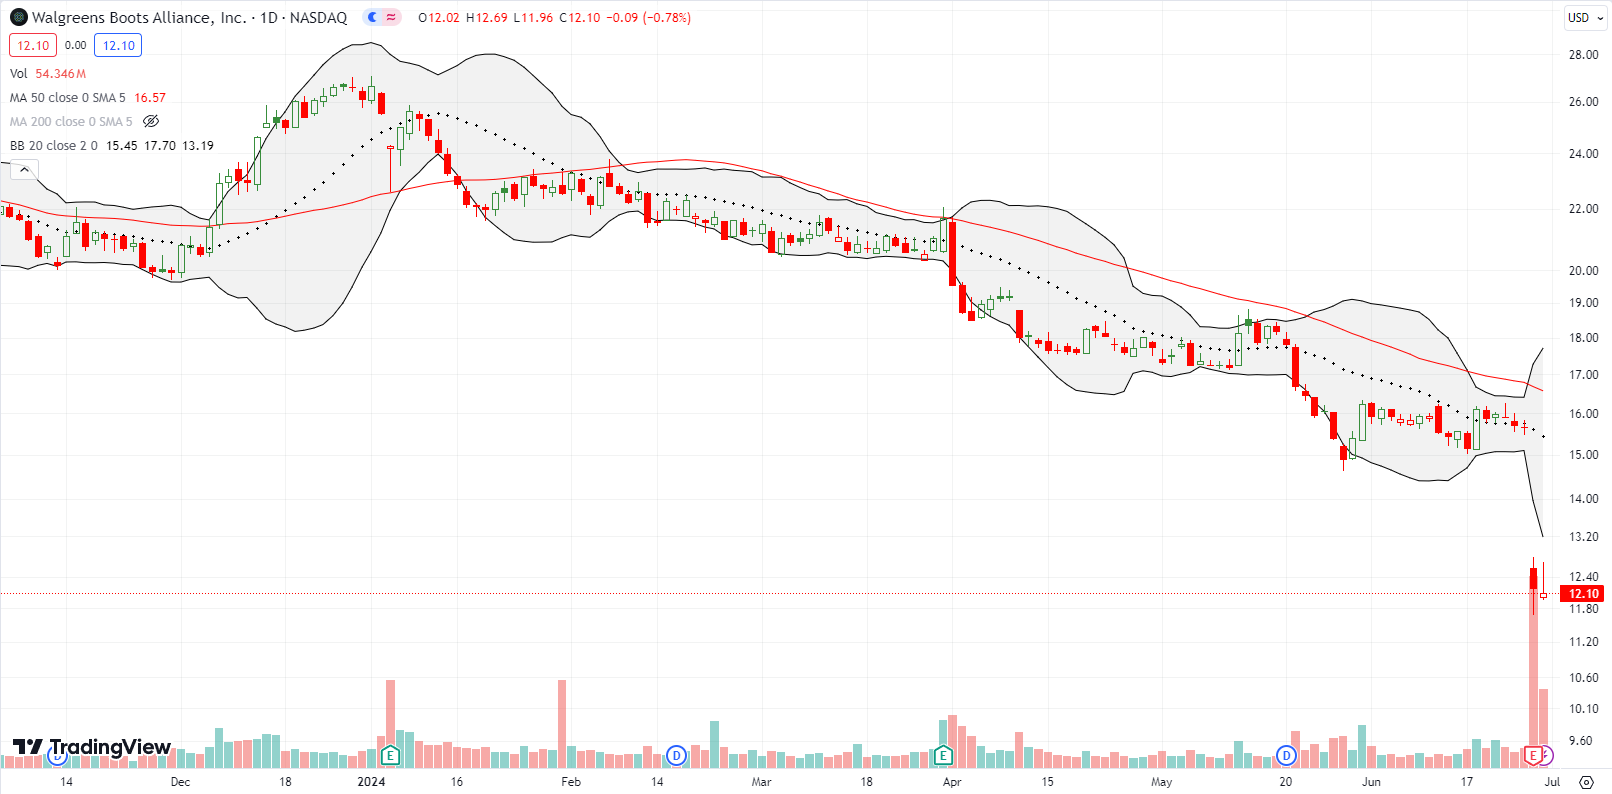
In early 2021, I dropped my bearish bias on Walgreens Boots Alliance, Inc (WBA) and soon started accumulating shares for my long-term dividend portfolio. Big mistake. Because my dividend payers are long-term, I am more tolerant of downside moves. Roll the tape to early 2024, and I finally had enough. WBA ended 2023 on a strong note only to break down below its 50DMA again. I dumped the entire position. The chart below shows WBA never recovered. Last week’s 22% post-earnings loss took WBA to a 27-year low. Needless to say, this was yet another episode that reminded me of the importance of technicals…even for long-term investments. The long-term chart shows a stock trapped in a 6-9 year downtrend (depending on your perspective). Talk about a notable divergence (from the S&P 500)!
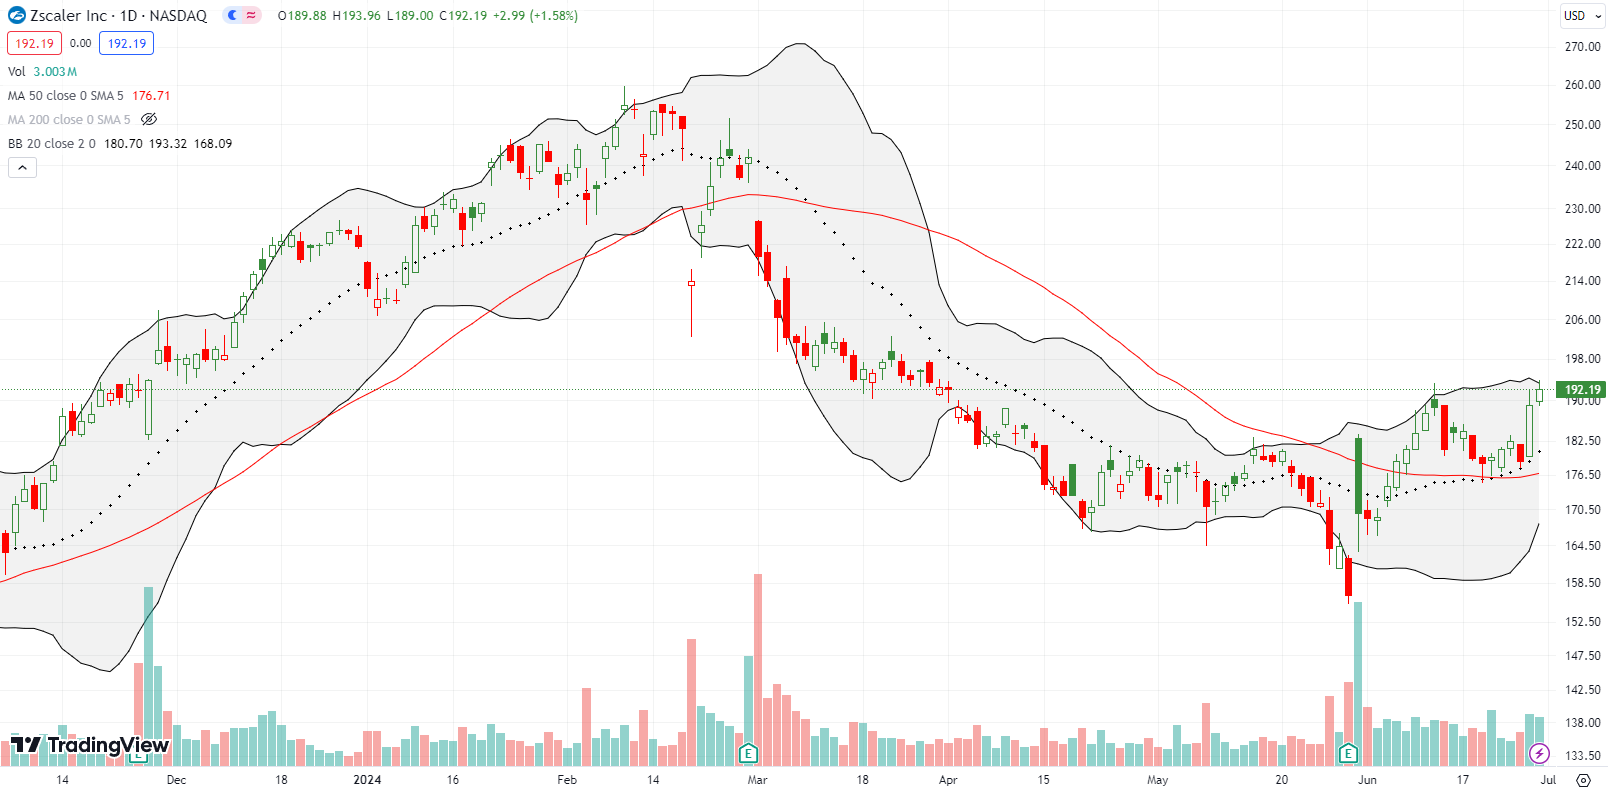
Cloud security software company Zscaler Inc (ZS) ended Q2 on a strong note. The stock held support at its converged 20DMA and 50DMA. I bought stock a little early and just ahead of that test. Like ASAN and PD, I bought ZS in anticipation of a resumption/continuation of post-earnings momentum.
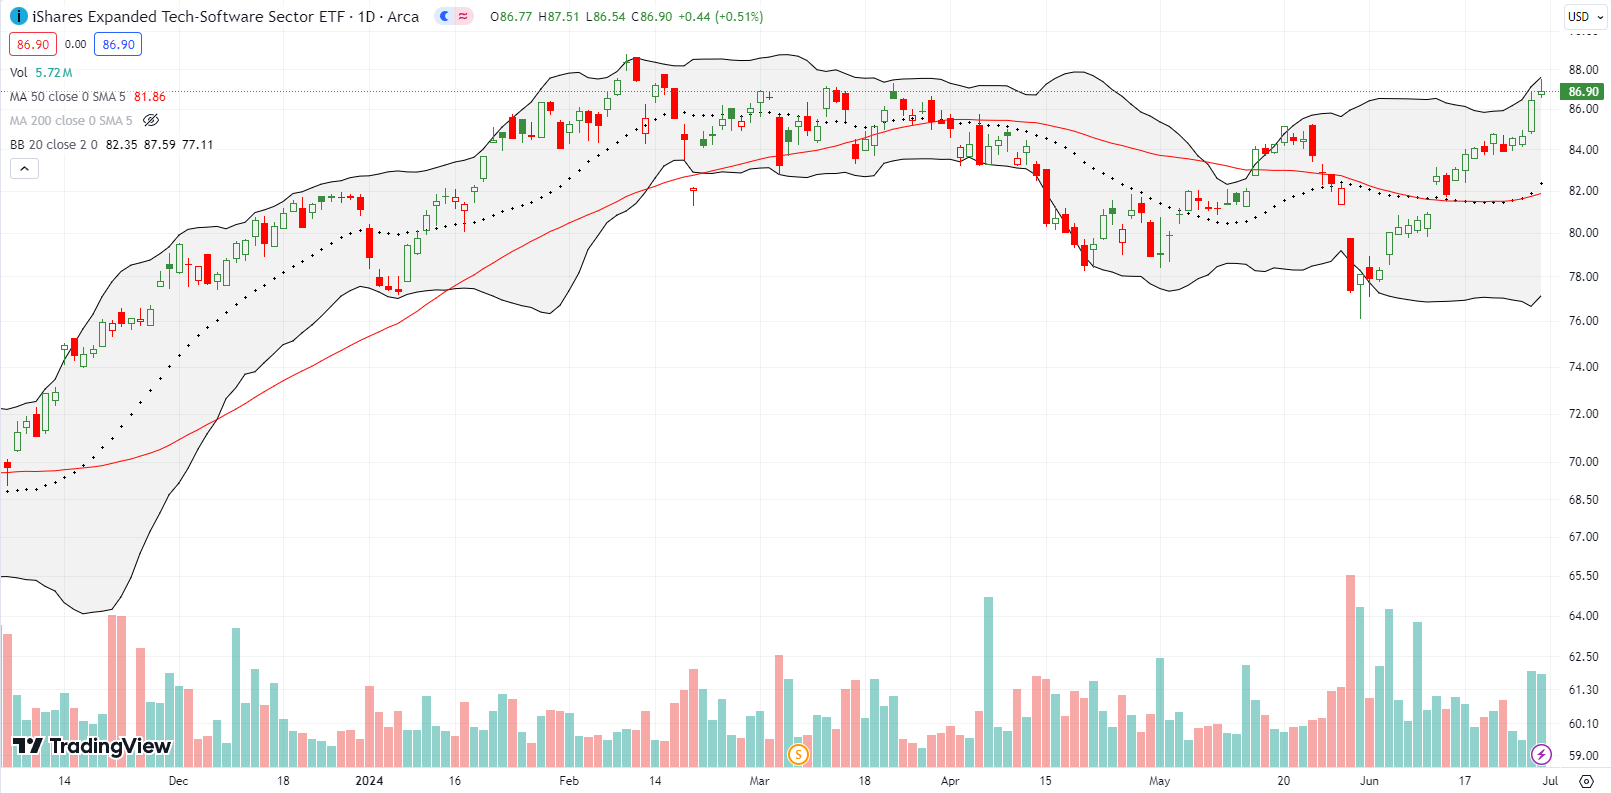
June saved the quarter for a lot of software companies. The iShares Expanded Tech-Software Sector ETF (IGV) ended May with a CRM-induced drop to a low of the year. IGV gained 11.3% for the month of June and stopped just short of a new all-time high. This sharp rebound has me respecting the bullish implications for Q2’s notable divergence.
Be careful out there!
Footnotes
Subscribe for free to get email notifications of future posts!
“Above the 50” (AT50) uses the percentage of stocks trading above their respective 50-day moving averages (DMAs) to measure breadth in the stock market. Breadth defines the distribution of participation in a rally or sell-off. As a result, AT50 identifies extremes in market sentiment that are likely to reverse. Above the 50 is my alternative name for “MMFI” which is a symbol TradingView.com and other chart vendors use for this breadth indicator. Learn more about AT50 on my Market Breadth Resource Page. AT200, or MMTH, measures the percentage of stocks trading above their respective 200DMAs.
Active AT50 (MMFI) periods: Day #150 over 20%, Day #49 over 30%, Day #1 over 40% (overperiod ending 2 days under 40%), Day #19 under 50%, Day #28 under 60%, Day #117 under 70%
Source for charts unless otherwise noted: TradingView.com
Full disclosure: long QQQ call spreads, long SPY put spread, long ZS, long BBY
FOLLOW Dr. Duru’s commentary on financial markets via StockTwits, Twitter, and even Instagram!
*Charting notes: Stock prices are not adjusted for dividends. Candlestick charts use hollow bodies: open candles indicate a close higher than the open, filled candles indicate an open higher than the close.


