FactSet’s John Butters laid out a case for the “Magnificent Seven” companies losing the majority of their earnings growth dominance by the end of the year. In “Are the ‘Magnificent 7’ the Top Contributors to Earnings Growth for the S&P 500 for Q1?“, Butters showed how analyst expectations for year-over-year earnings growth for the top 5 of the Magnificent 7 – Amazon.com (AMZN), Alphabet, Inc (GOOG), Meta Platforms (META), Microsoft (MSFT), and NVIDIA Corporation (NVDA) – shift from 64.3% in Q1 down to 19.8% in Q4. Meanwhile, the remaining 495 companies in the S&P 500 (SPY) trend upward from -6.0% in Q1 to 17.3% in Q4. While the big boys will still enjoy higher earnings growth (minus Tesla (TSLA) and Apple (AAPL)), the message in the trends favors healthier market breadth and more solid rallies for the S&P 500 as the year unfolds.
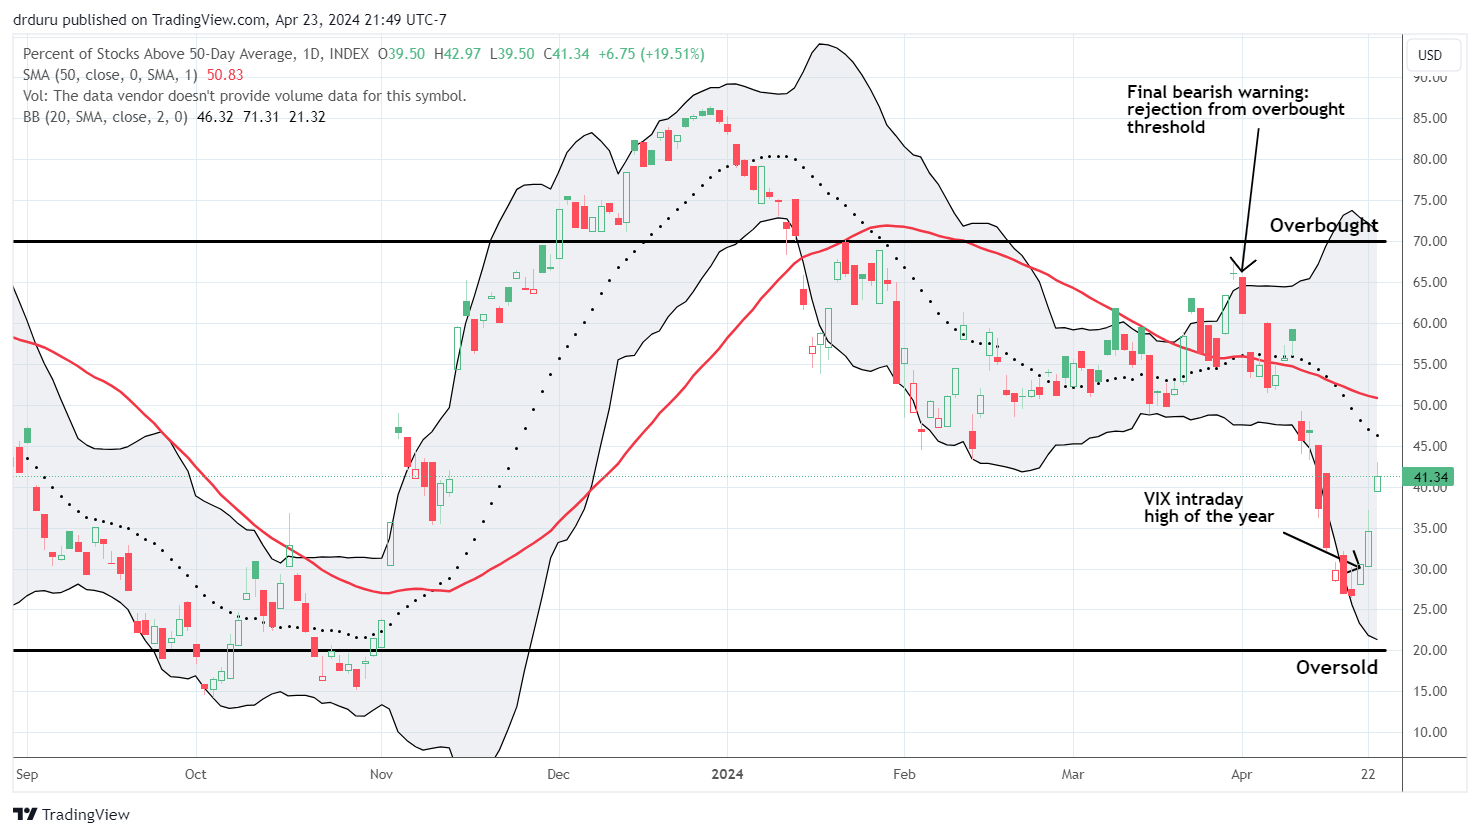
With earnings growth trending downward, the big cap tech stocks could even remain in or close to topping patterns through much of the year while the S&P 500 grinds its way higher (see NVDA as a potential ground zero for topping action). Underneath the surface, market breadth should have an upward bias or even trend higher. Any oversold conditions should last the typical 1 to 2 days. I measure market breadth with AT50 (MMFI), the percentage of stocks trading above their 50-day moving averages (DMAs). My favorite technical indicator may already be showing off its resilience with a sharp bounce away from the oversold threshold at 20%. This rebound confirmed an “oversold enough” condition created by a bullish divergence.

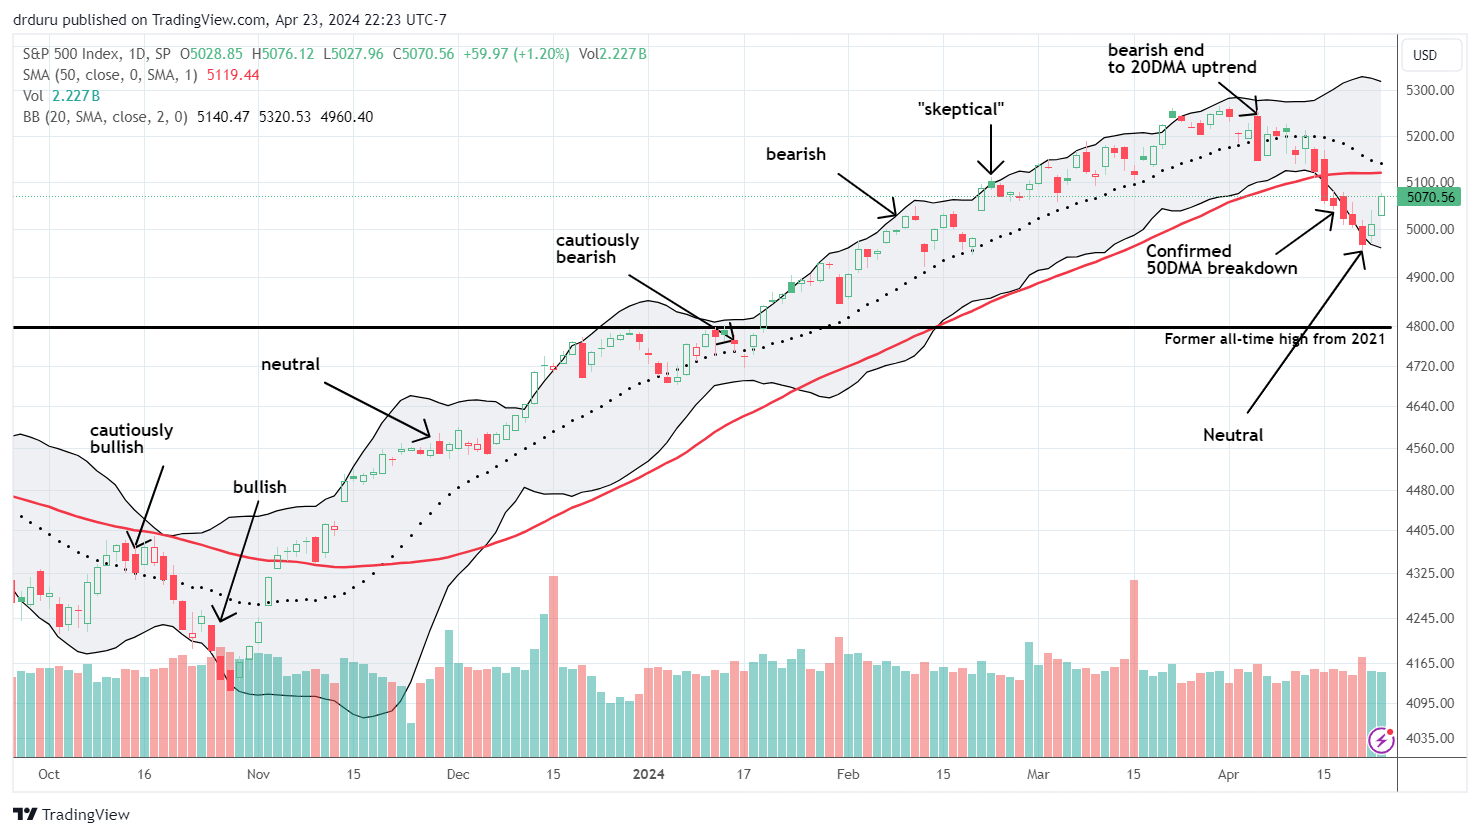
Of course, these dynamics are predicated on analysts making relatively accurate earnings growth forecasts, a tough task given the swirl of monetary policy, expanding geopolitical tensions, and a contentious Presidential election year. Fortunately, the technicals surrounding market breadth should continue to provide a sufficient guide to making short-term trading calls. My short-term trading call will stay at neutral until the next major pricing milestone:
- Bullish: the S&P 500 breaks out above 50DMA resistance.
- Bearish: the S&P 500 fails at 50DMA resistance.
- Bullish: the S&P 500 drops into oversold territory with AT50 below 20%.
For more on these rules see “How to Trade Extremes In Market Breadth (AT50, formerly T2108)“.

Be careful out there!
Full disclosure: long AAPL call spread
