Stock Market Commentary:
Riddle me this. How many months does it take for a “lagging indicator” to reflect reality? The labor market has defied expectations almost all year, and during most of that time it seems like too many pundits have dismissed the data as a lagging indicator of some long lost economic reality. The unemployment data are particularly hard to reconcile with the two straight quarters of negative GDP growth that was supposed to deliver the recession Wall Street wants. The September jobs numbers once again suggested U.S. employment remains strong and resilient for the time being. Accordingly, the jobs report brought the stock market back to the reality of a Federal Reserve that will stay the course on monetary tightening…and that reality swept the stock market off its recent sugar high. We find ourselves once again dealing with a tricky oversold trading period.
The Stock Market Indices
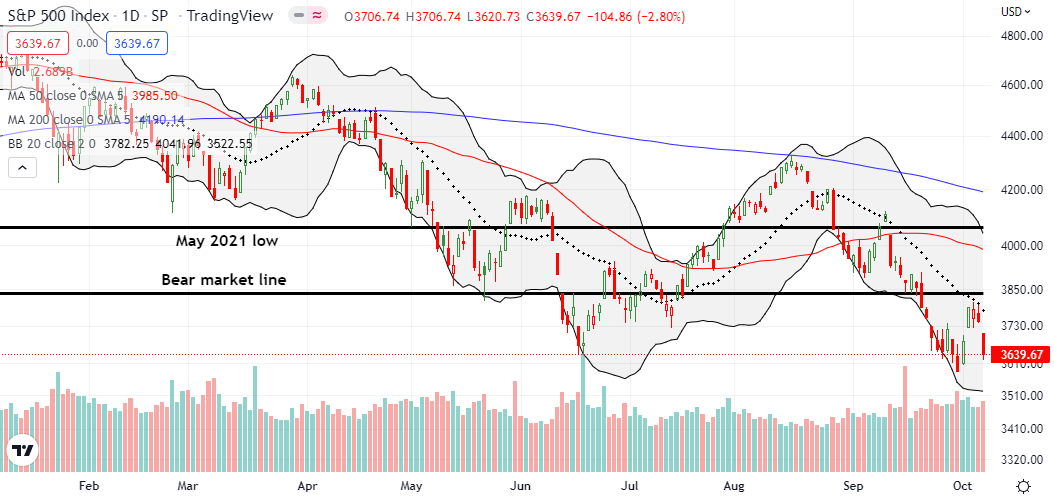
The S&P 500 (SPY) lost 2.7% and closed below its former 2022 low from June. The index met stiff resistance at its declining 20-day moving average (DMA) (the dotted line in the chart) and failed to challenge the nearby bear market line. Recall that I earlier described the test all the indices faced at their respective declining 20DMs. Now the S&P 500 looks ready to test the near 2-year low that also defined a critical test of support at the 200-week moving average just ahead of the stock market’s sugar high.
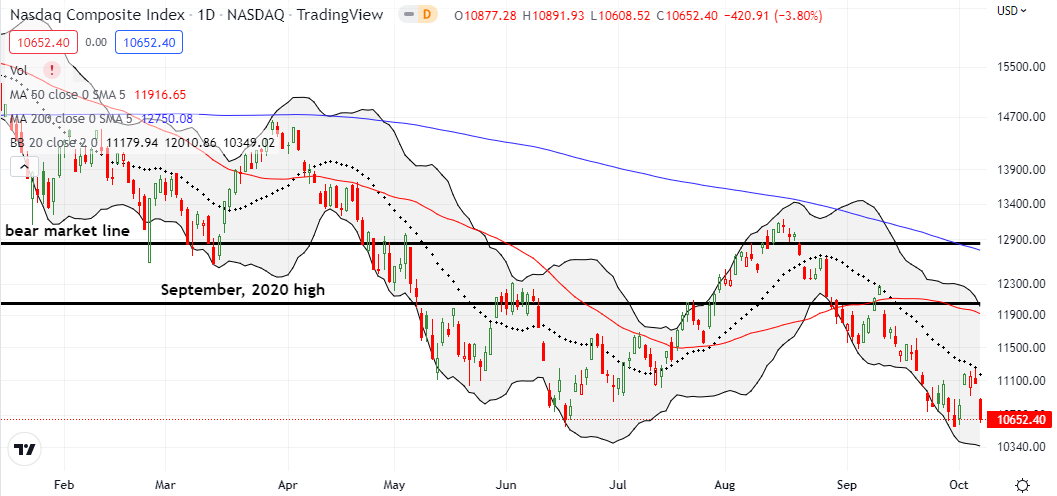
The NASDAQ (COMPQ) lost even more than the S&P 500 with a 3.8% decline. The tech-laden index managed to close at its June low, but the NASDAQ also looks set to slip right by its 27-month low. The remaining pandemic-era gains are at even greater risk for the NASDAQ than the S&P 500.
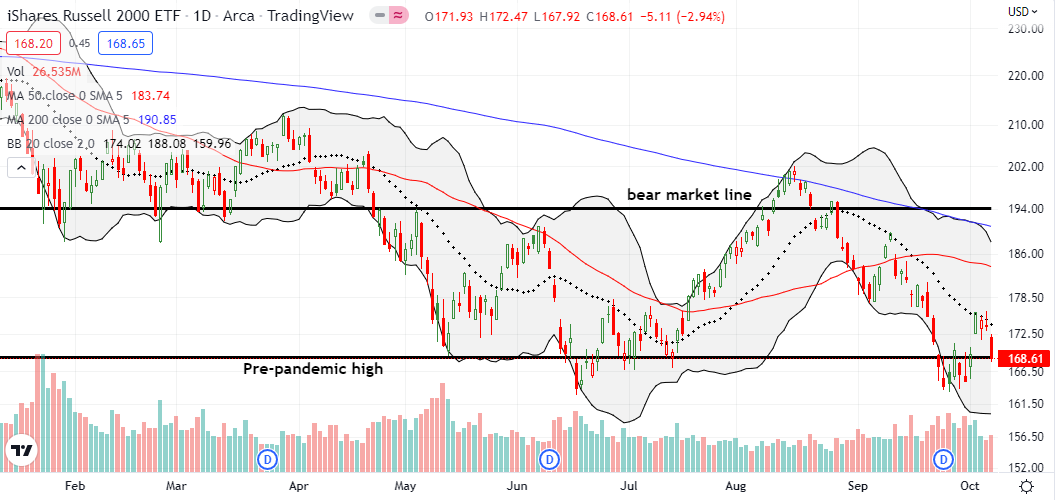
The iShares Russell 2000 ETF (IWM) lost 2.9% and dropped back to its pre-pandemic high again. With the return of oversold conditions and the VIX on the move (see below), I decided to add an IWM call spread to my existing calendar call spread. I am looking for a rebound back to 20DMA resistance in the next two weeks. While IWM is under-performing the S&P 500 and the NASDAQ relative to pandemic-era gains, IWM is slightly out-performing since the September lows. Thus, IWM sits atop my oversold shopping list.
Stock Market Volatility
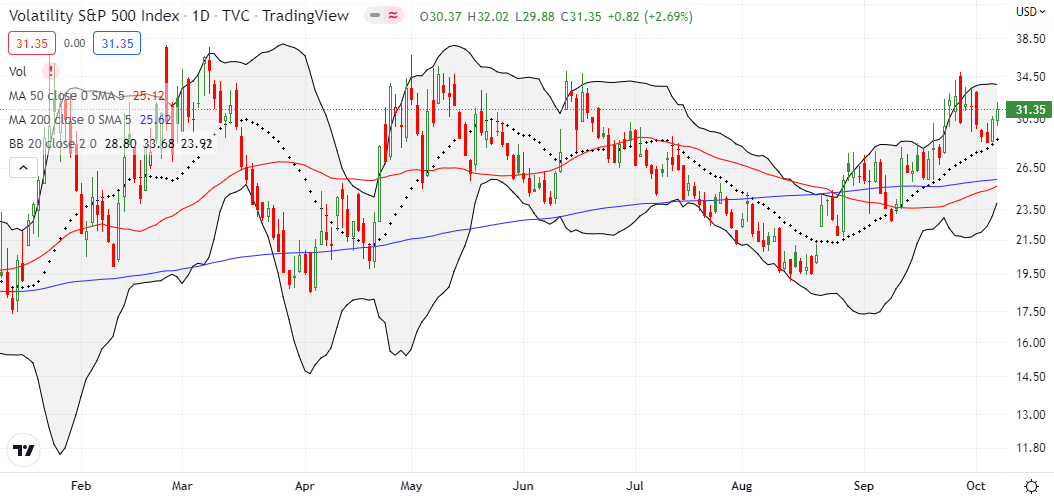
The volatility index (VIX) bounced off its current uptrend line (the dotted lines below). While gains make sense, I remain surprised at the VIX’s inability to truly surge. Sure, the VIX is deep in elevated territory, yet I would expect the “fear gauge” to trade at highs for the year given where the major indices trade. Instead, the VIX’s highs for the year look nearly insurmountable.
The Short-Term Trading Call With the Reality of A Fresh Oversold Period
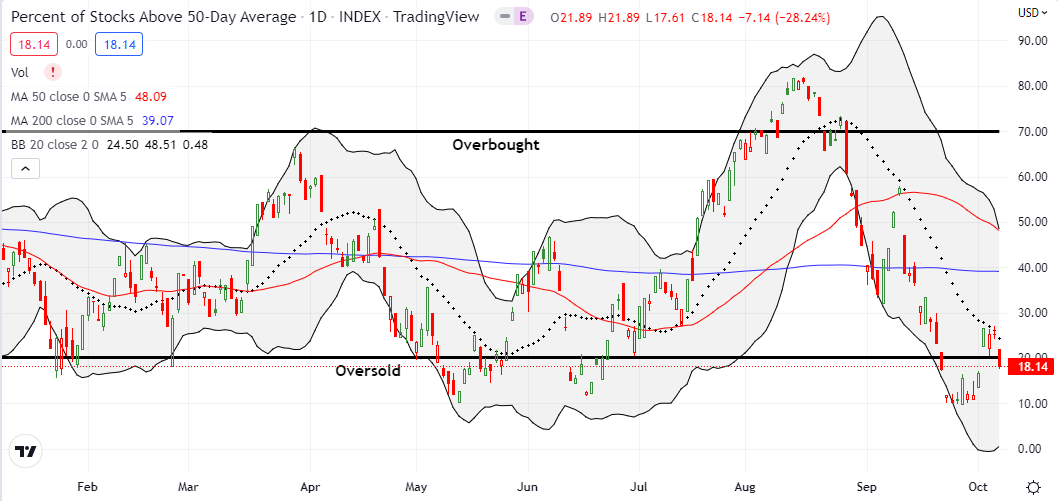
- AT50 (MMFI) = 18.1% of stocks are trading above their respective 50-day moving averages
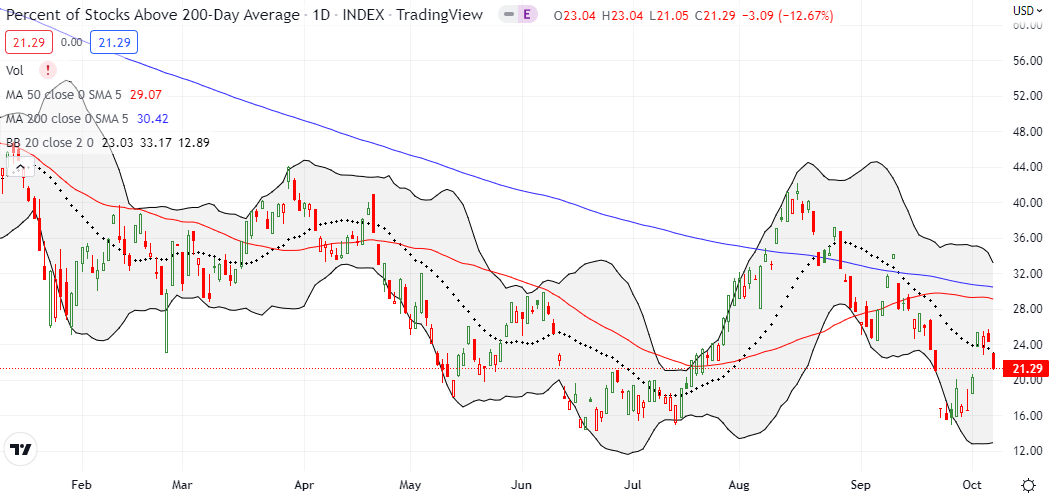
- AT200 (MMTH) = 21.3% of stocks are trading above their respective 200-day moving averages
- Short-term Trading Call: cautiously bullish
AT50 (MMFI), the percentage of stocks trading above their respective 50DMAs, dropped back into oversold territory with an 18.1% close. Unlike the last oversold period, I am more prepared to get aggressive earlier in this period. The VIX has not surged yet, but it does trade much higher than it traded at the start of the last oversold period. Moreover, October is the last of the year’s most dangerous months. Accordingly, October sell-offs must be treated as buying opportunities. Still, this oversold period could prove almost as tricky as the last one given earnings season and a consistently hawkish Federal Reserve.
I am still holding an October QQQ put spread and short an October SPY put spread. My previous plan to wait on a fresh IWM trade changed with the sharp end to the sugar high trade. The lower the stock market goes from here, the more aggressive I will get with SPY positions. I am not sure yet how I will trade QQQ while I still have a put spread on it. Finally, I will avoid individual stocks until after the associated company reports earnings. The big earnings warnings so far suggest that this earnings season could be filled with headline smashing disappointments.
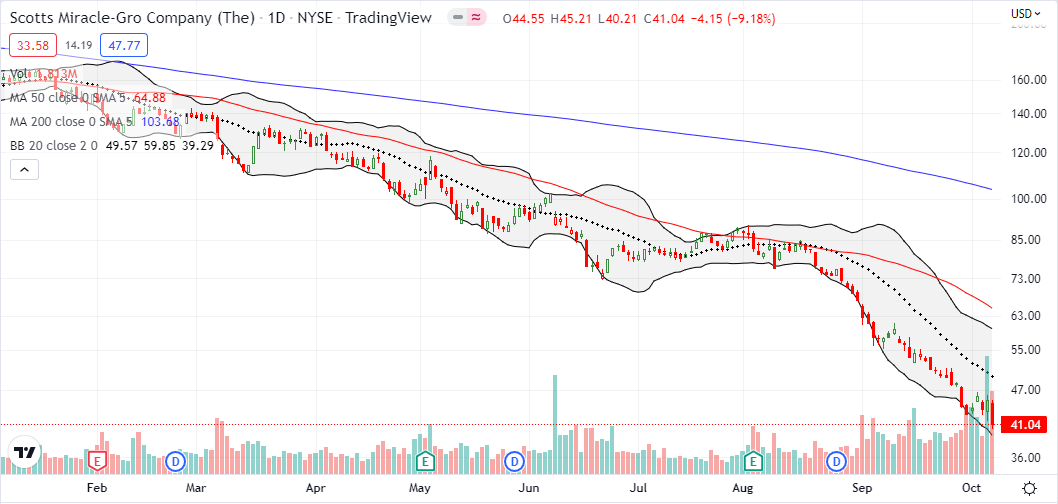
Speaking of disappointments, the Scotts Miracle-Gro Company (SMG) has been an unmitigated disaster. Three months ago, I looked across bear market green shoots to find non-tech stocks to invest for the long-term. I took a look at my small SMG position last week and was taken aback by its poor performance so far. I learned yet another lesson in the dangerous reality of investing in the middle of downtrends. Friday’s 9.2% plunge took SMG to an astonishing 10-year low. While I think the stock is now “mind numbingly cheap”, I am returning to respecting price action and bracing for what must be even more bad news to come.
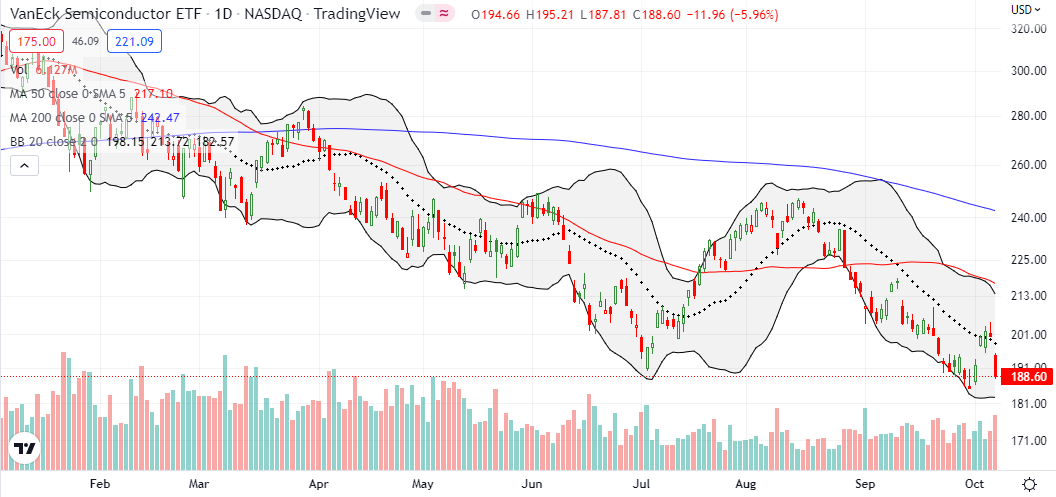
I benefited from getting back to reality with the VanEck Semiconductor ETF (SMH). On the way down to current levels, I have been fooled by several false breakouts in SMH. I duly noted how SMH sold down 4.1% on the news of President Biden signing the the CHIPS and Science Act. So, the sugar high rally put me on alert for another false move in SMH. When SMH initially failed at its 20DMA resistance I jumped into a vertical and calendar put spread. SMH pushed higher for a brief moment on Thursday, and I thought I was fooled again.
A big earnings warning that evening from Advanced Micro Devices (AMD) pulled the entire sector down on Friday (sellers dumped AMD all day into a 13.9% loss at the close). I took profits on the SMH calendar put spread. SMH now looks in danger of sliding past its September low. This back to reality trade also helped me realize that SMH looks like a good hedge against bullishness.
Be careful out there!
Footnotes
“Above the 50” (AT50) uses the percentage of stocks trading above their respective 50-day moving averages (DMAs) to measure breadth in the stock market. Breadth defines the distribution of participation in a rally or sell-off. As a result, AT50 identifies extremes in market sentiment that are likely to reverse. Above the 50 is my alternative name for “MMFI” which is a symbol TradingView.com and other chart vendors use for this breadth indicator. Learn more about AT50 on my Market Breadth Resource Page. AT200, or MMTH, measures the percentage of stocks trading above their respective 200DMAs.
Active AT50 (MMFI) periods: Day #1 under 20% (oversold period ending 3 days over 20%), Day #14 under 30%, Day #19 under 40%, Day #21 under 50%, Day #29 under 60%, Day #30 under 70%
Source for charts unless otherwise noted: TradingView.com
Full disclosure: long QQQ put vertical and calendar spreads, short SPY put spread, long SMH put spread, long AMD, long IWM vertical and calendar call spread
FOLLOW Dr. Duru’s commentary on financial markets via StockTwits, Twitter, and even Instagram!
*Charting notes: Stock prices are not adjusted for dividends. Candlestick charts use hollow bodies: open candles indicate a close higher than the open, filled candles indicate an open higher than the close.


Very insightful and cautiously not buying company stocks makes sense and also with lot of dependency on foreign exchange markets I am expecting a disappointment from few tech stocks.
To your comment on “The lower the stock market goes from here, the more aggressive I will get with SPY positions.” -are you going for Puts or Calls from here
Yes. I didn’t even mention how the strong dollar is going to hurt earnings for a lot of big companies (probably why IWM is slightly out-performing here).
On the comment about SPY positions, I meant call options. I definitely wouldn’t chase puts going deeper into oversold territory.
Thanks for reading and subscribe (free) if you haven’t already! 🙂
Regarding SMG: costs of fertilizers were up as a side effect of Covid disruptions, then have gone sky-high due to the Ukraine war (they’re a big producer). Take a look at a multi-year NTR chart. I had always wanted it as a good stable long-term play – people will always need food! I bought at $25 during the initial Covid crash. I sold after a year (at which point it had doubled). I should have kept a “house money” half, because it doubled again.
Thanks for that perspective! I didn’t think about rising input costs squeezing margins. NTR is another one of those strong charts that looks like it is ever so slowly breaking down. Gulp!