Stock Market Commentary:
Get used to it. The economy continues to unfold in unexpected ways. An exceptionally strong July jobs report threw some cold water on the breathless expectations on Wall Street for a recession. As one journalist commented on Marketplace, today’s economic context is a strange one with so many talking about a recession that has not yet happened while the employment picture continues to improve. So the suspense continues to build for more convincing evidence of economic misery.
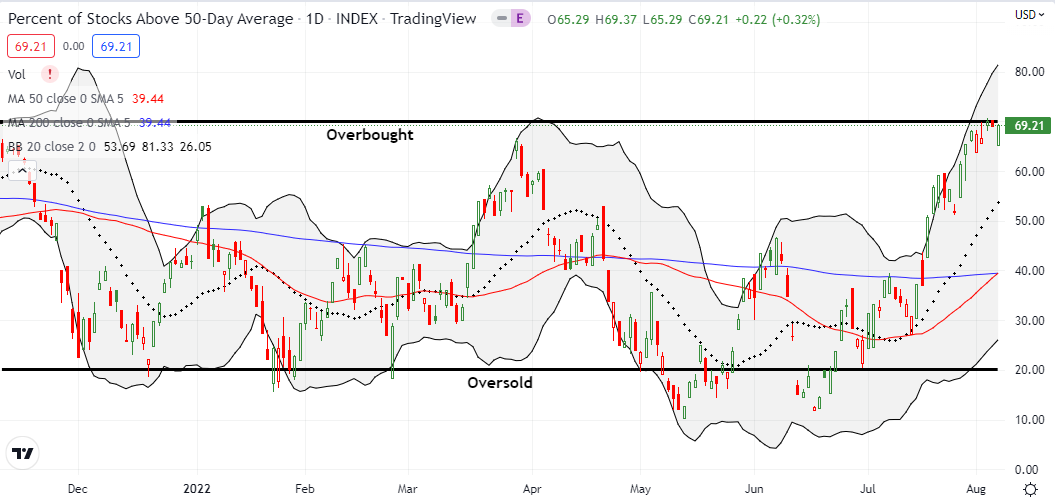
In the meantime, suspense continues to build at the overbought threshold for market breadth. As interest rates jumped in response to the jobs report, the stock market gapped down. The move looked like the start of a market reversal that would trigger a bearish call. Instead, dip buyers happily jumped in and barely looked back for the rest of the day. The resulting close leaves the technical indicators of market breadth hanging in suspense.
The Stock Market Indices
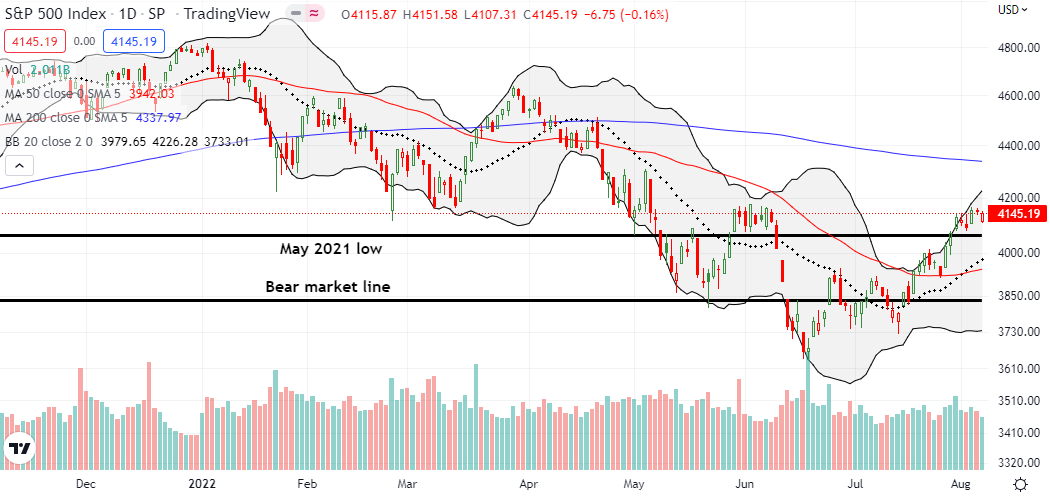
The S&P 500 (SPY) ended the day nearly flat as dip buyers saved the index from a gap down opening. The index closed just below its high for the week. The on-going challenges of the June highs add to the sense of suspense on when/how a resolution will unfold from this technical stalemate.
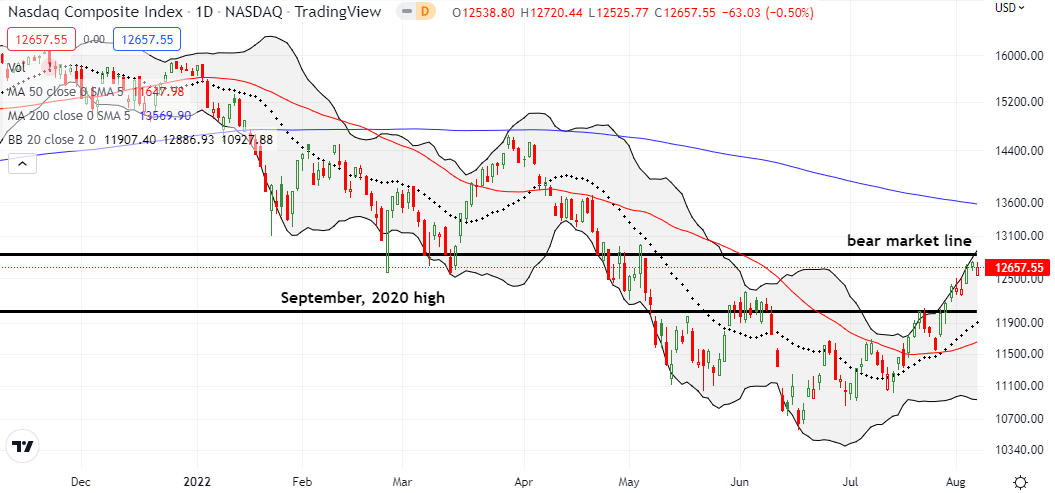
The NASDAQ (COMPQ) is leaving traders in suspense relative to the looming overhead resistance at the bear market line. Dip buyers saved the tech laden index from its opening gap down, but the NASDAQ still ended up with a 0.5% loss. I went ahead and bought QQQ put options expiring this Friday at the $318 strike. The trade is a bit of a stretch, but this suspense at the overbought threshold can resolve to the downside relatively quickly. I want to be ready.
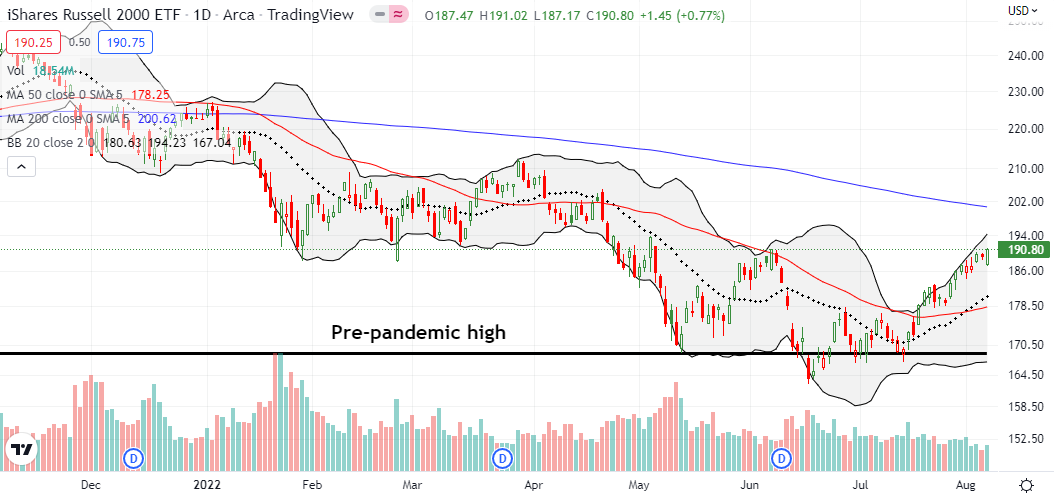
The iShares Russell 2000 ETF (IWM) left traders in suspense right at the June high. However, the dip buyers did more than just save the ETF of small caps from the initial gap down, IWM managed to end the day with a 0.8% gain. This reversal is bullish and is a counter-measure to the looming bearish implications of the market’s current struggle at the overbought threshold. I am still holding an IWM call spread. I am looking to close it out this week whether to grab profit to the upside or to limit losses to the downside.
Stock Market Volatility
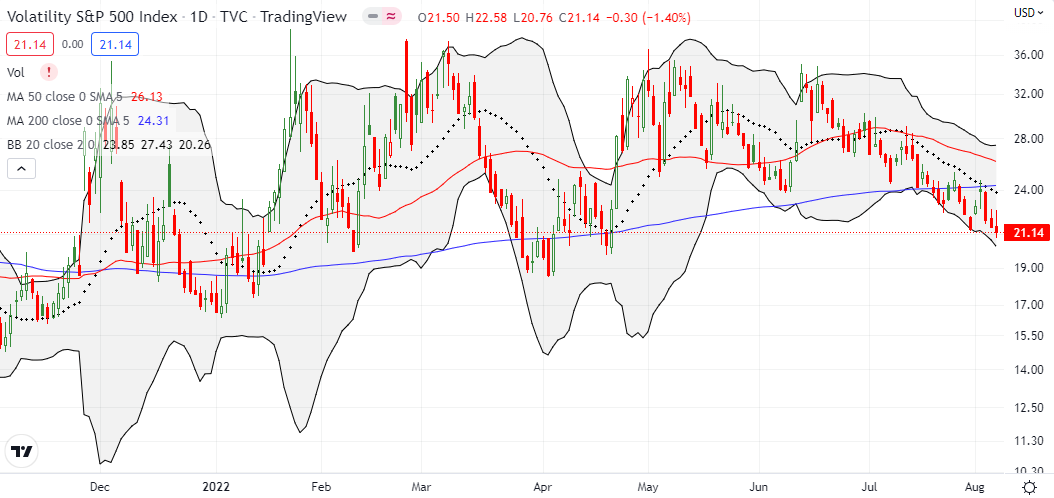
The volatility index (VIX) continued its sinking feeling. The new 4-month low added to the bullish sentiment for the week. Some might call it growing complacency. Still, the on-going decline in the VIX is appropriate as long as buyers remain in firm control of the market. On the flip side, buying put protection gets ever cheaper.
The Short-Term Trading Call In Suspense
- AT50 (MMFI) = 69.2% of stocks are trading above their respective 50-day moving averages
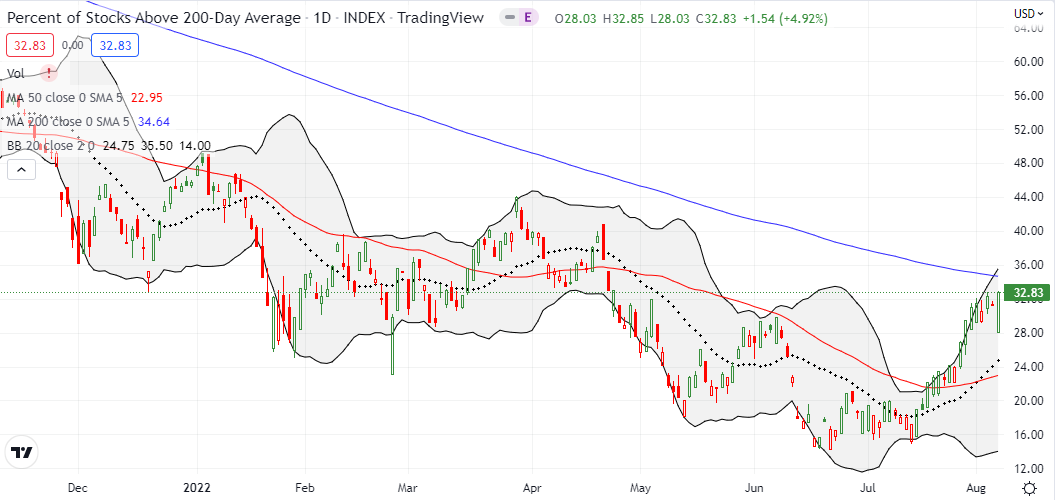
- AT200 (MMTH) = 32.8% of stocks are trading above their respective 200-day moving averages
- Short-term Trading Call: neutral
AT50 (MMFI), the percentage of stocks trading above their respective 50DMAs, spent most of the week in suspense just under the overbought threshold at 70%. The last four days in particular have delivered one close call after another. The churn leaves my short-term trading call at neutral awaiting resolution to the upside or downside. My decision to the downside is easy. As noted earlier, I already reached into the cookie jar for some early QQQ put options. A breakout into overbought territory would be a little trickier if the S&P 500 does not achieve a clean breakout above its June high and/or the NASDAQ does mot slice through resistance at its bear market line. Moreover, the VIX would likely be right at the critical 20 level that defines the threshold of “elevated” volatility.
The confluence of technical milestones is enough to make this suspense confirm we are at a critical juncture for the stock market! Next up, the latest CPI (consumer price index, aka inflation) numbers…
Be careful out there!
Footnotes
“Above the 50” (AT50) uses the percentage of stocks trading above their respective 50-day moving averages (DMAs) to measure breadth in the stock market. Breadth defines the distribution of participation in a rally or sell-off. As a result, AT50 identifies extremes in market sentiment that are likely to reverse. Above the 50 is my alternative name for “MMFI” which is a symbol TradingView.com and other chart vendors use for this breadth indicator. Learn more about AT50 on my Market Breadth Resource Page. AT200, or MMTH, measures the percentage of stocks trading above their respective 200DMAs.
Active AT50 (MMFI) periods: Day #24 over 20%, Day #18 over 30%, Day #11 over 40%, Day #11 over 50%, Day #5 over 60%, Day #355 under 70%
Source for charts unless otherwise noted: TradingView.com
Full disclosure: long IWM call spread, long QQQ puts
FOLLOW Dr. Duru’s commentary on financial markets via StockTwits, Twitter, and even Instagram!
*Charting notes: Stock prices are not adjusted for dividends. Candlestick charts use hollow bodies: open candles indicate a close higher than the open, filled candles indicate an open higher than the close.


I think volatility would be perched right on the 20 pivot, joining all the other signals teetering on their edges, if not for China’s insistence last week that Pelosi’s visit was a provocation, and belligerent response.
[FWIW, my opinion on that topic: as Pelosi once said about an instance of Trump belligerence: “I have many grandchildren; I know a tantrum when I see one.”]
Good one!
Yeah – the market has a lot of things to point to as catalysts. CPI this week should be impactful!