Stock Market Commentary:
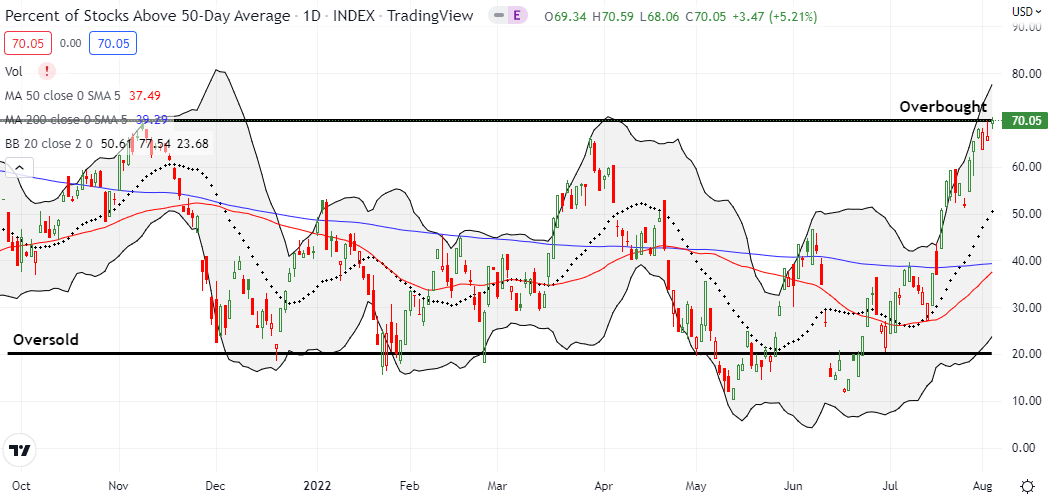
Market breadth was last this high 17 months ago. At that time, my favorite technical indicator was on its way down as a part of another buy-the-dip moment for the pandemic-inspired rally in the stock market. This time, market breadth is sitting right on top of the threshold of overbought conditions. The S&P 500 (SPY) is higher but the NASDAQ (COMPQ) is lower than those price levels 17 months ago. Both indices are enjoying impressive rallies. The price action has reached a critical juncture: lower from here signals a potential bearish reversal and higher from here could launch a fresh bullish phase to much higher prices.
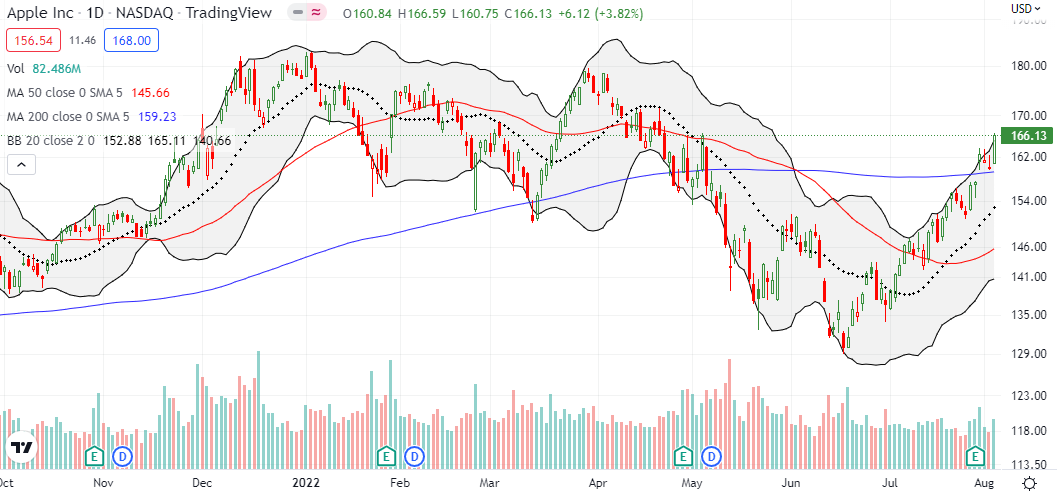
If Apple (AAPL) is any indicator, the market “wants” to take the bullish door higher and overcome the rally fatigue the painted the start of this week. AAPL soared higher with a 3.8% gain and confirmed its breakout above the 200-day moving average (DMA) (the blue line below). Is AAPL ready to continue leading the way in this “what recession?” mode?
The Stock Market Indices
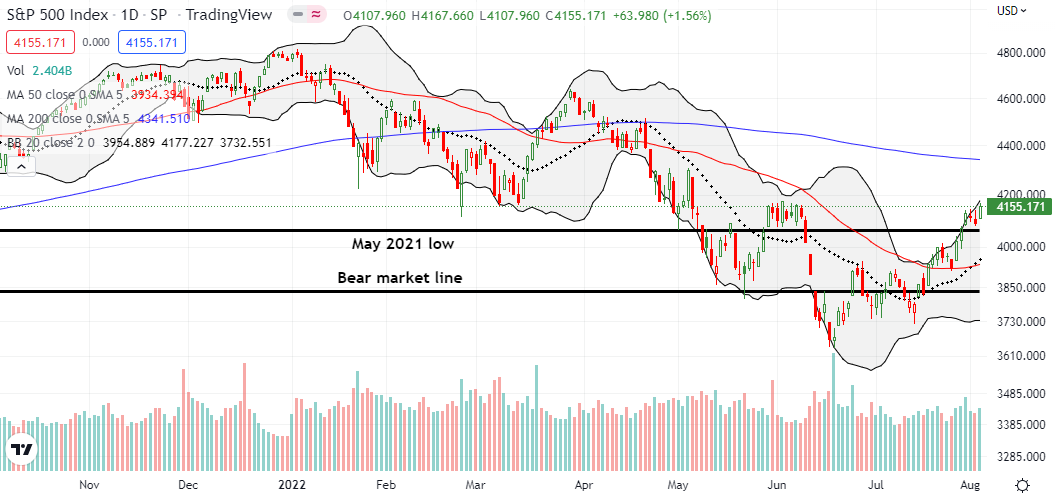
The S&P 500 (SPY) gained 1.6% and confirmed its breakout above the May, 2021 low. This bullish move is overshadowed by looming resistance from the June highs. A breakout above the June highs would put 200DMA resistance into play.
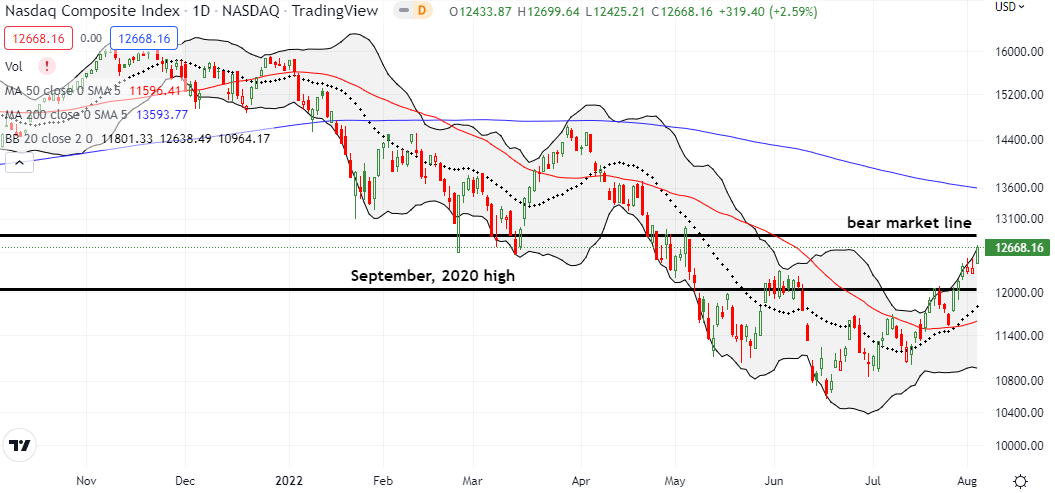
The NASDAQ (COMPQ) pushed the June highs further into the rear view mirror. The tech laden index’s 2.6% gain brought the price action within sight of the bear market line. Note well how important this line was earlier in the year as support and then resistance in late April and early May.
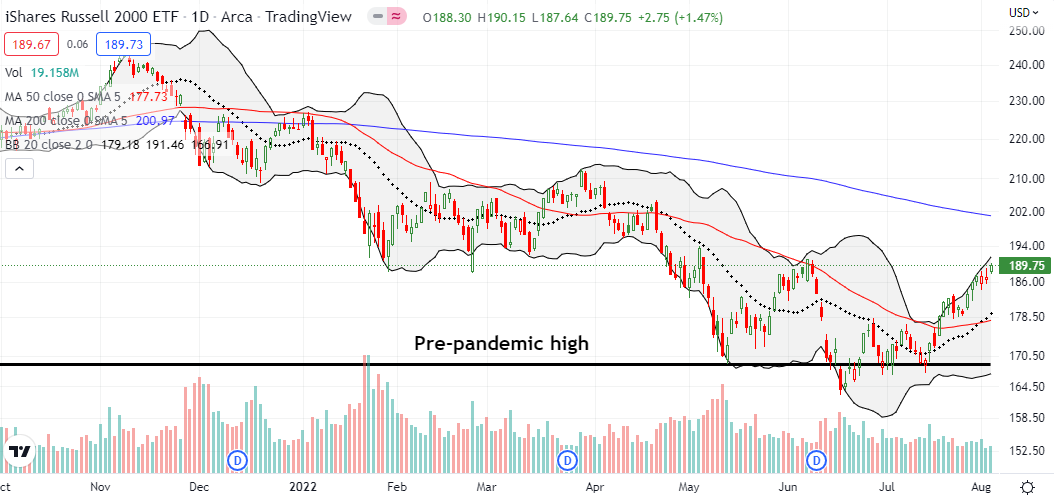
The iShares Russell 2000 ETF (IWM) just continues to creep higher. The ETF of small caps is ever closer to challenging its June high.
Stock Market Volatility
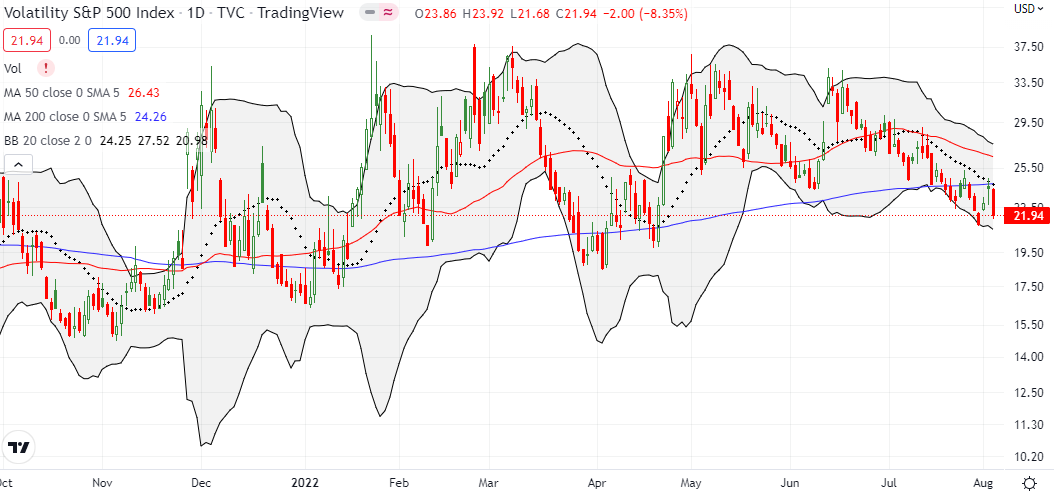
The volatility index (VIX) started the week with a rare two straight days of gains. The faders returned in full force today and sent the VIX down 8.4%. I am surprised the VIX managed to close above last week’s low. The 20 threshold of elevated volatility still looks like it is in play. Such a test would complicated the start of an extended overbought rally in the stock market.
The Short-Term Trading Call A First In 17 Months
- AT50 (MMFI) = 70.0% of stocks are trading above their respective 50-day moving averages
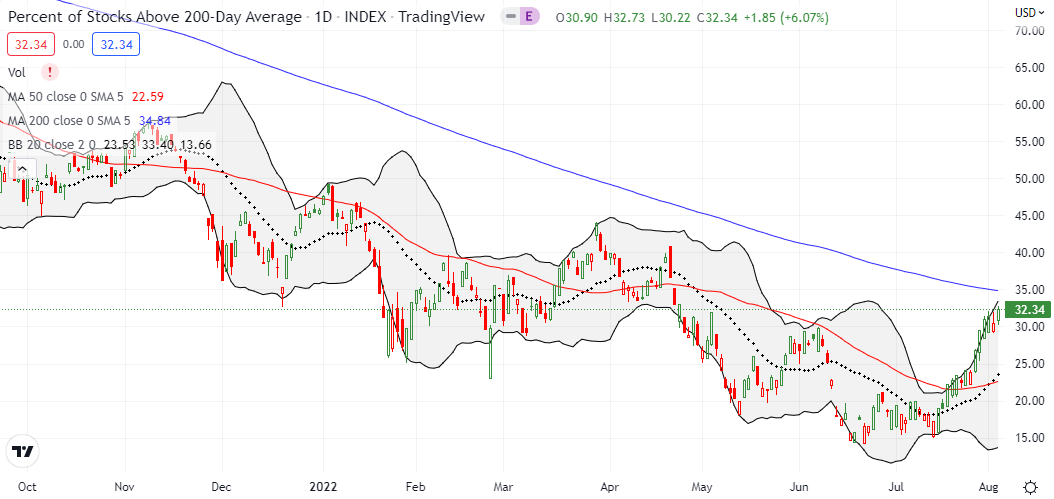
- AT200 (MMTH) = 32.3% of stocks are trading above their respective 200-day moving averages
- Short-term Trading Call: neutral
AT50 (MMFI), the percentage of stocks trading above their respective 50DMAs, closed right on top of the overbought threshold. While I cannot declare official overbought conditions, the setup is still a critical juncture. Per the AT50 trading rules, a reversal from here signals the potential start of a bearish reversal. A continued push higher opens up the potential for an extended overbought rally.
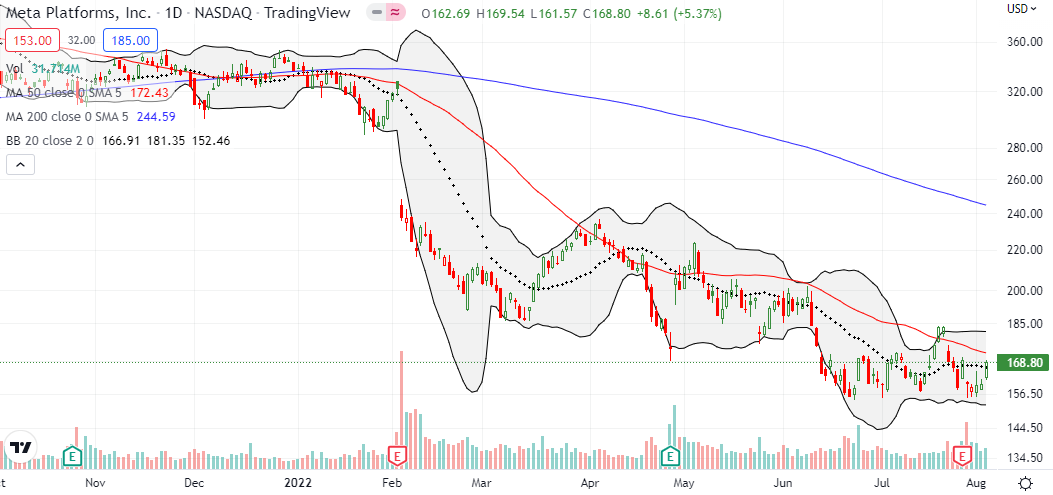
Four stocks round out today’s review. Meta Platforms (META) remains a relative laggard. The market’s rally is essentially dragging META higher. The anti-gravity has been powerful enough to reverse META’s post-earnings loss. That reversal is bullish to the extent META can punch through its 50DMA resistance (the red line below).
Even Roku, Inc (ROKU) is close to reversing its post-earnings loss. Given the stock is bouncing off its pandemic low, I am assuming ROKU finally carved out a bottom until it proves otherwise.
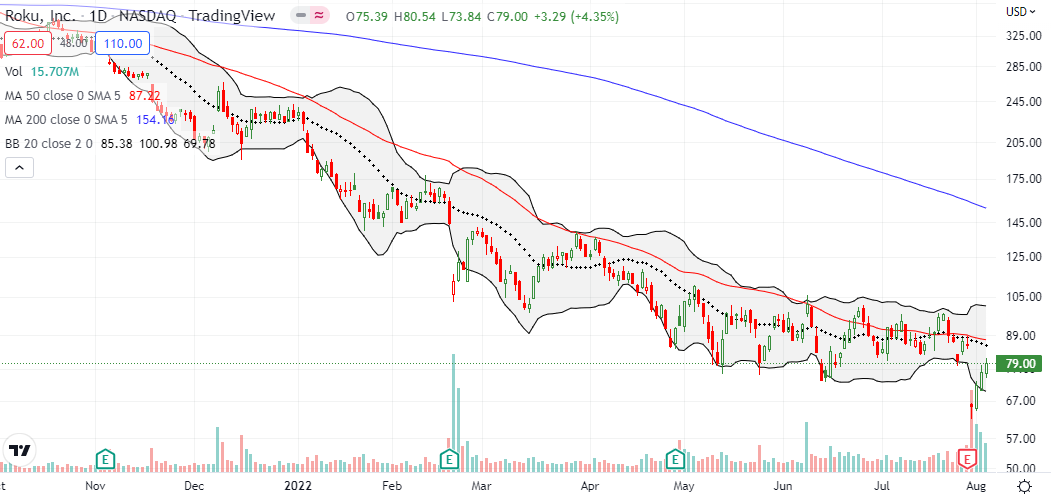
ROKU constitutes 8.1% of the holdings for ARK Innovation ETF (ARKK). So it looks like ROKU’s resurrection helped push ARKK into a fresh high. The rally in ARKK has been sneaky. The June sell-off was a sharp setback but brief. Ever since then, ARKK has steadily ground higher with higher highs and higher lows. If the recent pattern holds, ARKK will soon dip again back to its now uptrending 20DMA support (dotted line). Perhaps ARKK finally found its bottom at the pandemic and is ready to rebuild.
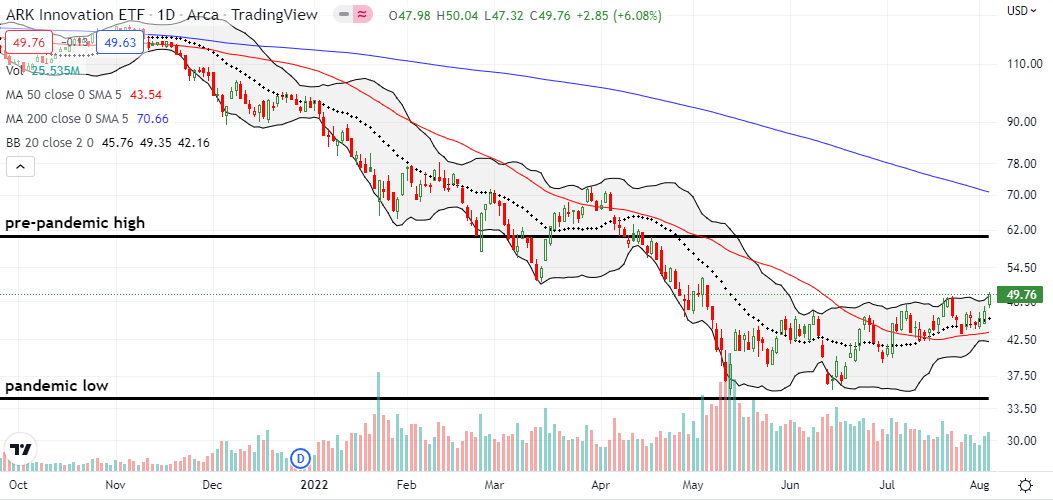
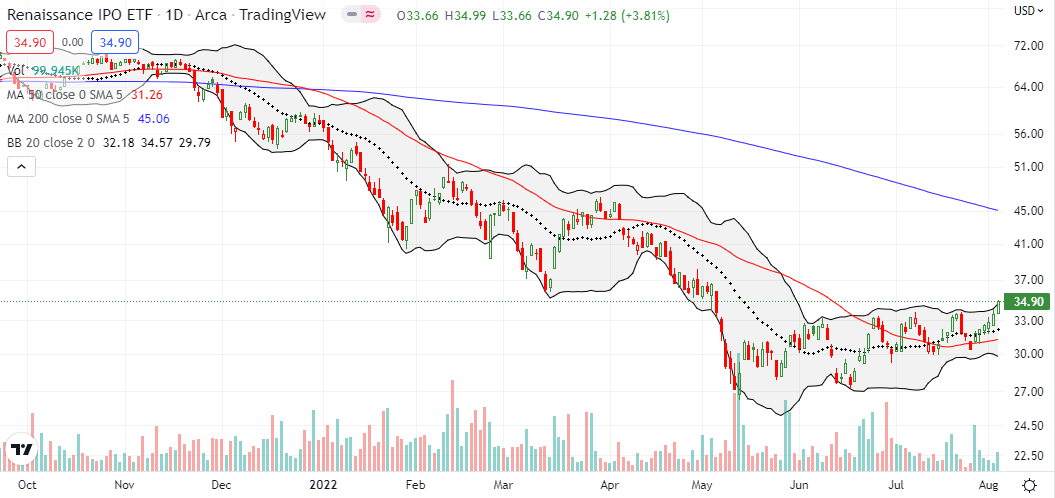
More evidence that ARKK is a hotbed of speculation comes from its tight correlation with the Renaissance IPO ETF (IPO). The trading patterns are almost a carbon copy. Perhaps ironically, IPO suffers a little less volatility than ARKK. Anyway, the apparent double-bottoming in these speculative ETFs suggests that a solid base of support awaits the next reversal in the stock market.
Be careful out there!
Footnotes
“Above the 50” (AT50) uses the percentage of stocks trading above their respective 50-day moving averages (DMAs) to measure breadth in the stock market. Breadth defines the distribution of participation in a rally or sell-off. As a result, AT50 identifies extremes in market sentiment that are likely to reverse. Above the 50 is my alternative name for “MMFI” which is a symbol TradingView.com and other chart vendors use for this breadth indicator. Learn more about AT50 on my Market Breadth Resource Page. AT200, or MMTH, measures the percentage of stocks trading above their respective 200DMAs.
Active AT50 (MMFI) periods: Day #22 over 20%, Day #16 over 30%, Day #9 over 40%, Day #9 over 50%, Day #3 over 60%, Day #353 under 70%
Source for charts unless otherwise noted: TradingView.com
Full disclosure: long IWM call spread, long IPO
FOLLOW Dr. Duru’s commentary on financial markets via StockTwits, Twitter, and even Instagram!
*Charting notes: Stock prices are not adjusted for dividends. Candlestick charts use hollow bodies: open candles indicate a close higher than the open, filled candles indicate an open higher than the close.

Rules breached….shorting?
I am not completely clear on what you mean by “rules breached”, but if AT50 comes down from here, I will be looking for shorts.