Stock Market Commentary:
The synchronized breakout looked impressive, but it already hit a serious setback. Friday’s downbeat day was relatively mild on a percentage loss basis, but the context was important. The economic setback came from the July update for the S&P Global Flash US PMI (Purchasing Managers’ Index™) Composite Output Index. The headline says it all: “US private sector output contracts for the first time in over two years amid muted client demand.” The graph for monthly PMI reeks of higher risk for recession.
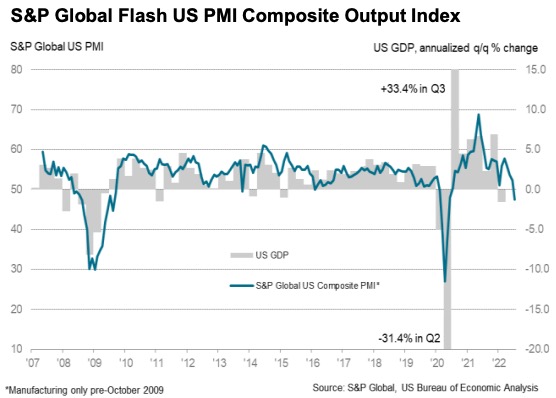
From the report: “The downturn was led by a steep drop in service sector activity, though production at manufacturers also fell marginally, down for the first time in over two years…Companies noted that weak demand conditions stemmed from severe inflationary pressures and hikes in interest rates, which have exerted further strain on domestic client spending.”
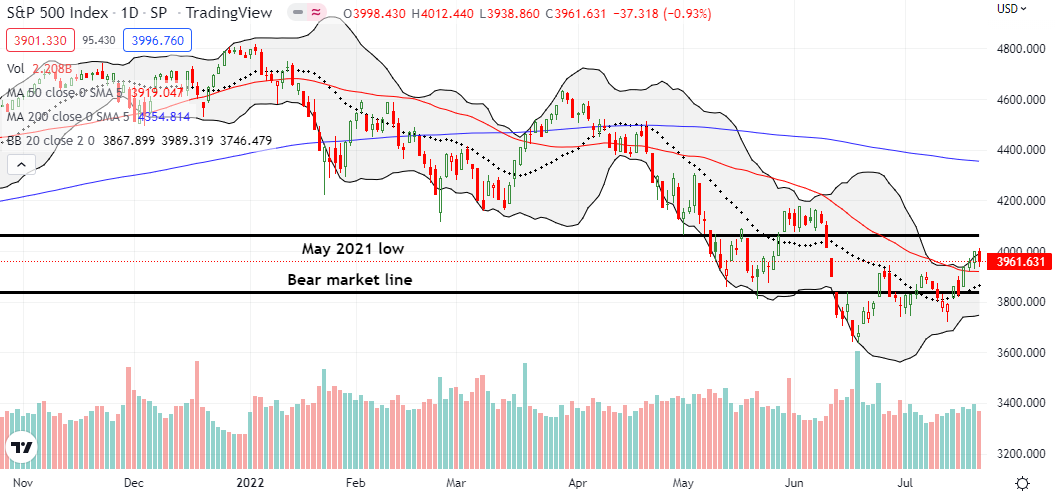
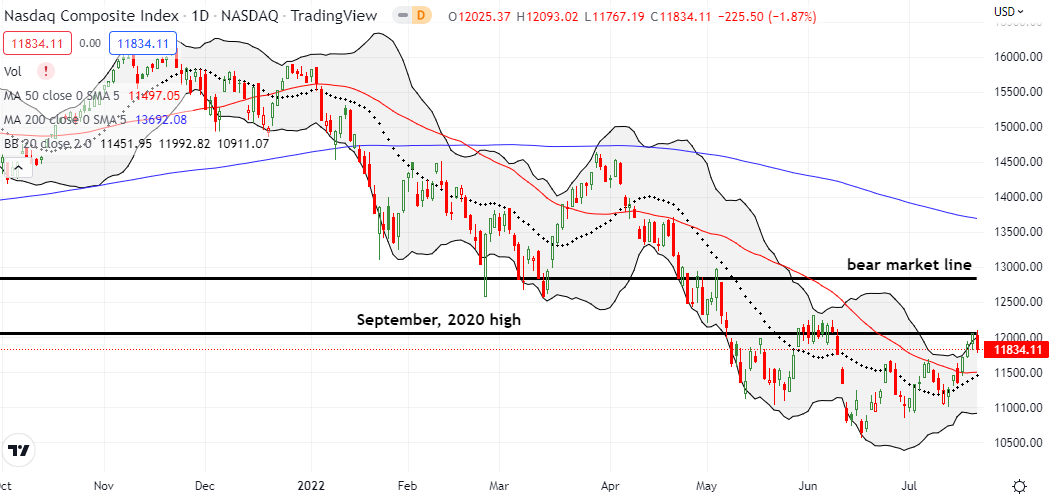
The technical setback came from the S&P 500, NASDAQ, and market breadth. Each one failed right at or under key levels of resistance.
The Stock Market Indices
The S&P 500 (SPY) lost 0.9% and left behind the psychologically important 4000 level as a key resistance level. The index almost reversed all its gains from the recent confirmed breakout above its 50-day moving average (DMA) (the red line below). Support needs to hold at the 50DMA. Otherwise, downside risk opens up to the bear market line and the July low even with an uptrending 20DMA (the dotted line below).
The NASDAQ (COMPQ) encountered the most serious setback. The tech laden index experienced a picture-perfect failure right at the September, 2020 high. While the NASDAQ still sits on good-sized gains from its 50DMA breakout, a test of 50DMA is in play. Fortunately, prospects for a successful test look good with the 20DMA converging to provide additional support.
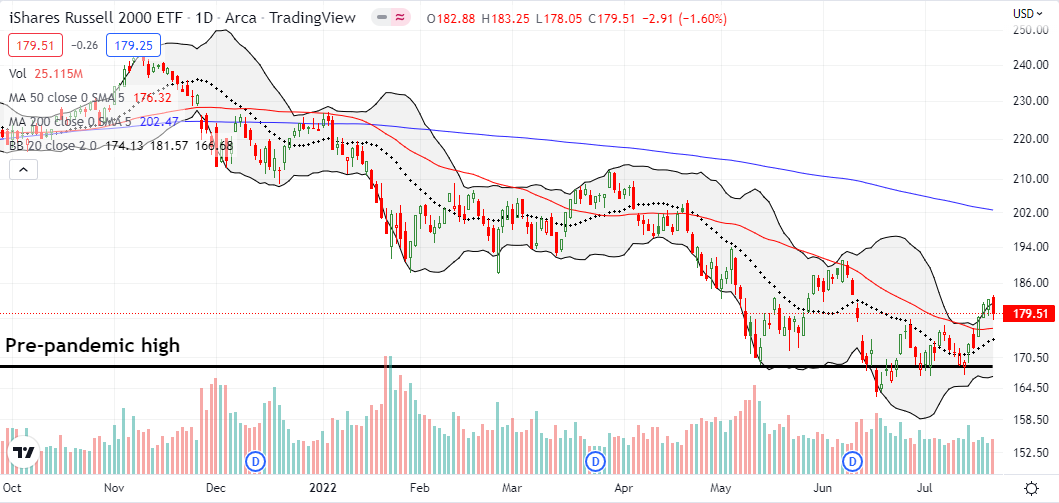
The iShares Russell 2000 ETF (IWM) lost 1.6%. The ETF of small caps was the most extended of the indices after three straight days closing above its upper Bollinger Band (BB). As with the NASDAQ, I am watching for signals from the trading action at 50/20DMA supports.
Stock Market Volatility
Ironically, the volatility index (VIX) confirmed a new bullish tone in the market with its break of support at the June lows. This technical turn stands in contrast to the serious setback discoloring the trading action. A waning VIX keeps me from getting bearish (for now) about the market’s technical setbacks.

The Short-Term Trading Call With A Serious Setback
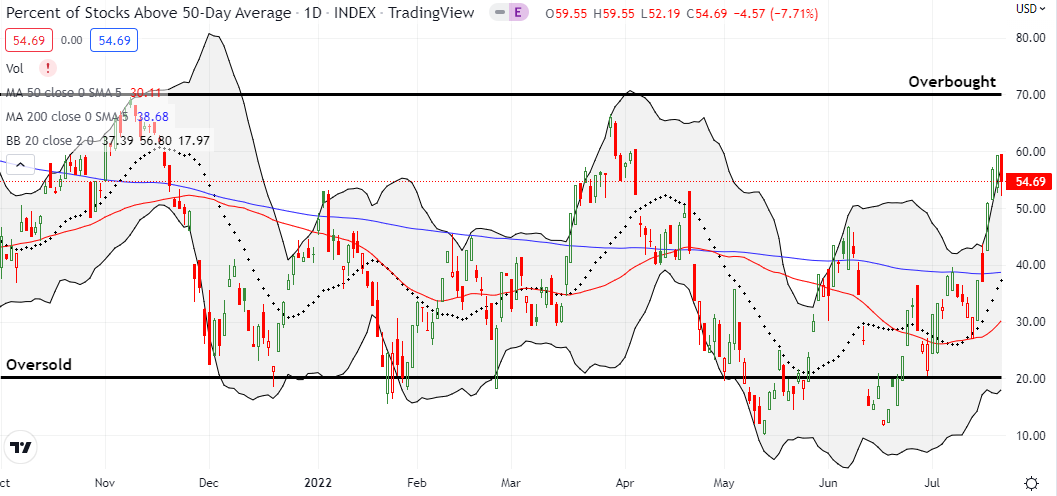
- AT50 (MMFI) = 54.7% of stocks are trading above their respective 50-day moving averages
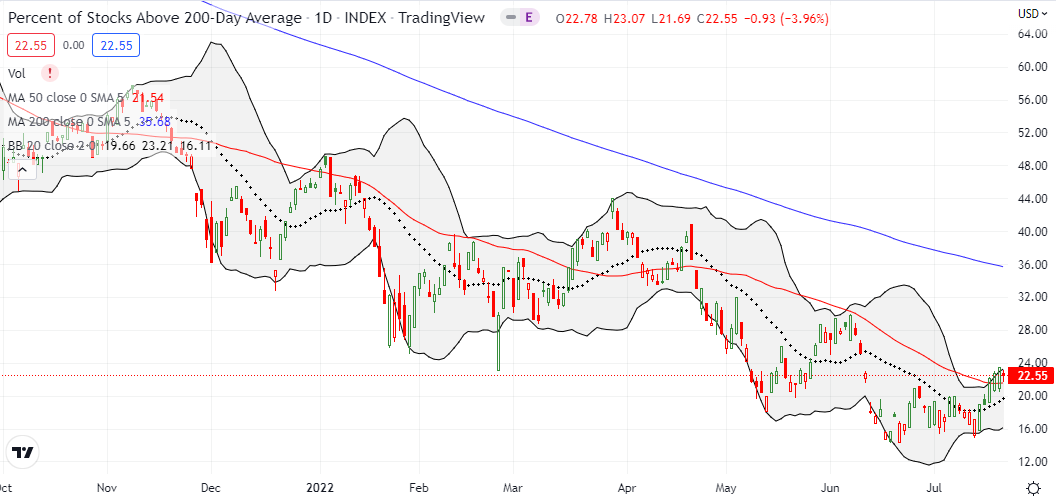
- AT200 (MMTH) = 22.6% of stocks are trading above their respective 200-day moving averages
- Short-term Trading Call: neutral
AT50 (MMFI), the percentage of stocks trading above their respective 50DMAs, pulled back almost 5 percentage points to 54.7%. My favorite technical indicator was quite stretched given the rapid rise from sub-30% to 60%. So this setback looms large because it could mark a “close enough” failure under the overbought threshold. Until Friday’s reversal, AT50 traded at its third highest point of the year!
If not for the confirmed 50DMA breakouts still place, I would be tempted to flip my short-term trading call from neutral to cautiously bearish. As it stands, a major earnings week ahead and a Federal Reserve decision on monetary policy mean a neutral stance presents the best risk/reward for now. Even 50DMA breakdowns will not move me off neutrality UNLESS they are in response to the Fed’s decision.
Be careful out there!
Footnotes
“Above the 50” (AT50) uses the percentage of stocks trading above their respective 50-day moving averages (DMAs) to measure breadth in the stock market. Breadth defines the distribution of participation in a rally or sell-off. As a result, AT50 identifies extremes in market sentiment that are likely to reverse. Above the 50 is my alternative name for “MMFI” which is a symbol TradingView.com and other chart vendors use for this breadth indicator. Learn more about AT50 on my Market Breadth Resource Page. AT200, or MMTH, measures the percentage of stocks trading above their respective 200DMAs.
Active AT50 (MMFI) periods: Day #17 over 20%, Day #11 over 30%, Day #4 over 40%, Day #4 over 50% (overperiod), Day #77 under 60% (underperiod), Day #348 under 70%
Source for charts unless otherwise noted: TradingView.com
Full disclosure: long QQQ calendar call spread, QQQ put spread, long IWM call
FOLLOW Dr. Duru’s commentary on financial markets via StockTwits, Twitter, and even Instagram!
*Charting notes: Stock prices are not adjusted for dividends. Candlestick charts use hollow bodies: open candles indicate a close higher than the open, filled candles indicate an open higher than the close.

