Stock Market Commentary
First, a strong jobs report unnerved the stock market. Next, strong inflation unraveled the stock market as bear market trading beat stocks back to oversold’s edge. Perhaps ironically, the White House sounded an early alarm bell about the inflation report and gave market participants a head start in selling. Sellers quickly flipped the switch back to bear market trading. By the time the dust settled on the week, the major stock market indices closed with various confirmations of bear market action. These confirmations light a path back to oversold trading conditions. The Federal Reserve’s upcoming decision on monetary policy stands ominously tall as the next wildcard determining how this next trip to oversold conditions play out.
The Stock Market Indices
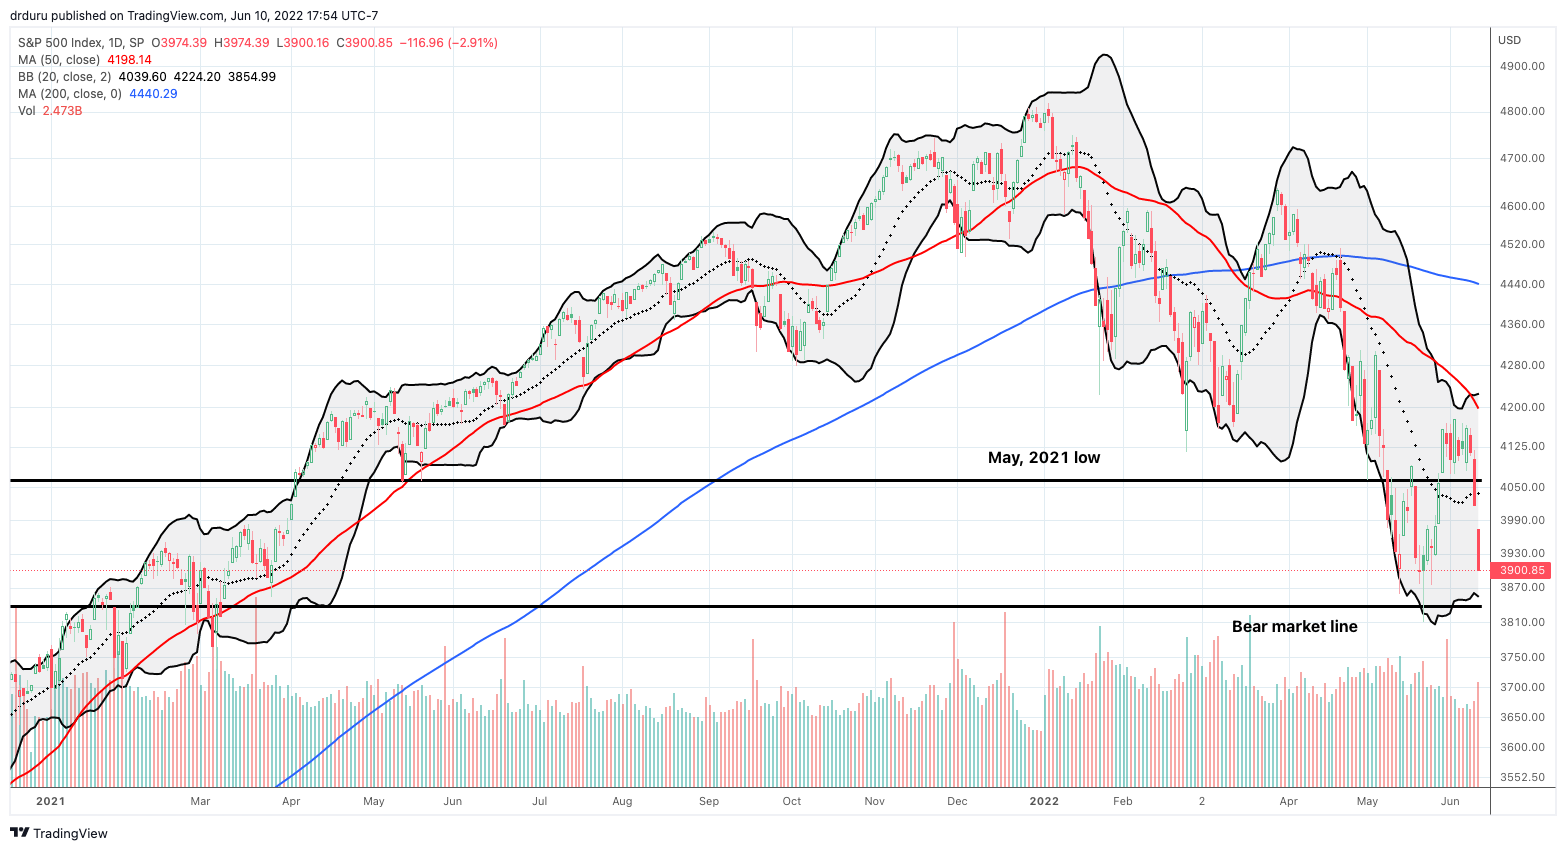
Thursday’s selling delivered the return to bear market trading. The S&P 500 (SPY) lost 2.4% and sliced through the May, 2021 low that served as support after last month’s key breakout. The bears confirmed the breakdown with the next day’s 2.9% loss. The S&P 500 even closed right at the year’s closing low which in turn was a 15-month low. I claimed earlier that the S&P 500 would not survive a third visit to the bear market line (which defines a 20% loss from the all-time high). Accordingly, I am bracing for the next oversold period to feature the index’s breakdown and close in bear market territory.
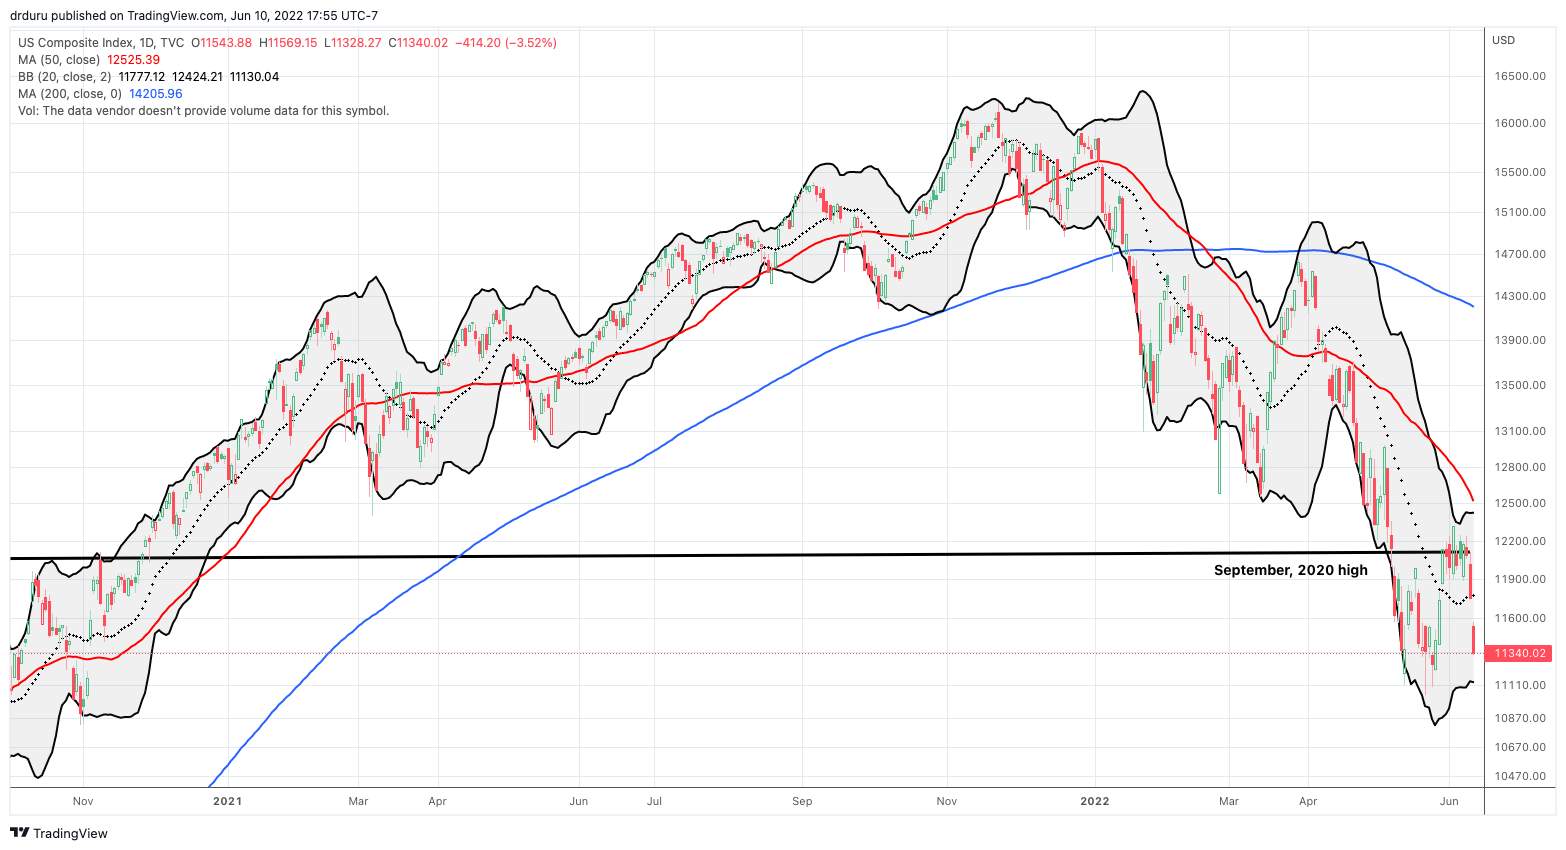
The NASDAQ (COMPQX) started its latest bear market journey with a 2.8% loss. That loss ended the tech-laden’s pivot around the September, 2020 high. Friday’s 3.5% loss confirmed the breakdown and the September, 2020 high as resistance. Like the S&P 500, I do not expect the NASDAQ to survive its next test of critical support. Accordingly, I expect the slip off oversold’s edge to feature the NASDAQ making new closing lows for the year.
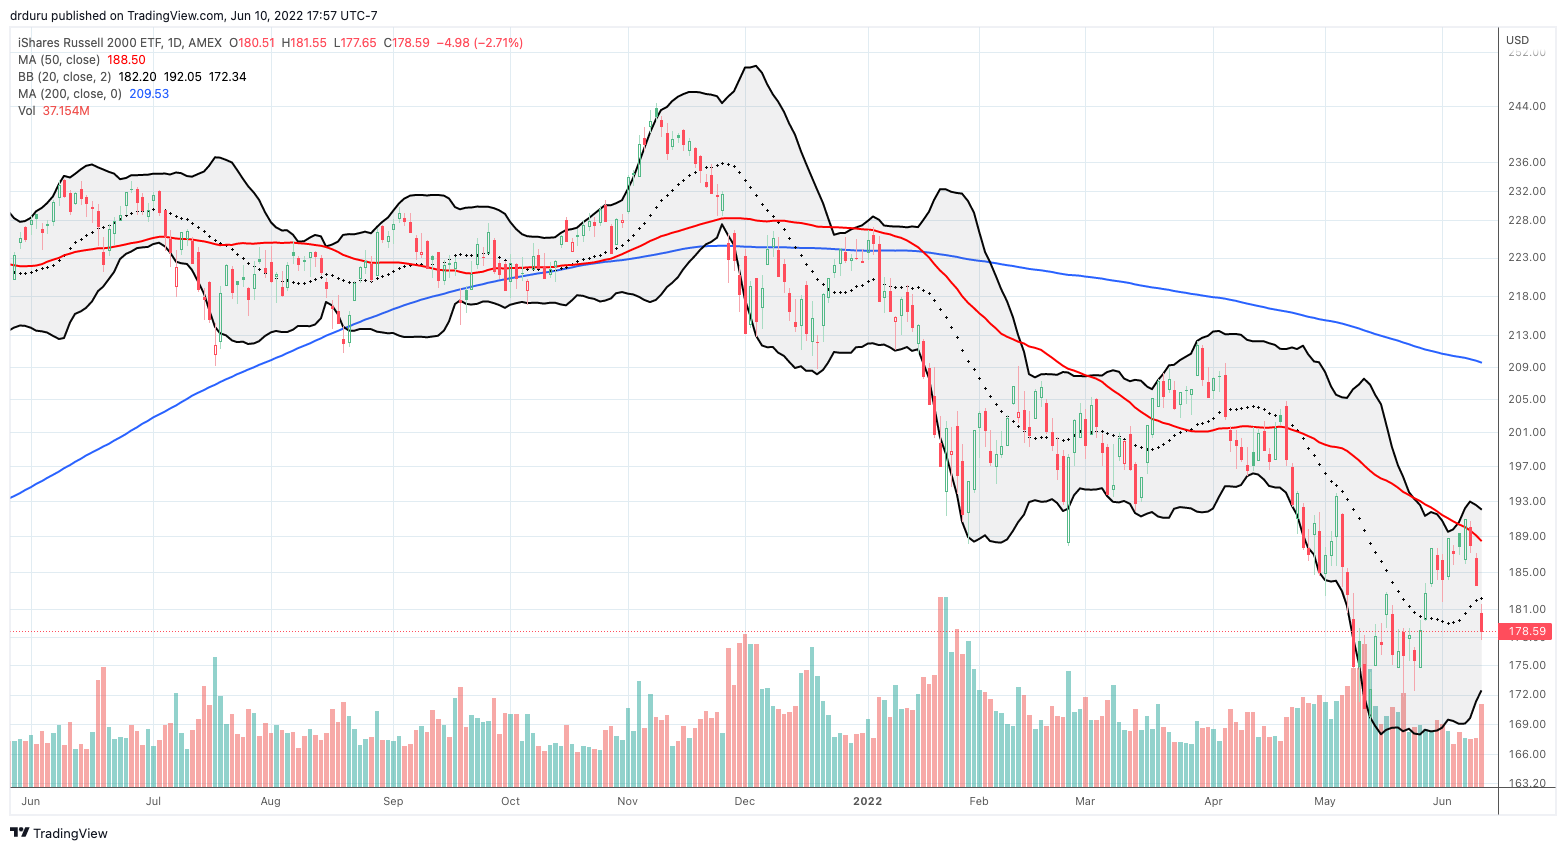
The iShares Russell 2000 ETF (IWM) returned to bear market trading with a confirmation of resistance at its 50-day moving average (DMA) (the red line below). The 2.3% loss on Thursday ended my hope for a bullish breakout. Friday’s 2.7% loss further confirmed the return to bear market trading. IWM remains well off its 2022 low, so it is very possible IWM manages to cling to that low as support after the stock market slips off oversold’s edge.
Stock Market Volatility
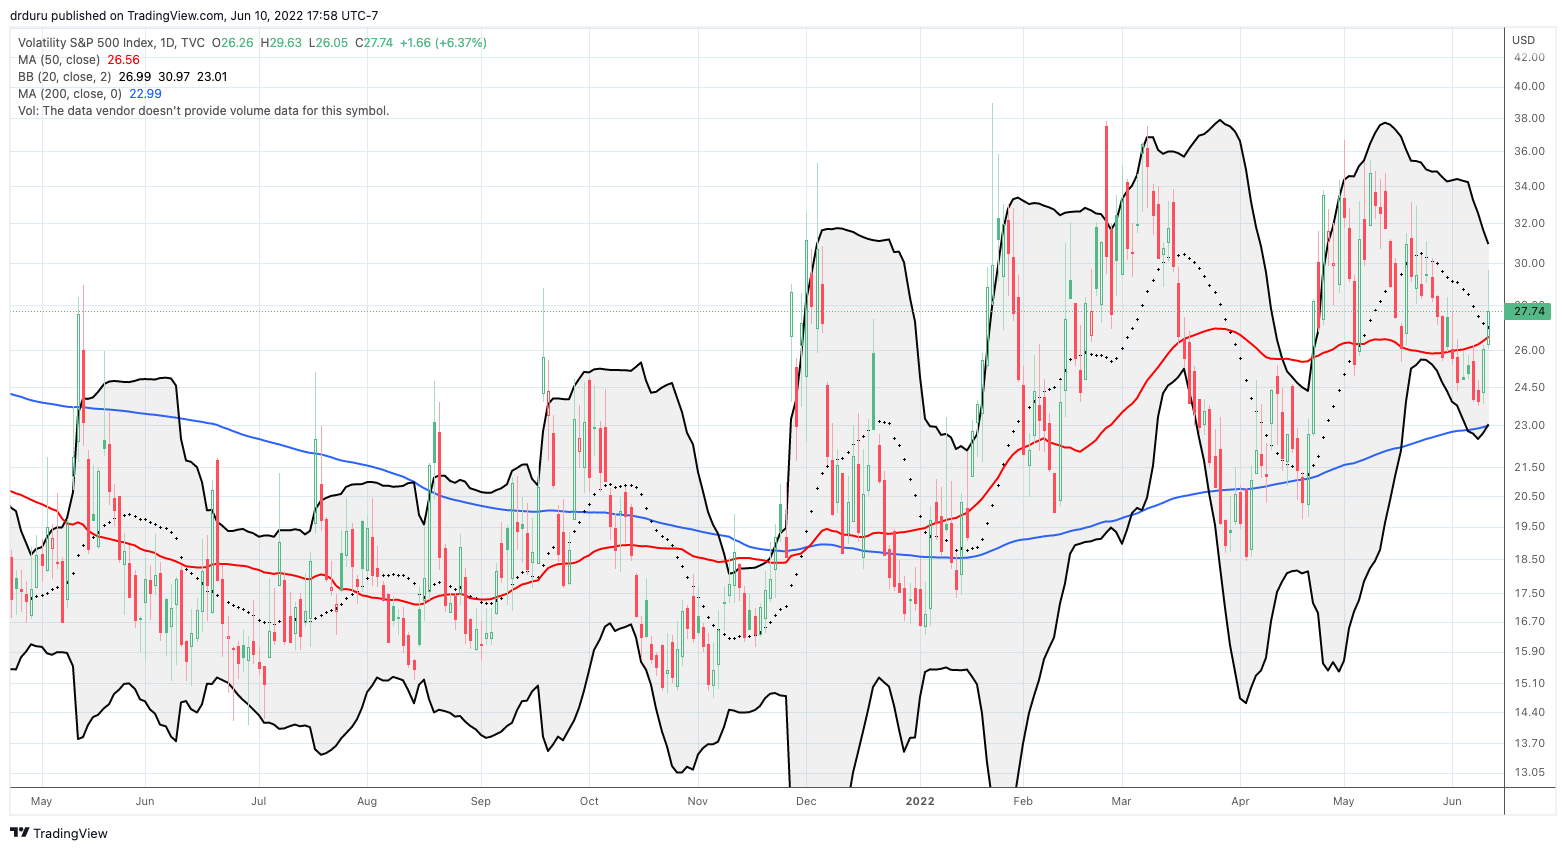
The volatility index (VIX) was relatively lethargic given the the definitive return to bear market trading. On Friday the VIX surged to 30 only to fade sharply back to 27.7. While the VIX should go into the Federal Reserve’s meeting at higher levels, the VIX looks setup for a big fade after the meeting…unless the Fed does something extreme.
The Short-Term Trading Call At Oversold’s Edge
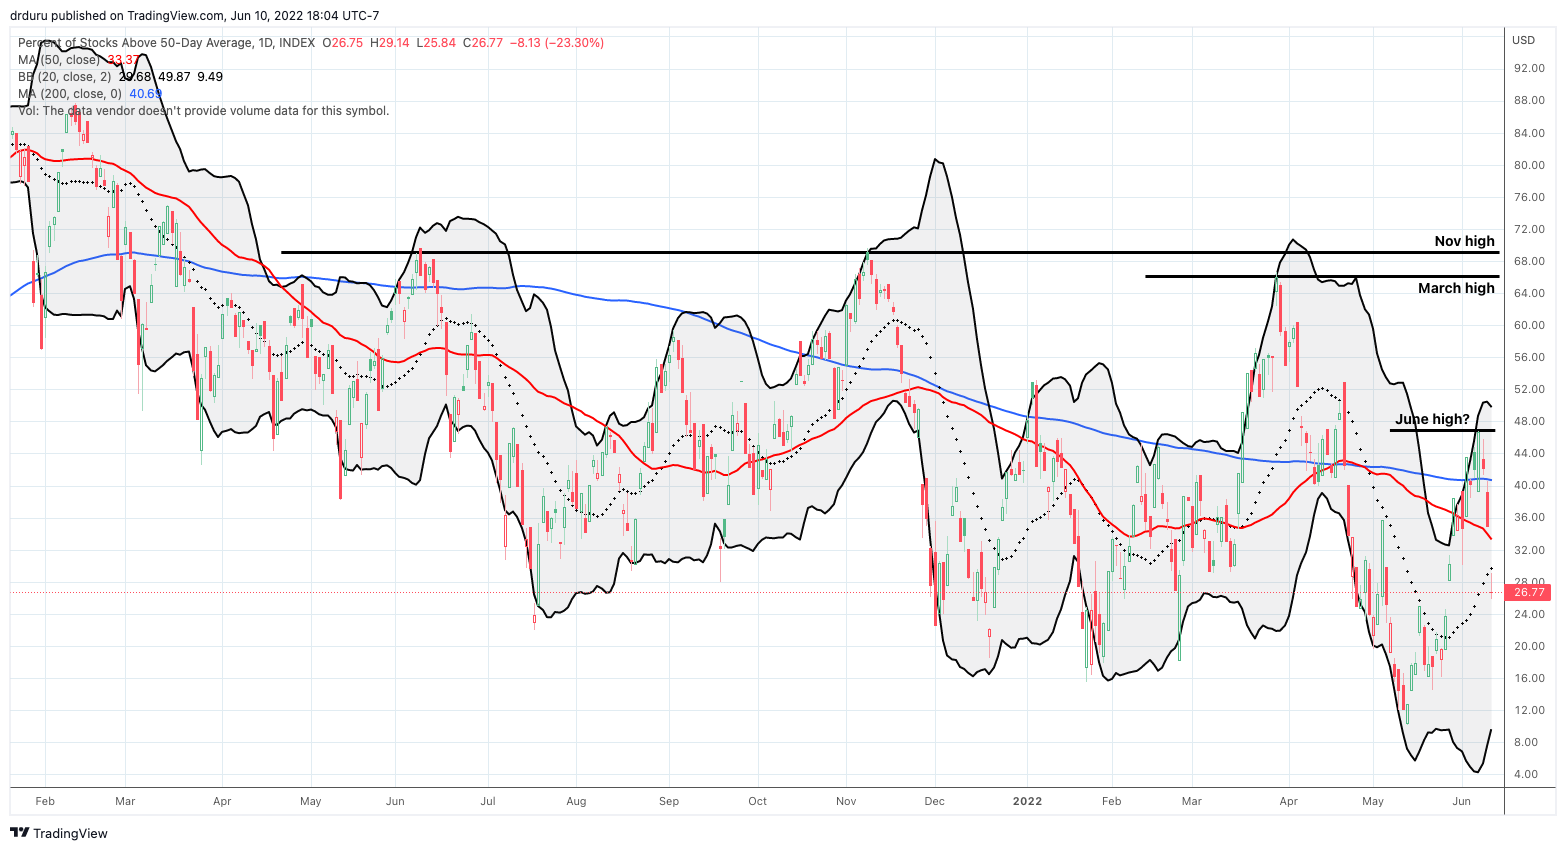
- AT50 (MMFI) = 26.8% of stocks are trading above their respective 50-day moving averages
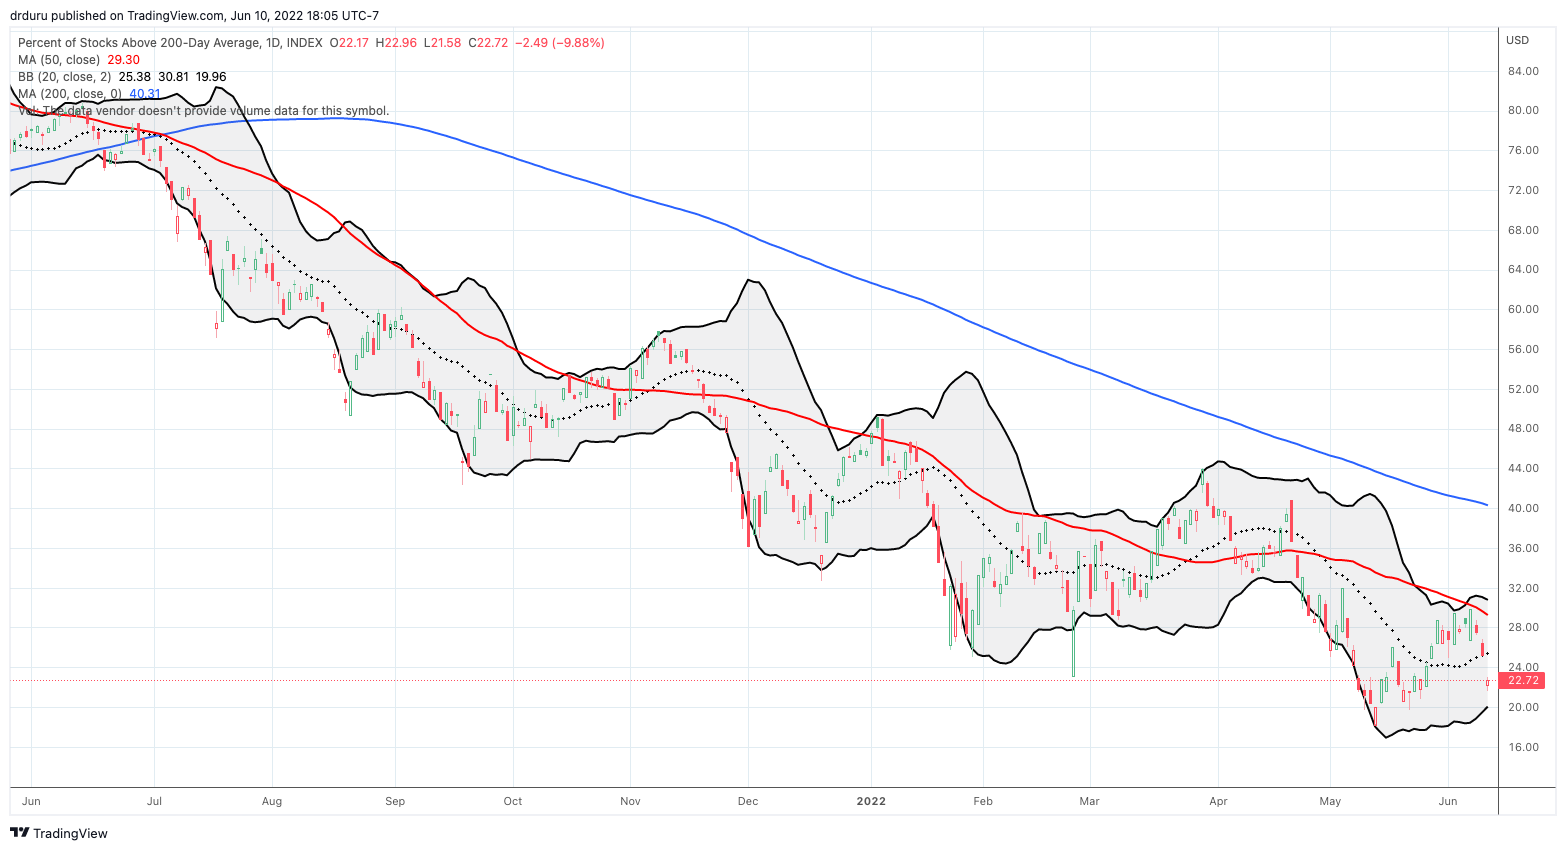
- AT200 (MMTH) = 27.8% of stocks are trading above their respective 200-day moving averages
- Short-term Trading Call: neutral
AT50 (MMFI), the percentage of stocks trading above their respective 50DMAs, finished the week at 26.8%. In just 2 trading days, my favorite technical indicator dropped from a bullish position back to oversold’s edge. Per my earlier plan, I flipped short-term neutral after the S&P 500 closed below the May, 2021 low. Despite my expectations for more breakdowns, I am not flipping bearish. Per my AT50 trading rules, I never go bearish so close to oversold trading conditions. In fact, I added some QQQ calls on Friday that I hope to flip heading into the Fed meeting. I took off some bearish positions like my two fists full of put options in iShares iBoxx $ High Yield Corporate Bond ETF (HYG).
I am once again more concerned about market breadth. Bear market trading beat stocks back to oversold’s edge in just two days. The chart below shows AT50 topping out at lower and lower highs. Assuming the June high holds, the prospect for an extended stay in oversold territory looms large.
Be careful out there!
Footnotes
“Above the 50” (AT50) uses the percentage of stocks trading above their respective 50-day moving averages (DMAs) to measure breadth in the stock market. Breadth defines the distribution of participation in a rally or sell-off. As a result, AT50 identifies extremes in market sentiment that are likely to reverse. Above the 50 is my alternative name for “MMFI” which is a symbol TradingView.com and other chart vendors use for this breadth indicator. Learn more about AT50 on my Market Breadth Resource Page. AT200, or MMTH, measures the percentage of stocks trading above their respective 200DMAs.
Active AT50 (MMFI) periods: Day #13 over 20% (overperiod), Day #1 under 30% (underperiod ending 9 days over 30%), Day #3 under 40%, Day #47 under 50%, Day #52 under 60%, Day #323 under 70%
Source for charts unless otherwise noted: TradingView.com
Full disclosure: long QQQ put spread and calls; long SPY call spread, long IWM call spread
FOLLOW Dr. Duru’s commentary on financial markets via StockTwits, Twitter, and even Instagram!
*Charting notes: Stock prices are not adjusted for dividends. Candlestick charts use hollow bodies: open candles indicate a close higher than the open, filled candles indicate an open higher than the close.
