
Stock Market Commentary
According to Investopedia, the Santa Claus rally “describes a sustained increase in the stock market that occurs in the last week of December through the first two trading days in January.” With the legendary rally still a week away, the S&P 500 (SPY) finds itself priced exactly where it was at the end of November. More importantly, the manic stock market that rallied the S&P 500 back to an all-time high just last week, increased the casualty count of stocks in worse technical shape than at the end of the November sell-off. The deterioration in this round of selling was deep enough to effectively plant the stock market in oversold territory. The Grinch roasted Santa on an oversold fire. Will buyers put out the fire fast enough to launch the next oversold bounce in time for the Santa Claus rally?
The Stock Market Indices
The S&P 500 (SPY) lost 1.1% on a breakdown below support at its 50-day moving average (DMA) (the red line below). This 50DMA breakdown confirms the recent ceiling at the all-time high (the black horizontal line below). However, the index is not yet in bearish territory; sellers first need to crack the last closing low. Given the current oversold trading conditions, such a breakdown would plunge the short-term technicals into greater extremes. In other words, the Grinch has a big challenge ahead trying to keep Santa from his scheduled delivery for traders and investors.
The Grinch is having an easier time stuffing the chimney of the NASDAQ (COMPQX). The tech-laden index fully confirmed a 50DMA breakdown and put 200DMA support (the blue line below) into play.
The iShares Russell 2000 ETF (IWM) remains on “breakdown watch.” When IWM traded through $209, a breakdown below the 2021 trading range became a real possibility. However, buyers stepped in front of the Grinch just in time. Still, IWM sits in a precarious state and does not look prepared for the rebound I targeted for this week.
Stock Market Volatility
The volatility index (VIX) faded sharply from its intraday highs and ended the day with a 5.9% gain. The recent trading action around and above the 20 level is looking more and more like a firming foundation. The longer the VIX lingers in this region, the longer the market’s manic behavior will last. Near the height of the VIX surge, I reflexively nibbled on some shares of ProShares Short VIX Short-Term Futures ETF (SVXY).
The Short-Term Trading Call With A Grinch In the Way
- AT50 (MMFI) = 22.1% of stocks are trading above their respective 50-day moving averages
- AT200 (MMTH) 35.3% of stocks are trading above their respective 200-day moving averages
- Short-term Trading Call: bullish
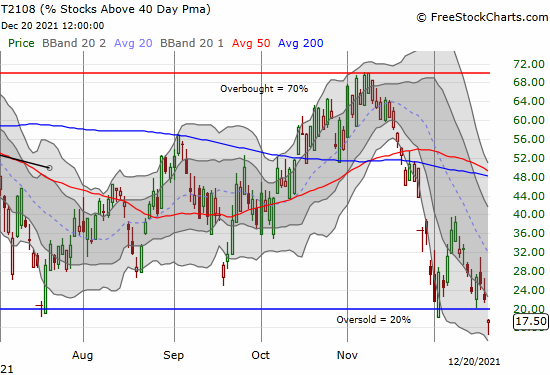
AT50 (MMFI), the percentage of stocks trading above their respective 50DMAs, closed at 22.1%. This close is quite the tease given the oversold threshold of 21%. I still call AT50 oversold based on my historical analysis. Indeed, my former favorite technical indicator AT40 (T2108) closed well below its oversold threshold of 20% (see below).
Since I started a day early on trading oversold conditions, I did not rush out loading up on fresh positions (besides SVXY). However, I am a buyer on further selling from here with the usual caveats for clear lines of technical resistance and support.
My timing worked out when I flipped bullish at the end of November. However in retrospect, I am realizing I should have downgraded to cautiously bullish when I decided it was appropriate to pick up a handful of downside hedges. Specifically, the S&P 500’s post-Fed failure at the resistance from the all-time high was the sign to downgrade. My reluctance to churn my trading call stayed my hand. As a result, note that while I am bullish on the stock market given oversold trading conditions, I am bracing for the Grinch. The caution is further warranted by AT200 hitting a new 18-month low. AT200 continues to flag an extended period of multiple oversold trading conditions.
AT40 (T2108), the percentage of stocks trading above their respective 40DMAs, closed cleanly below its 20% oversold threshold.
Be careful out there!
Footnotes
“Above the 50” (AT50) uses the percentage of stocks trading above their respective 50-day moving averages (DMAs) to measure breadth in the stock market. Breadth defines the distribution of participation in a rally or sell-off. As a result, AT50 identifies extremes in market sentiment that are likely to reverse. Above the 50 is my alternative name for “MMFI” which is a symbol TradingView.com and other chart vendors use for this breadth indicator. Learn more about AT50 on my Market Breadth Resource Page. AT200, or MMTH, measures the percentage of stocks trading above their respective 200DMAs.
Active AT50 (MMFI) periods: Day #423 over 21% (overperiod), Day #6 under 31% (underperiod), Day #17 under 40%, Day #21 under 51%, Day #23 under 60%, Day #203 under 72%
Source for charts unless otherwise noted: TradingView.com
Full disclosure: long IWM calls, long SPY call spread, short QQQ put spread, long SVXY
FOLLOW Dr. Duru’s commentary on financial markets via StockTwits, Twitter, and even Instagram!
*Charting notes: Stock prices are not adjusted for dividends. Candlestick charts use hollow bodies: open candles indicate a close higher than the open, filled candles indicate an open higher than the close.