
The CNBC headline sounds scary: “Dow rises nearly 100 points, but posts longest weekly losing streak since 2011“. It sounds like sellers have gripped the stock market!
Normally, I ignore the Dow Jones Industrial because it is meaningless as an unrepresentative price-weighted index, but I could not ignore this headline. At first blush, I thought the trading action could add to the growing weight of bearishness in the stock market. Yet, THIS is what five straight weeks of losses looks like in context…
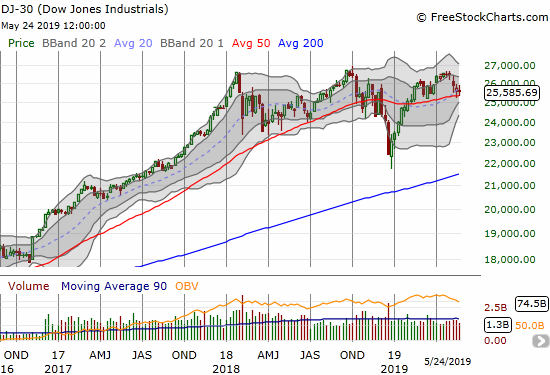
Source: FreeStockCharts
The weekly chart above is hardly scary. Here are the weekly price changes (two decimal points included on purpose for emphasis: -0.06%, -0.14%, -2.12%, -0.69%, -0.69%. Sure a triple top may be underway, but five weeks of selling in the Dow Jones Industrials (DIA) have yet to even punch through the lows set just two months ago. Last year included many more dramatic bouts of weekly selling.
Now having scoffed at the scary CNBC headline, the daily chart of the Dow DOES show a critical juncture for the psychologically important index. The Dow suffered a breakdown from support at its 50-day moving average (DMA) and confirmed that bearish move 2 days later. Since then, the Dow has bounced along 200DMA support. If that support gives way, the Dow will break its March low. Such an event could kick off a lot of selling programs which would in turn be important for individual index components.
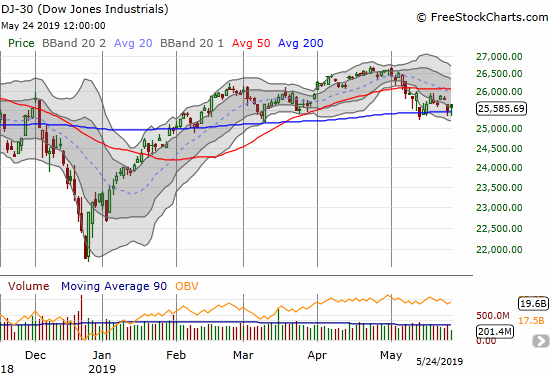
Source: FreeStockCharts
Of course, market participants will quickly forget this episode if 200DMA support holds and forms the basis of an eventual 50DMA breakout.
As always, the lesson here points to the importance of looking at the charts and the data before accepting the implications of a headline. In this case, the CNBC headline overstates the existing market damage, but it could become a prelude to some TRUE market damage. Stay tuned.
Be careful out there!
Full disclosure: no positions