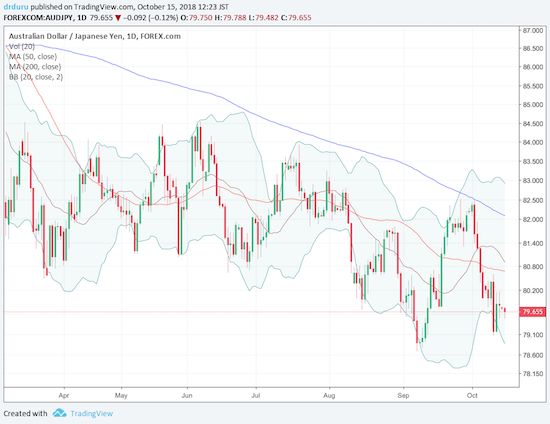
I often use the Australian dollar (FXA) versus the Japanese yen (JPY) as a proxy for the market’s risk tolerance. If AUD/JPY is rising, the market is bullish. If AUD/JPY is falling, the market is bearish. The correlation is not as consistent as I would like, so I use it with caution, caveats, and context. AUD/JPY has fallen almost each day this month and has performed quite consistently with the current bearish mood in financial markets. AUD/JPY bounced one day ahead of the stock market and in so doing held support from the September and 2018 low. I want to interpret this bounce as a positive sign confirming the potential for a market bottom.

Source: TradingView
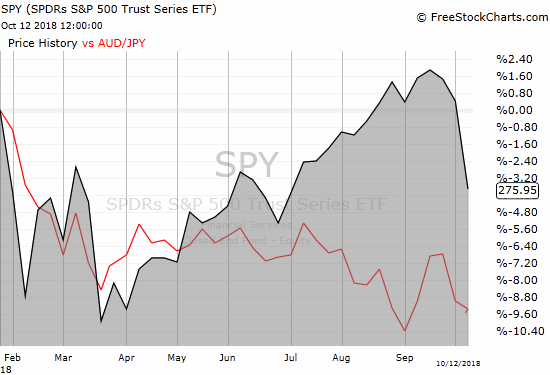
The recent correlations between AUD/JPY and the S&P 500 (SPY) are relatively consistent. I use a weekly calculation because daily moves are too volatile. For this exercise, I used Tuesday’s as the week-ending day to avoid complications with U.S. holidays and the forex trading on Sunday night U.S. time. Here are the correlations ending Tuesday, October 9th (data available for download in an Excel file here)…
- From July 11, 2017: 0.52
- For 2018: 0.57
- Since April: 0.57
The correlations are not great, but they are sufficiently high for my trading purpose (when including caution, caveats, and context!). In other words, if AUD/JPY continues higher from here, I will assume a market rally will continue in parallel. If AUD/JPY returns to its downtrend, then I will expect a rally to fade in due time.

Source: FreeStockCharts.com
Be careful out there!
Full disclosure: no positions
