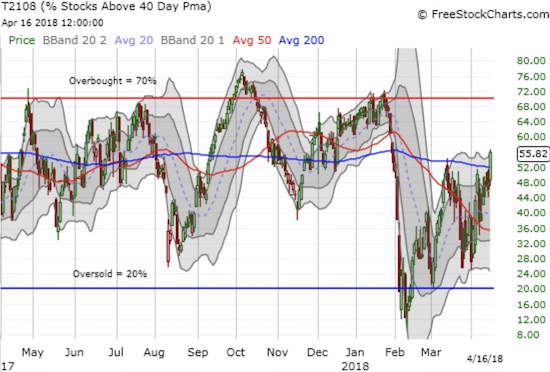
AT40 = 55.8% of stocks are trading above their respective 40-day moving averages (DMAs)
AT200 = 46.3% of stocks are trading above their respective 200DMAs
VIX = 16.6
Short-term Trading Call: neutral
Commentary
The buyers went right back to work after bears engulfed the end of trading last week. The indices crept higher on the day toward critical resistance at their 50-day moving averages (DMAs). Even more important to me was the performance of my favorite technical indicator, AT40 (T2108) aka the percentage of stocks trading above their respective 40DMAs. For the first time in 23 trading days, AT40 closed above 50%. AT40 is at its highest close since January 30th which means that once again it is on the edge of overcoming all the angst of the big sell-off that led to persistent oversold conditions in February. This breakout is unseen to most market participants, but I am sitting up straight and taking notes…
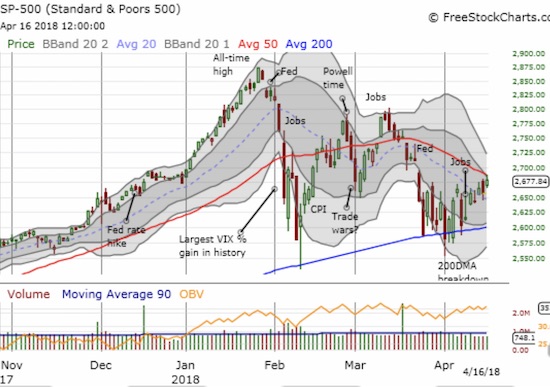
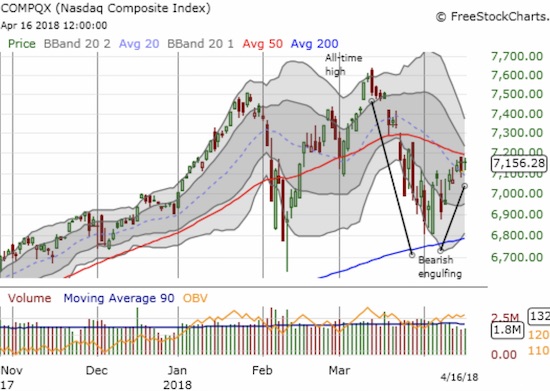
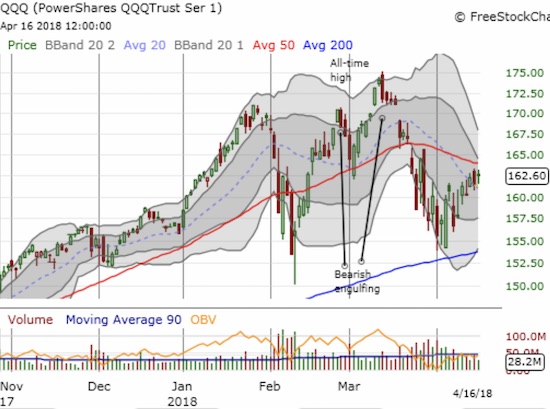
The S&P 500 (SPY) gained 0.8% after fading a bit from 50DMA resistance. The good news is that the index is actually managing an upward bias since its last test of 200DMA support. The NASDAQ gapped up right to 50DMA resistance on Friday. On Monday, the NASDAQ gapped up again but stopped cold again right under 50DMA resistance with a 0.7% gain. The price action for the PowerShares QQQ ETF (QQQ) was similar to the NASDAQ but a test of 50DMA resistance has yet to quite occur.
Given the upward bias growing in the major indices, I should not be surprised to see the volatility index, the VIX, continue to implode. Yet on Friday I locked in profits on my iPath S&P 500 VIX ST Futures ETN (VXX) short and bought call options on ProShares Ultra VIX Short-Term Futures (UVXY) in anticipation of more market chop along with a VIX rebound. The VIX rebound may still happen this week given it is well over-extended below its lower-Bollinger Band (BB). The chart below shows a cautionary tale of what happened when the VIX last extended this far below its lower-BB (in March)…
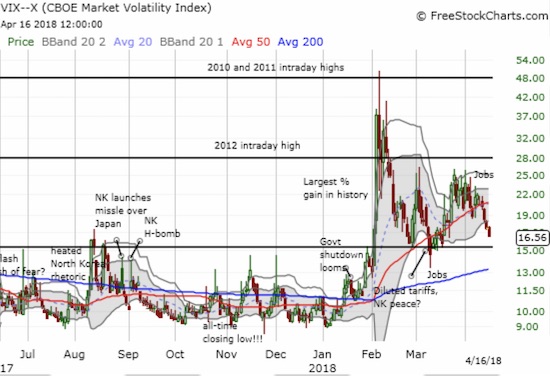
The market has experienced 2 1/2 months of selling and churn. The exhaustion of one side or the other appears near and the sellers are looking more tired right now. AT40 is leading the way to a buyer’s breakout. Still, if the major indices cannot do their part in breaking 50DMA resistance and confirming the AT40 breakout, then the churn will start all over again. The VIx will spike higher (and I will quickly re-establish a VXX short!). Under the setback scenario, at least buyers can lean on the growing pattern of higher highs and higher lows. Needless to say my short-term trading call stays firmly locked on neutral.
CHART REVIEWS
Whirlpool (WHR)
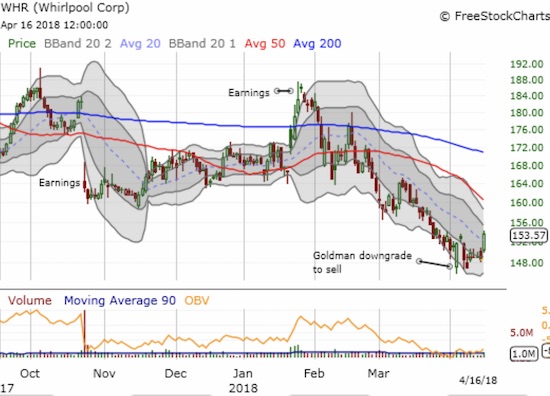
With bullish tidings bubbling up, I can look at a chart like WHR and see a firming bottom. On April 4th, Goldman Sachs (GS) downgraded WHR to a sell. The stock promptly gapped down but buyers took over from there. A 2.8% loss at the open turned into a slight gain by the close – the trading looked like a final washout of sellers. Sellers regained control one more time and challenged the intraday low two and three days later. On Monday, WHR gained 3.4% and closed at a fresh post-downgrade high.
WHR reports earnings next Monday on the morning of the 23rd, so there are high risks holding onto a new position through earnings. However, a rally into earnings looks underway. If WHR can survive this earnings announcement by holding its recent low, it will make a very good buy. The easy stop loss is at a new low, and may even be the signal that sellers have finally established firm control on the stock.
— – —
FOLLOW Dr. Duru’s commentary on financial markets via email, StockTwits, Twitter, and even Instagram!
“Above the 40” uses the percentage of stocks trading above their respective 40-day moving averages (DMAs) to assess the technical health of the stock market and to identify extremes in market sentiment that are likely to reverse. Abbreviated as AT40, Above the 40 is an alternative label for “T2108” which was created by Worden. Learn more about T2108 on my T2108 Resource Page. AT200, or T2107, measures the percentage of stocks trading above their respective 200DMAs.
Active AT40 (T2108) periods: Day #41 over 20%, Day #10 over 30%, Day #5 over 40%, Day #1 over 50% (overperiod, ending 23 days under), Day #49 under 60%, Day #55 under 70%
Daily AT40 (T2108)

Black line: AT40 (T2108) (% measured on the right)
Red line: Overbought threshold (70%); Blue line: Oversold threshold (20%)
Weekly AT40 (T2108)

*All charts created using freestockcharts.com unless otherwise stated
The charts above are my LATEST updates independent of the date of this given AT40 post. For my latest AT40 post click here.
Related links:
The AT40 (T2108) Resource Page
You can follow real-time T2108 commentary on twitter using the #T2108 or #AT40 hashtags. T2108-related trades and other trades are occasionally posted on twitter using the #120trade hashtag.
Be careful out there!
Additional disclosure: long SPY shares
*Charting notes: FreeStockCharts.com stock prices are not adjusted for dividends. TradingView.com charts for currencies use Tokyo time as the start of the forex trading day. FreeStockCharts.com currency charts are based on Eastern U.S. time to define the trading day.
