
(T2108 measures the percentage of stocks trading above their respective 40-day moving averages [DMAs]. It helps to identify extremes in market sentiment that are likely to reverse. To learn more about it, see my T2108 Resource Page. You can follow real-time T2108 commentary on twitter using the #T2108 hashtag. T2108-related trades and other trades are occasionally posted on twitter using the #120trade hashtag. T2107 measures the percentage of stocks trading above their respective 200DMAs)
T2108 Status: 49.6%
T2107 Status: 71.9%
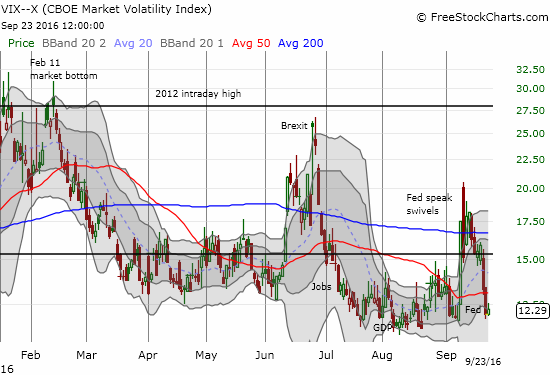
VIX Status: 12.3
General (Short-term) Trading Call: neutral
Active T2108 periods: Day #151 over 20%, Day #7 over 30%, Day #1 over 40% (overperiod, ending 1 day over 50%), Day #1 under 50% (underperiod), Day #11 under 60%, Day #39 under 70%
Commentary
The bulls and buyers secured the advantage in the immediate wake of another post-Fed celebration. That momentum surprisingly hit a brick wall on Friday, September 23rd. The S&P 500 (SPY) broke out above resistance at its 50-day moving average (DMA) the previous day only to gap down and close below that trend line to end the week.
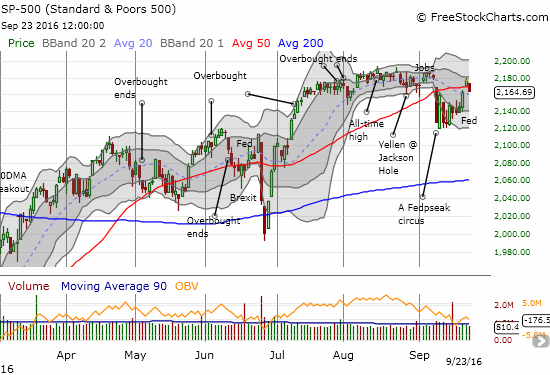
T2108, the percentage of stocks trading above their respective 40DMAs, pulled back sharply from 56.1% to 49.6%. Just as the S&P 500 now looks like it might be stuck in a previous pattern, T2108 now looks like it might be stuck with the downtrend that flagged the last pullback in the S&P 500.
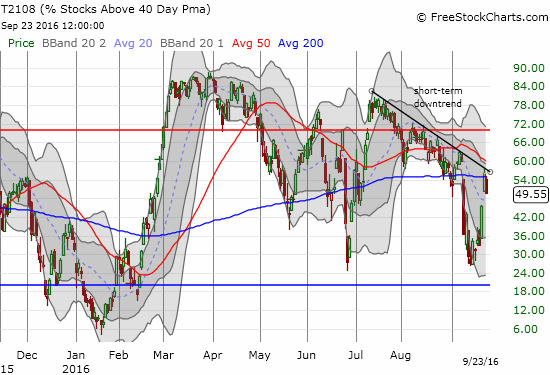
These two charts combine to keep me at neutral for the short-term trading call. I would be inclined to drop to cuatiously bearish except that sellers already proved themselves toothless with the pre-Fed surge off “almost oversold” conditions. However, the volatility index, the VIX, is back to what has proven to be its lower bound. It is only a matter of time before something else triggers a volatility surge. I just dare not guess what that might be in the short-term…
The biggest news for me on the day was Twitter (TWTR). Earlier this month, I noted that TWTR survived a test of 200DMA support and looked ready to bypass two earlier sell ratings. TWTR had to make one more test of that support before emphatically leaving those sell ratings in the dust. More M&A rumors sent TWTR surging 21.4% on the day. I locked in profits on a call option. More importantly, my short put is solidly in the green. I sold this put about 13 months ago. TWTR is LOWER than its trading level at that time. This experience demonstrates the attractiveness of selling long-dated puts on the heels of an extended rough patch for a quality company/stock. For more background on the setup, see my related piece “How to Buy Twitter’s Stock for Less Than $20/Share.”

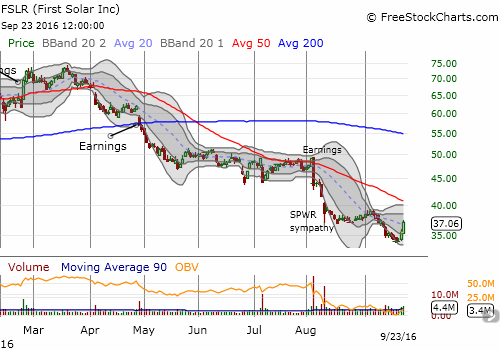
With my TWTR play heating up, I immediately turned my attention to First Solar (FSLR). I have had my eye more closely trained on this leading solar company ever since the market slammed the stock twice in August on earnings-related news. At its low point, FSLR traded around a 3 1/2 year low, a 0.65 price/book ratio, a 0.95 price/sales ratio, a 5.5 trailing P/E, and a 16.7 forward P/E (according to Yahoo Finance). Using my framework explained in “Anatomy of A Bottom: Do Not Argue With Sellers – Celebrate With Buyers,” I sold a January, 2018 put option on FSLR. Despite the 2-day jump in the stock, the premium is still very high, suggesting traders are committed to a near doomsday scenario for FSLR. I sold the put option at a $35 strike for $6.50.
Using "Anatomy of A Bottom: Do Not Argue With Sellers – Celebrate With Buyers", sold $FSLR put earlier. https://t.co/Jc21duqcCl #122trade
— Dr. Duru (@DrDuru) September 23, 2016
Finally, Apple (AAPL) became my ironic big miss of the day. The top that I predicted last week remained in place all week. Confirmation seemed to come on a swift sell-off to close the week. Unfortunately, I had already given up on my put options expiring with a $112 strike and did not have an order in place to take advantage of the sudden plunge (I would have salvaged most of the value). The presumed driver of the drop was more analyst chatter that iPhone 7 sales may not be nearly as good as previously rumored.
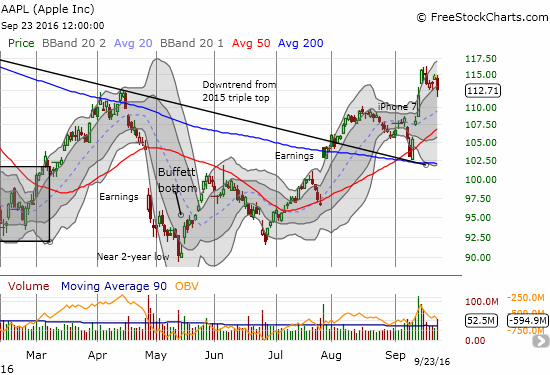
I am now sitting on an AAPL call option which is just a bet on a rapid reversal of the quick-trigger selling.
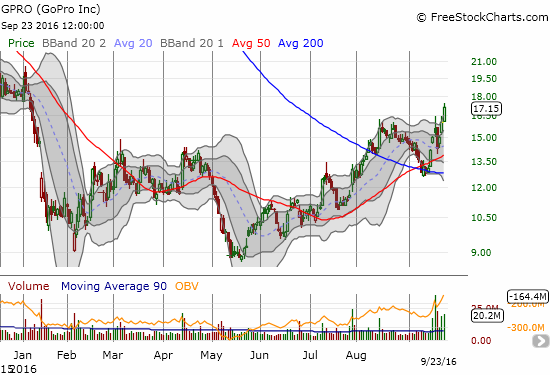
Finally, finally, I held my nose a little over a month ago and bought GoPro (GPRO) on a bet that the stock was breaking out above 200DMA support. The stock quickly proceeded to test its 200DMA as support (a pattern I need to remember on these breakouts for stocks struggling to carve a bottom!). This week brought validation of the breakout. GPRO spent four days wrestling with 200DMA support mid-September, surged on September 15th, and last week buyers descended upon the stock even as GPRO experienced a steep pullback in the middle of the buying (trigger reaction following an investor day and new product announcements for Hero 5 cameras and the Karma drone). The stock looks “good to go” now, and I will keep holding my nose…
— – —
FOLLOW Dr. Duru’s commentary on financial markets via email, StockTwits, Twitter, and even Instagram!
Daily T2108 vs the S&P 500
")
Black line: T2108 (measured on the right); Green line: S&P 500 (for comparative purposes)
Red line: T2108 Overbought (70%); Blue line: T2108 Oversold (20%)
Weekly T2108

*All charts created using freestockcharts.com unless otherwise stated
The charts above are the my LATEST updates independent of the date of this given T2108 post. For my latest T2108 post click here.
Related links:
The T2108 Resource Page
Be careful out there!
Full disclosure: long SDS, long UVXY shares, long AAPL call