
Currencies are a transmission mechanism. Since the financial crisis, central banks have become increasingly adept at manipulating them as agents of monetary policy. Traders who ignore currencies may have critical blindspots as stock markets twist and turn through currency transmissions. From time-to-time, I will post “Forex Critical” to highlight currency charts that I believe are of particular interest because of an urgent and meaningful technical setup. These currency pairs will typically sit at important technical junctures, trends, and/or critical breakdowns and breakouts.
I kick-off this series in the wake of Congressional testimony from the U.S. Federal Reserve’s Chair Janet Yellen. Currency markets behaved in a way that suggests traders did not quite know what to make of Yellen’s admission that rate hikes may need to slow while also standing firm with data-driven decision-making.
The currencies of interest: the U.S. dollar (DXY0), the Japanese yen (FXY), the British pound (FXB), and the Canadian dollar (FXC).
The U.S. dollar index rallied right to resistance at its 200-day moving average (DMA) only to fall back to a fresh 4-month closing low. This trading action confirms the recent breakdown and makes the dollar increasingly unattractive. “Policy divergence” is waning more and more as an important trading theme. To-date, some pundits (like Jim Cramer of CNBC and TheStreet.com) have pleaded for a weaker U.S. dollar to help boost the fortunes of American companies and the stock market. The recent weakness has not helped the stock market one bit so far..
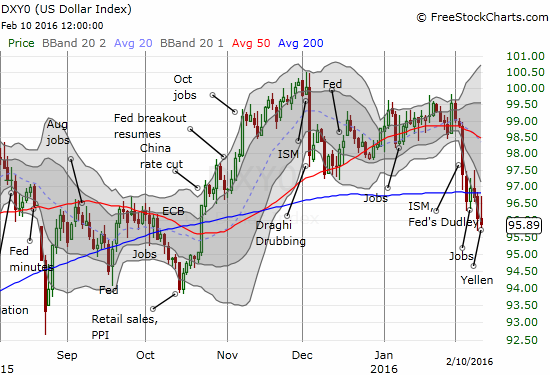
This chart of the U.S. dollar index is important context for the remaining charts…
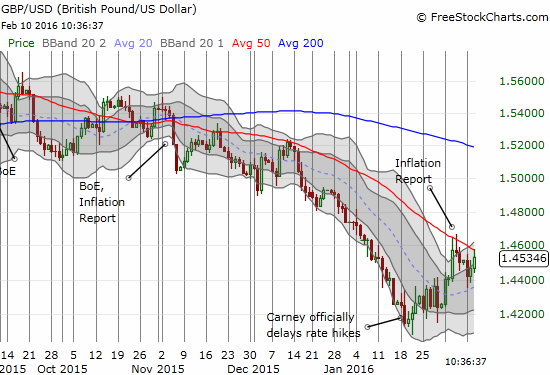
The British pound is starting to turn the corner against the U.S. dollar (GBP/USD). I recently wrote about the Bank of England’s path to rate hike interruptus in “The Bank of England’s Recent Retreat On Rate Hikes (A Blueprint for the Fed?).” Governor Mark Carney’s official acknowledgement of what the market had long suspected served as a bottom. While GBP/USD is currently struggling to break through 50DMA resistance, the 20DMA has turned the corner AND the upper-Bollinger Bands (BBs) channel is decidedly pointed upward. Momentum is slowly but surely turning. A newly resurgent British pound will likely face more and more dovish talk from the Bank of England.
Even as oil fights off fresh multi-year lows, the Canadian dollar has notably stopped weakening. The BIG 50DMA breakdown on February 3, 2016 for USD/CAD marked a significant and meaningful move that confirmed the recent top. Both BB channels are pointing downward as the 20DMA is as well. The 50DMA looks ready to provide a definitive test of the next direction for USD/CAD. I will only return to trading USD/CAD on its overall uptrend, if USD/CAD climbs atop the high of the big breakdown day. Until then, I am assuming the next big move for USD/CAD is downward.

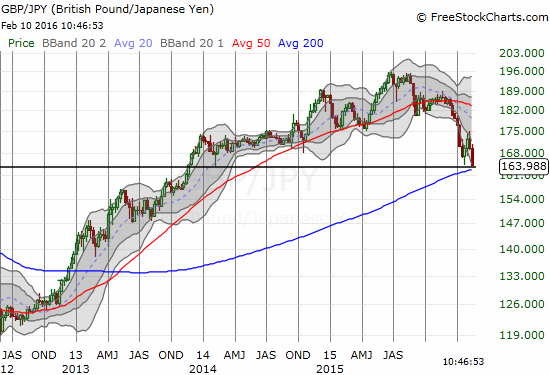
My favorite chart is the British pound versus the Japanese yen (GBP/JPY). I zoomed out to weekly view to make clear the major breakdown underway. At the time of writing, GBP/JPY sits at levels last seen in late 2013. From here, just a little bit of a push could send GBP/JPY descending quite a long way down before some kind of bottom occurs. This pair combines the stubbornly weak British pound with the stubbornly strong Japanese yen: a match made in downsides.
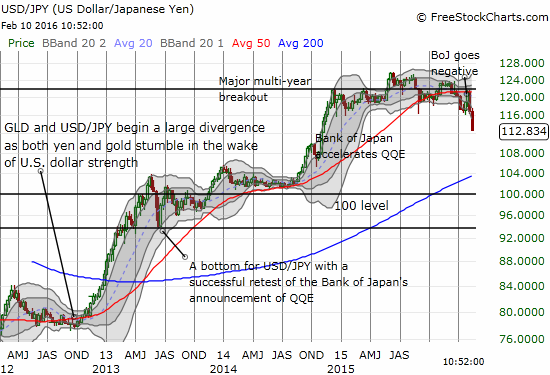
The U.S. dollar versus the Japanese yen is the chart I do not want to believe! Policy divergence had me convinced that USD/JPY in particular would inevitably begin a new phase of upward trending. The Bank of Japan went negative, experienced a few days of yen weakness, and then watched as the yen resumed its strength. On the daily chart (not shown), USD/JPY crashed through presumed support at 115 or so, the bottom of a 15-month or so trading range. This breakdown flashes a fresh red warning signal even brighter than the one I flashed to begin the year. USD/JPY could slide swiftly from here because little to no “natural resistance” exists between here until 105 and then 100! (This is true on the weekly AND the daily).
Source for charts: FreeStockCharts.com
I have a mixed trading strategy right that is in transition to more consistency. I am short GBP/JPY and long both GBP/USD and USD/JPY. GBP/USD started as a hedge against my dollar bullishness, but it failed relatively miserably in that role until recently. GBP/JPY has been a welcome add to the mix and relieved some of the pain of long USD/JPY. The time is nearing to greatly expand the short on GBP/JPY and scale down USD/JPY. USD/CAD is an intriguing intraday play that I prefer to short given my current assumption 50MDA resistance will hold. A breakout would swiftly return me to riding the USD/CAD uptrend.
Be careful out there!
Full disclosure: long FXC, short GBP/JPY, long USD/JPY, long GBP/USD
Thanks for sharing your insights. I also use BB to get a feel for where the market is going, but you’re take on this had added a fresh perspective.