
(T2108 measures the percentage of stocks trading above their respective 40-day moving averages [DMAs]. It helps to identify extremes in market sentiment that are likely to reverse. To learn more about it, see my T2108 Resource Page. You can follow real-time T2108 commentary on twitter using the #T2108 hashtag. T2108-related trades and other trades are occasionally posted on twitter using the #120trade hashtag. T2107 measures the percentage of stocks trading above their respective 200DMAs)
T2108 Status: 43.2%
T2107 Status: 33.3%
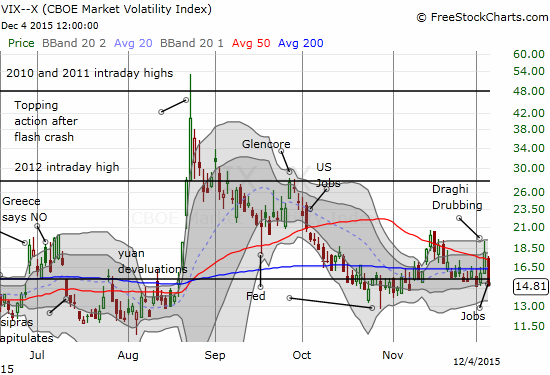
VIX Status: 14.8
General (Short-term) Trading Call: neutral
Active T2108 periods: Day #44 over 20%, Day #43 over 30%, Day #1 over 40% (ending 11 day under 40%) (overperiod), Day #3 below 50% (underperiod), Day #17 und8r 60%, Day #358 under 70%
Reference Charts (click for view of last 6 months from Stockcharts.com):
S&P 500 or SPY
SDS (ProShares UltraShort S&P500)
U.S. Dollar Index (volatility index)
EEM (iShares MSCI Emerging Markets)
VIX (volatility index)
VXX (iPath S&P 500 VIX Short-Term Futures ETN)
EWG (iShares MSCI Germany Index Fund)
CAT (Caterpillar).
IBB (iShares Nasdaq Biotechnology).
Commentary
Once again, T2108 dropping below 40%, particularly in rapid fashion, was enough to generate a quick rebound. This rebound was apparently catalyzed by a strong U.S. jobs report. However, I think it may be more appropriate to just say this rebound represents a simple reversal of the angst going into the jobs number – angst that was suddenly starved of further fuel.
I said the following in the last T2108 Update in preparation for Friday’s trading action:
“The next catalyst for the market is the U.S. jobs report for November. Just as the market was primed to react poorly to bad news the previous day, it is now primed to react very well to good news. I honestly have no idea anymore whether a strong jobs report will be interpreted as good or bad by the market at this juncture where a rate hike seems like a done deal. I will be in reaction mode, not prediction mode.”
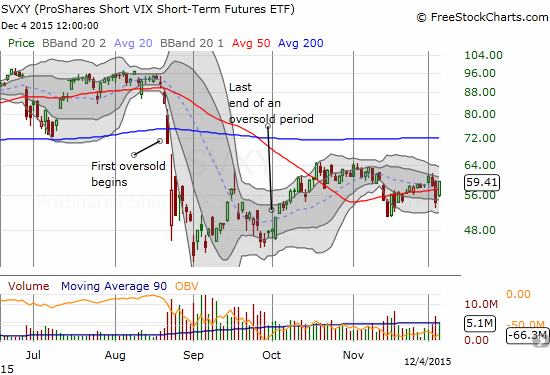
As planned, my reaction was to fade volatility. I waited a few minutes after the open to be relatively confident that the market was more than likely to react positively. I bought shares in ProShares Short VIX Short-Term Futures (SVXY). In hindsight, I should have loaded up. I sold my position at the close: I did not want to stay exposed to volatility over the weekend.
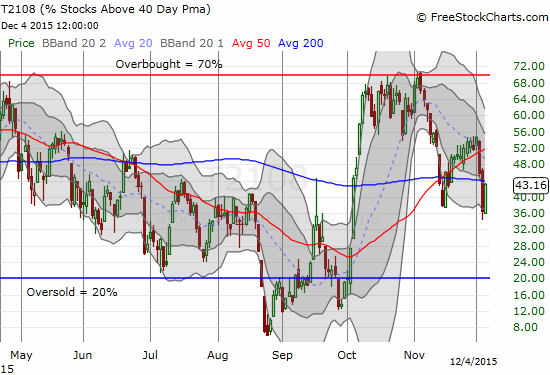
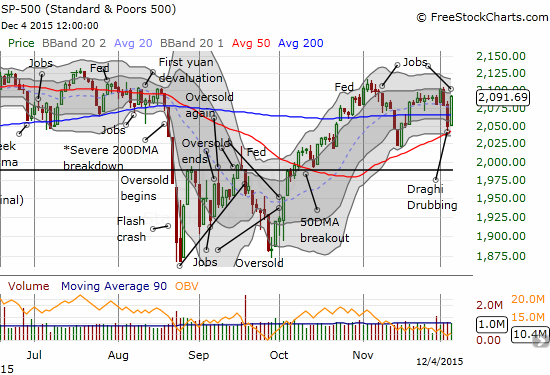
Note well that for the second time this week, a rally left T2108 and the S&P 500 notably out of sync. While the S&P 500 made an impressive gain reversing the previous day’s loss and then some, T2108 fell well short. This was not just another rebound for the S&P 500. This unbalanced bounce provides yet more evidence that the market’s breadth is poor. The upside is not shared by nearly as many stocks as the downside (relative to the 40-day moving average). So, once again, I am very wary of the sustainability of the sudden bounce in the market. The last mismatch occurred on the big rally that started December and preceded a 2-day pullback.
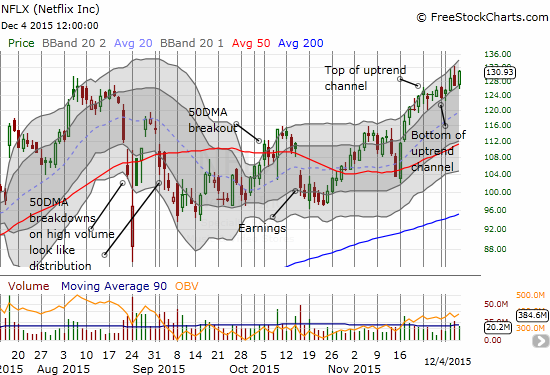
The good side of a market with thin participation is that I know immediately where to look for ripe buying opportunities on a bullish day. Second to fading volatility was going long Netflix (NFLX). NFLX had a great setup sitting right at the bottom of an uptrend channel well defined by the two upper-Bollinger Bands (BB). Like SVXY, I was looking for a one day trade. For NFLX, this meant loading up on weekly call options expiring the same day. I made two purchases, one at the open and another on NFLX’s pullback. Despite the relative underperformance at the time, I stuck to the thesis. NFLX ended the day with a nice 3.25% gain. I did not hold my position into the close given the risks involved with expiration occurring on the same day. The fresh all-time high combined with the uptrend promises to make NFLX a popular trade as momentum players swarm into position…
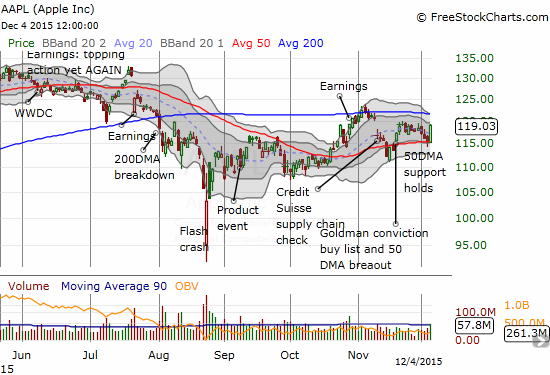
Apple (AAPL) has not been as reliable a play on bullish days but on THIS day, it was as much a champ as Netflix. I was well-positioned to play AAPL’s near picture-perfect bounce off support at its 50DMA. AAPL delivered a 3.3% gain. Once again, I did not hold my call options into the close, but I cannot complain.
After it was all said and done, the S&P 500 ended the week pretty much where it ended the previous week. The valuable trades occurred from day-to-day and not overplaying any one move. I expect more of the same in the coming week as the market gets more and more antsy in anticipation of a Fed rate hike on December 16th.
Daily T2108 vs the S&P 500
")
Black line: T2108 (measured on the right); Green line: S&P 500 (for comparative purposes)
Red line: T2108 Overbought (70%); Blue line: T2108 Oversold (20%)
Weekly T2108

*All charts created using freestockcharts.com unless otherwise stated
The charts above are the my LATEST updates independent of the date of this given T2108 post. For my latest T2108 post click here.
Related links:
The T2108 Resource Page
Expanded daily chart of T2108 versus the S&P 500
Expanded weekly chart of T2108
Be careful out there!
Full disclosure: no positions